

Screening for Turner Syndrome-Associated Hyperglycemia: Evaluating Hemoglobin A1c and Fasting Blood Glucose
- PMID: 37788658
- PMCID: PMC10987397
- DOI: 10.1159/000534371
Screening for Turner Syndrome-Associated Hyperglycemia: Evaluating Hemoglobin A1c and Fasting Blood Glucose
Abstract
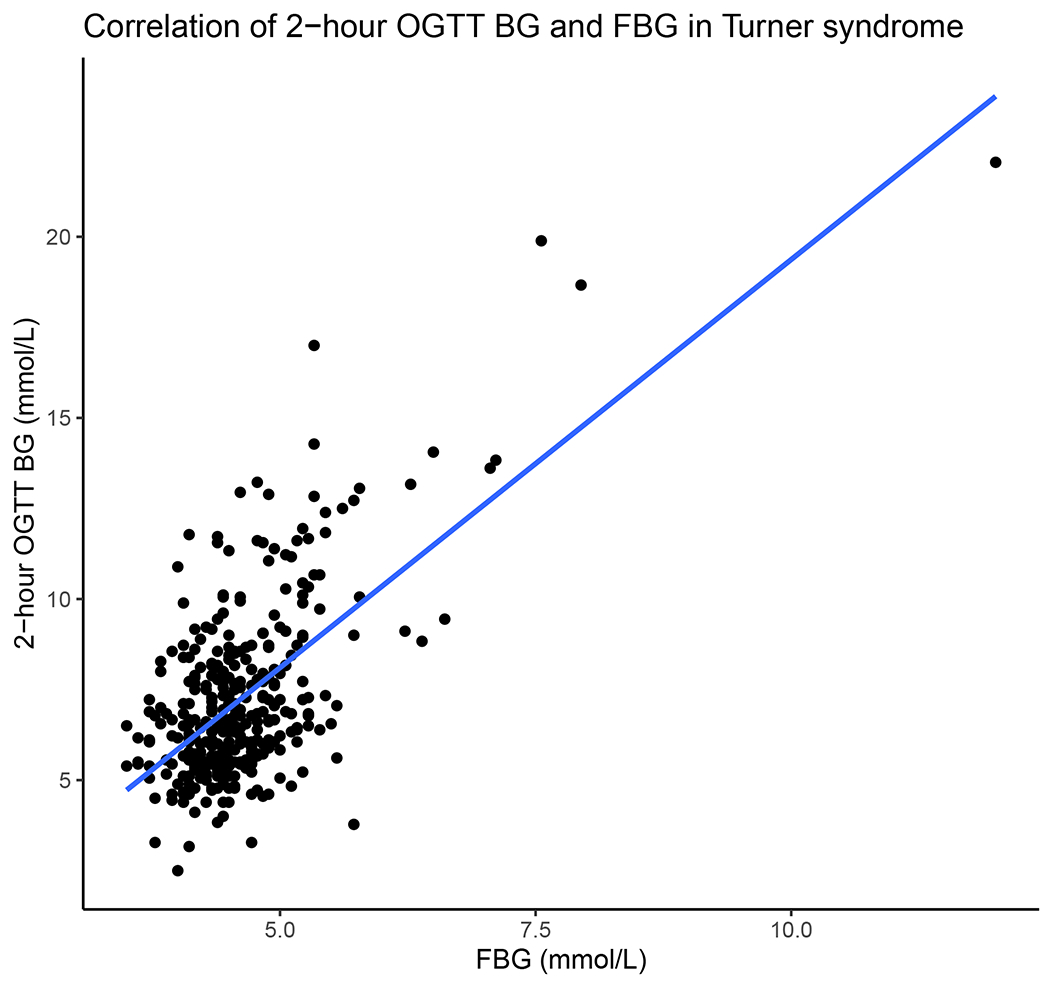
Introduction: Individuals with Turner syndrome (TS) are at increased risk of developing diabetes mellitus (DM). Currently, annual DM screening with hemoglobin A1c (HbA1c) with or without fasting blood glucose (FBG) is recommended starting at age 10. However, the optimal DM screening for individuals with TS is not known. The purpose of this study was to evaluate the correlation between HbA1c, FBG, and the 2-h oral glucose tolerance test (OGTT). A second goal was to query whether optimal HbA1c and FBG cut points for TS-associated DM and impaired glucose tolerance (IGT), as defined by the OGTT 2-h blood glucose (BG), might differ from those for the general population.
Methods: Individuals with TS ≥ age 10 from the TS: Genotype Phenotype study in the National Institute of Child Health and Human Development's Data and Specimen Hub (DASH) who had 2-h OGTT BG, HbA1c, and FBG were included. Correlations between HbA1c, FBG, and 2-h OGTT BG were evaluated. Areas under the receiver operative characteristic (ROC-AUC) curves were generated. Optimal cut points for predicting TS-associated IGT (2-h BG ≥7.77 mmol/L) and DM (2-h BG ≥11.10 mmol/L) were determined.
Results: 348 individuals had complete data (2-h OGTT BG <7.77 mmol/L, n = 239; TS-associated IGT, n = 79; DM, n = 30). ROC-AUC was poor for HbA1c to predict IGT (0.57, 0.49-0.65) but better for DM (0.81, 0.71-0.90). ROC-AUC was also poor for FBG to predict IGT (0.63, 0.56-0.70) but better for DM (0.85, 0.77-0.93). At a cut point of 38 mmol/mol (5.6%), HbA1c had 67% sensitivity (95% CI: 47-83%) and 86% specificity (95% CI: 82-90%) for identifying TS-associated DM defined by 2-h OGTT BG.
Conclusions: The correlation of HbA1c and 2-h OGTT BG is lower in TS than in other published studies regarding type 2 DM. HbA1c is fairly specific for DM in TS but lacks sensitivity, especially at currently utilized levels. Future research should focus on characterizing individuals with TS whose glycemic status is discordant, as this may provide additional insights into the pathophysiology of glucose metabolism in TS. Longitudinal assessment of glycemia as it relates to micro- and macrovascular complications in individuals with TS will further inform DM screening in this population.
Keywords: Diabetes mellitus; Fasting blood glucose; Hemoglobin A1c; Oral glucose tolerance test; Turner syndrome.
© 2023 The Author(s). Published by S. Karger AG, Basel.
Conflict of interest statement
Conflict of Interest Statement
The authors have no conflicts of interest to declare.
Figures


Similar articles
-
Combined use of fasting plasma glucose and glycated hemoglobin A1c in the screening of diabetes and impaired glucose tolerance.Acta Diabetol. 2010 Sep;47(3):231-6. doi: 10.1007/s00592-009-0143-2. Epub 2009 Sep 17. Acta Diabetol. 2010. PMID: 19760291
-
Comparison of HbA1c and OGTT for the diagnosis of type 2 diabetes in children at risk of diabetes.Pediatr Neonatol. 2019 Aug;60(4):428-434. doi: 10.1016/j.pedneo.2018.11.002. Epub 2018 Nov 9. Pediatr Neonatol. 2019. PMID: 30497969
-
Does HbA1C predict isolated impaired fasting glycaemia in the oral glucose tolerance test in subjects with impaired fasting glycaemia?Ann Clin Biochem. 2008 Jul;45(Pt 4):418-20. doi: 10.1258/acb.2008.008017. Ann Clin Biochem. 2008. PMID: 18583629
-
Newly detected abnormal glucose regulation and long-term prognosis after acute myocardial infarction: Comparison of an oral glucose tolerance test and glycosylated haemoglobin A1c.Int J Cardiol. 2016 Jul 1;214:310-5. doi: 10.1016/j.ijcard.2016.03.199. Epub 2016 Mar 31. Int J Cardiol. 2016. PMID: 27085117 Review.
-
Review of methods for detecting glycemic disorders.Diabetes Res Clin Pract. 2020 Jul;165:108233. doi: 10.1016/j.diabres.2020.108233. Epub 2020 Jun 1. Diabetes Res Clin Pract. 2020. PMID: 32497744 Free PMC article. Review.
Cited by
-
The Influence of X Chromosome Parent-of-Origin on Glycemia in Individuals with Turner Syndrome.Horm Res Paediatr. 2024 Nov 18:1-9. doi: 10.1159/000542677. Online ahead of print. Horm Res Paediatr. 2024. PMID: 39557026
References
-
- Gravholt CH, Viuff M, Just J, Sandahl K, Brun S, van der Velden J, et al. The changing face of Turner syndrome. Endocrine reviews. 2022. Jun 13. - PubMed
-
- Forbes AP, Engel E. The high incidence of diabetes mellitus in 41 patients with gonadal dysgenesis, and their close relatives. Metabolism: clinical and experimental. 1963. May;12:428–39. - PubMed
-
- Menzinger G, Fallucca F, Andreani D. Gonadal dysgenesis and diabetes. Lancet. 1966. Jun 4;1(7449):1269. - PubMed
-
- Holl RW, Kunze D, Etzrodt H, Teller W, Heinze E. Turner syndrome: final height, glucose tolerance, bone density and psychosocial status in 25 adult patients. European journal of pediatrics. 1994. Jan;153(1):11–6. - PubMed
-
- Schmidt F, Kapellen TM, Wiegand S, Herbst A, Wolf J, Frohlich-Reiterer EE, et al. Diabetes mellitus in children and adolescents with genetic syndromes. Exp Clin Endocrinol Diabetes. 2012. Nov;120(10):579–85. - PubMed
MeSH terms
Substances
Grants and funding
LinkOut - more resources
Full Text Sources
Medical
