. 2023 Oct 12;186(21):4528-4545.e18.
doi: 10.1016/j.cell.2023.09.009. Epub 2023 Oct 2.

Epigenetic balance ensures mechanistic control of MLL amplification and rearrangement

Affiliations

Epigenetic balance ensures mechanistic control of MLL amplification and rearrangement

Zach H Gray et al. Cell. .

Abstract

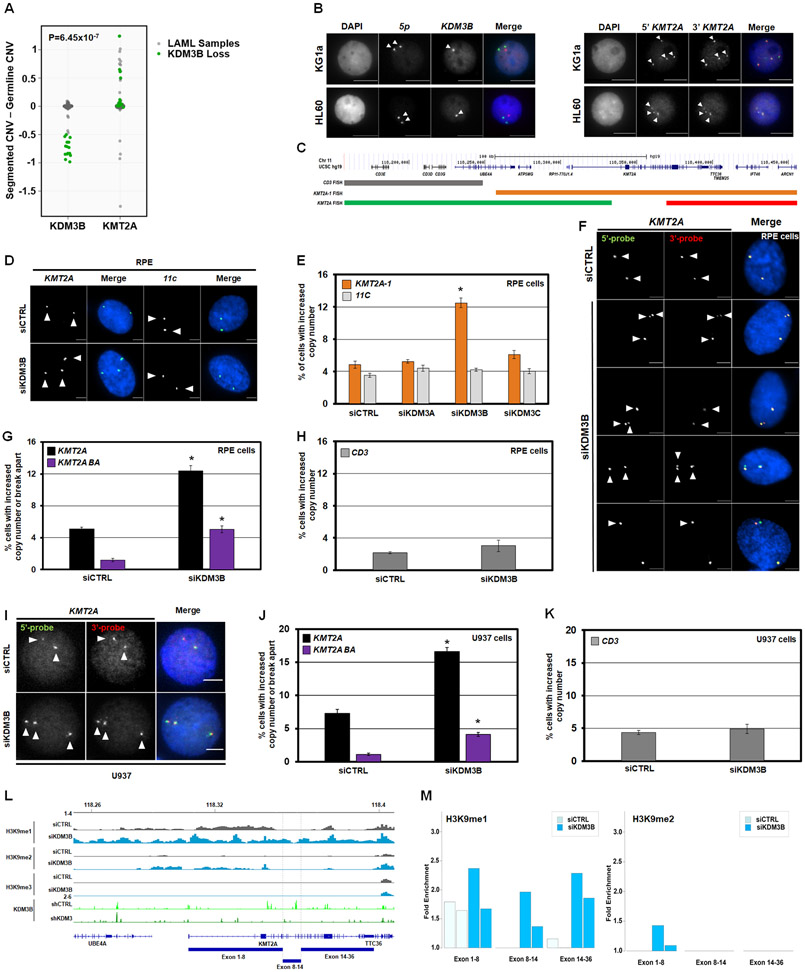
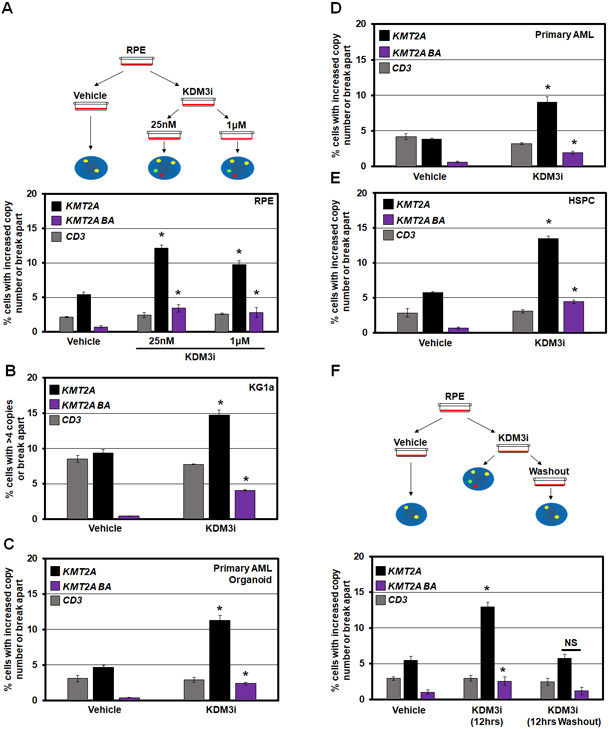
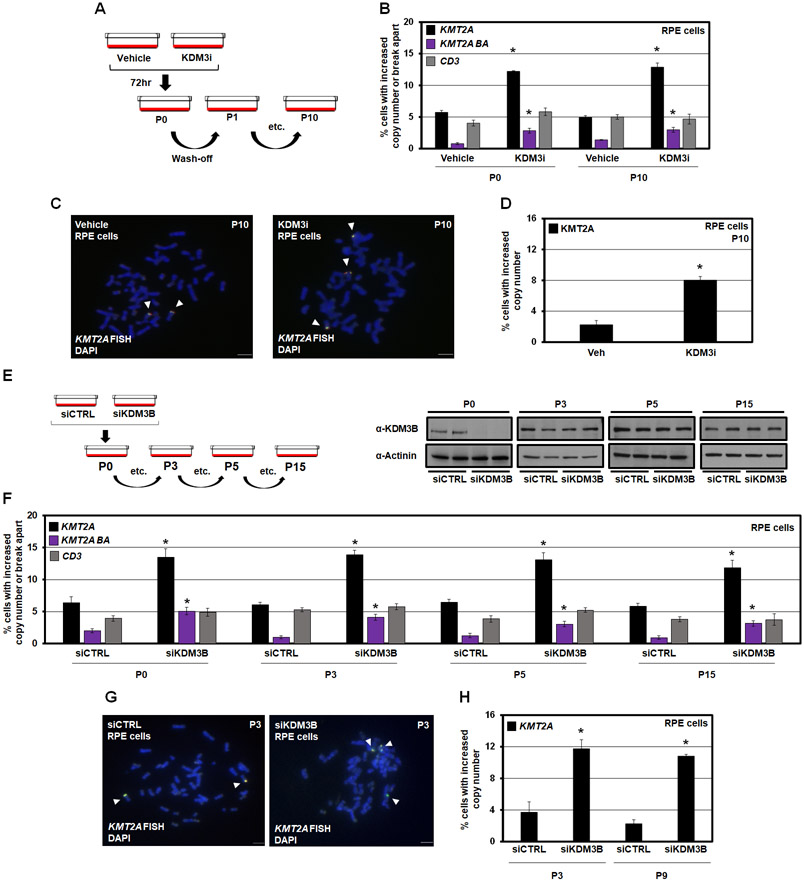
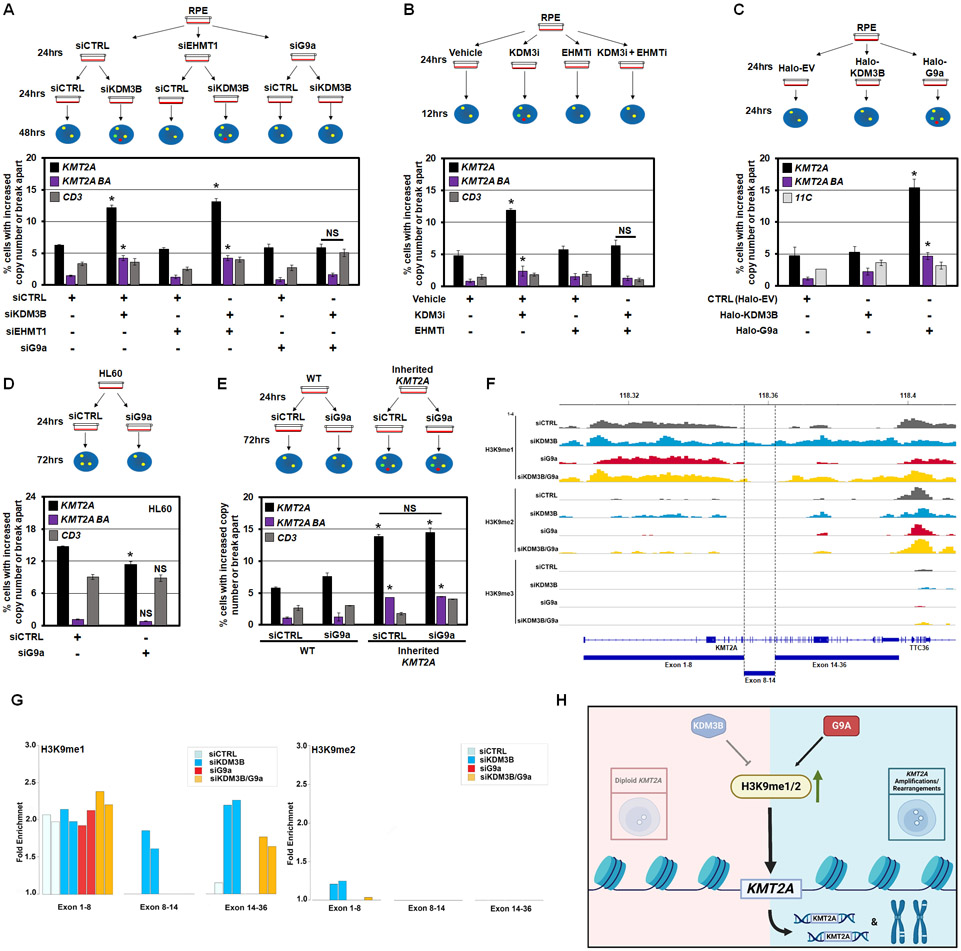
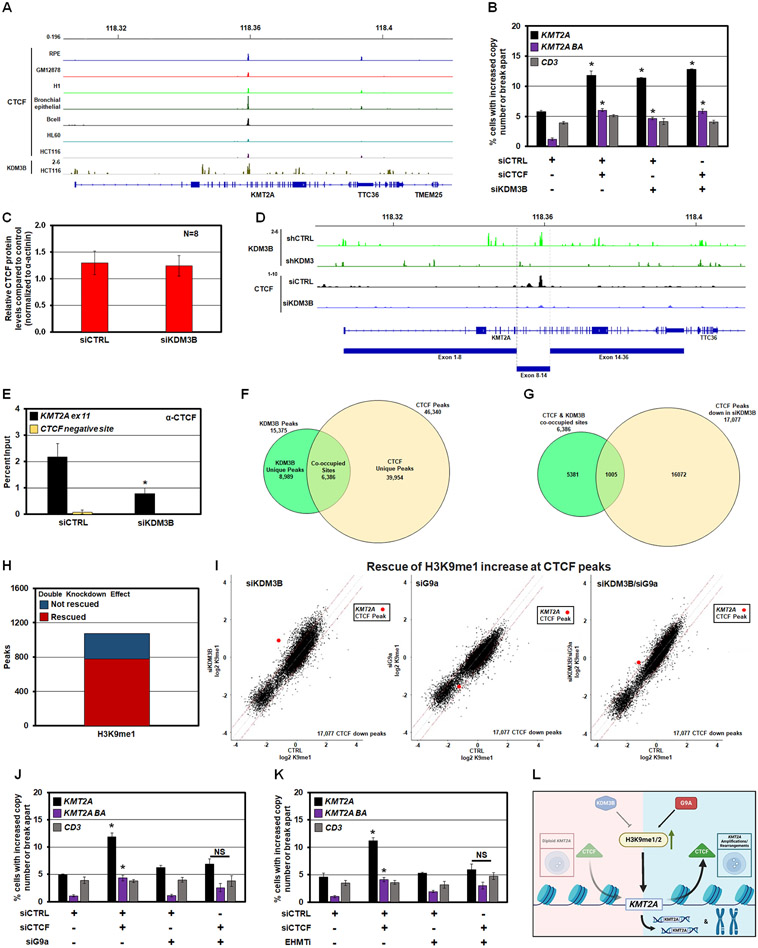
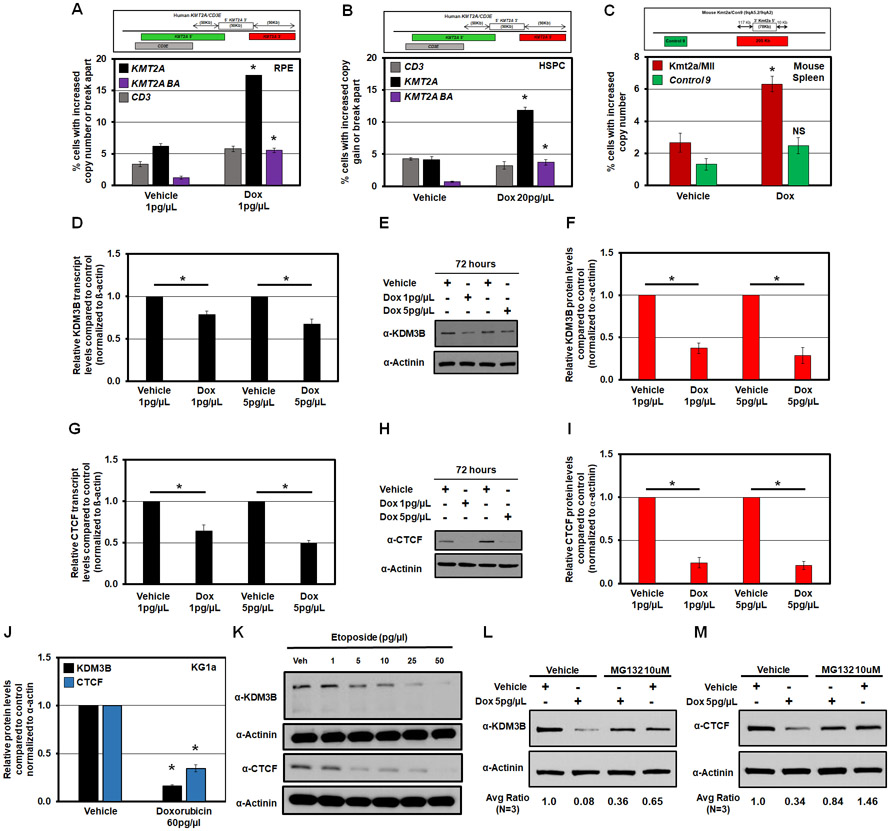
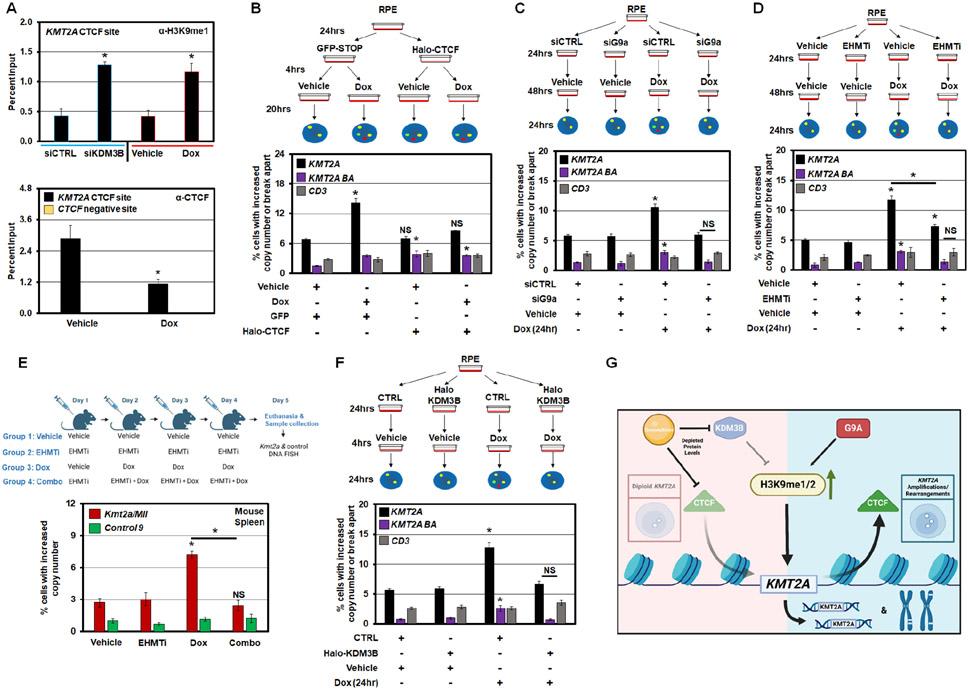
MLL/KMT2A amplifications and translocations are prevalent in infant, adult, and therapy-induced leukemia. However, the molecular contributor(s) to these alterations are unclear. Here, we demonstrate that histone H3 lysine 9 mono- and di-methylation (H3K9me1/2) balance at the MLL/KMT2A locus regulates these amplifications and rearrangements. This balance is controlled by the crosstalk between lysine demethylase KDM3B and methyltransferase G9a/EHMT2. KDM3B depletion increases H3K9me1/2 levels and reduces CTCF occupancy at the MLL/KMT2A locus, in turn promoting amplification and rearrangements. Depleting CTCF is also sufficient to generate these focal alterations. Furthermore, the chemotherapy doxorubicin (Dox), which associates with therapy-induced leukemia and promotes MLL/KMT2A amplifications and rearrangements, suppresses KDM3B and CTCF protein levels. KDM3B and CTCF overexpression rescues Dox-induced MLL/KMT2A alterations. G9a inhibition in human cells or mice also suppresses MLL/KMT2A events accompanying Dox treatment. Therefore, MLL/KMT2A amplifications and rearrangements are controlled by epigenetic regulators that are tractable drug targets, which has clinical implications.

Keywords: CTCF; DNA amplification; G9a; H3K9me; KDM3B; KMT2A; MLL; doxorubicin; ecDNA; rearrangements.


Conflict of interest statement

Declaration of interests J.R.W. has served or is serving as a consultant or advisor for Qsonica, Salarius Pharmaceuticals, Daiichi Sankyo, Inc., Vyne Therapeutics, and Lily Asia Ventures. J.R.W. also receives funding for research from Salarius Pharmaceuticals and Oryzon Genomics. O.G. is a scientific cofounder and shareholder of EpiCypher, Inc., K36 Therapeutics, Inc., and Alternative Bio, Inc. J.J. received research funds from Celgene Corporation, Levo Therapeutics, Inc., Cullgen, Inc., and Cullinan Oncology, Inc. J.J. is a cofounder and equity shareholder in Cullgen, Inc., a scientific cofounder and scientific advisory board member of Onsero Therapeutics, Inc., and a consultant for Cullgen, Inc., EpiCypher, Inc., and Accent Therapeutics, Inc. C.D. receives research funds from Janssen outside the submitted work.

Figures

Figure 1.
Figure 1.. KDM3B depletion induces KMT2A DNA copy gains and break aparts
(A) Analysis of TCGA LAML samples showing most LAML samples with KDM3B loss also have KMT2A copy gain with a p-value of 6.45e-07. Statistical significance was computed by Wilcoxon rank-sum test, which provides a non-parametric hypothesis test on two independent samples. (B) Representative DNA FISH with the 5qDel probe (5q probe covers KDM3B locus) demonstrating 5q LOH status (red) of KG1a (upper) and HL60 (lower) (left panels). Examples with KMT2A DNA FISH probe (panel C) demonstrate a baseline increase in KMT2A copies in KG1a (upper) and HL60 (lower) (right panels). Arrowheads highlight the FISH signal. (C) A schematic of DNA Fluorescent In Situ Hybridization (FISH) probe genomic locations that are used for KMT2A locus. (D) Representative siCTRL (upper) and siKDM3B (lower) DNA FISH images with the KMT2A-1 probe (orange probe in panel C and centromere 11 (11C; control probe)). (E) KDM3 family siRNA screen demonstrates that only KDM3B depletion generates KMT2A copy gains (KMT2A-1; orange) but not copy gains of centromere 11 (11C; grey). (F) Representative images with the clinical KMT2A DNA FISH break apart probe (red and green probes in panel C) that show no copy gain in siCTRL (top panel), DNA copy gains (middle 3 panels) and break apart events (bottom panel) upon KDM3B siRNA depletion. Arrowheads highlight the FISH signal. (G and H) DNA FISH showing KDM3B siRNA knockdown results in KMT2A copy gains (black) and break aparts (purple) but not CD3 (grey). (I) Representative images with the clinical KMT2A DNA FISH break apart probe (red and green probes in schematic C) that show KMT2A copy gains with siRNA-mediated KDM3B knockdown in U937 leukemia cells. Arrowheads highlight the FISH signal. (J and K) DNA FISH showing KDM3B siRNA knockdown results in KMT2A copy gains and break aparts but not CD3 alterations in U937 cells. (L) Input-normalized H3K9me1-3 ChIP-seq tracks of the region containing KMT2A. Publicly available ChIP-seq shows KDM3B binding within the BCR in HCT-116 cells which is lost upon shKDM3 treatment (green tracks) (49). (M) Bar graphs of ChIP-seq data in panel L demonstrating increased fold enrichments of H3K9me1/2 within the KMT2A locus. Error bars represent the SEM. *p < 0.05 by two-tailed Student’s t-test. Scale bar represents 5μm.
Figure 2.
Figure 2.. KDM3B chemical inhibition (KDM3i) promotes transient KMT2A copy gains and break aparts.
(A) Schematic (top) and quantification of DNA FISH (bottom) demonstrating that KMT2A amplification and break apart events occur with KDM3B inhibitor treatment but no change in copy number at the adjacent CD3 locus in RPE cells. (B-E) DNA FISH showing that KDM3B inhibition results in KMT2A copy gains and break aparts in KG1a, AML organoids, primary AML cells, and Hematopoietic Stem and Progenitor Cells with no change in copy number at the CD3 locus. (F) Schematic (top) and quantification of DNA FISH (bottom) showing that KDM3 inhibition (KDM3i) results in KMT2A copy gains and break aparts. Upon KDM3i washout (12hrs Washout), copy gains and break aparts no longer occur. No significant change occurred with the CD3 probe. Error bars represent the SEM. *p < 0.05 by two-tailed Student’s t-test.
Figure 3.
Figure 3.. KDM3B suppression leads to integration and inheritance of KMT2A copy gains and break aparts.
(A) A KDM3i treatment schematic and associated passaging of RPE cells. Cells were treated with 25nM of KDM3i. Cells were passaged in media without KDM3i every 3 days for sequential passages. (B) KMT2A and CD3 DNA FISH at passage 0 and passage 10 after KDM3i treatment, which demonstrates KMT2A copy gains and break aparts are inherited in RPE cells after 10 passages (P10). No significant change occurred with the CD3 probe. (C) Example metaphase spreads for KMT2A FISH for Vehicle and KDM3i treated cells at passage 10. Arrowheads highlight the FISH signal. (D) Quantification of the metaphase spreads with KMT2A FISH in KDM3i treated and passage 10 cells demonstrating increased copies of KMT2A are retained. (E) A KDM3B siRNA schematic and associated passaging of RPE cells (left). Western blots for KDM3B at cell passages used for DNA FISH demonstrates KDM3B protein levels return to baseline by passage 3 (P3; right). (F) KMT2A and CD3 FISH of KDM3B siRNA passaged cells demonstrates inheritance at passage 3, 5 and 15. No significant change occurred with the CD3 probe at any passage. (G) Example metaphase spreads for KMT2A FISH for siCTRL and siKDM3B cells at passage 3. Arrowheads highlight the FISH signal. (H) Quantification of the metaphase spreads with KMT2A FISH in cells treated with siCTRL and siKDM3B from two independently propagated siCTRL and siKDM3B cells at passages 3 and 9 demonstrating increased copies of KMT2A are retained. Error bars represent the SEM. *p < 0.05 by two-tailed Student’s t-test. Scale bar represents 5μm.
Figure 4.
Figure 4.. H3K9me1 balance controls KMT2A copy gains and break aparts.
(A) A schematic (upper) and DNA FISH (lower) for co-depletion of KDM3B with EHMT1 or EHMT2/G9a. siRNA depleted G9a but not EHMT1 prevents KMT2A copy gains and break aparts upon KDM3B siRNA depletion. No significant change occurred with the CD3 probe. (B) A schematic (upper) and DNA FISH (lower) for KDM3i and EHMTi treatment. EHMT1/2 chemical inhibition prevents KMT2A copy gains and break aparts upon KDM3i treatment. No significant change occurred with the CD3 probe. (C) A schematic (upper) and DNA FISH (lower) shows G9a overexpression promotes KMT2A copy gains and break aparts. Halo-EV- Halo empty vector. No significant change occurred with the 11C probe. (D) A schematic (upper) and DNA FISH (lower) for depletion of G9a in HL60 cells (KDM3B LOH cell line). G9a depletion modestly but significantly suppresses KMT2A copy gains in HL60 cells. No significant change occurred with the CD3 probe. (E) A schematic (upper) and DNA FISH (lower) for depletion of G9a in RPE-WT or RPE-inherited KMT2A cells. G9a depletion does not suppress KMT2A copy gains or break aparts in the RPE-inherited KMT2A cells. No significant change occurred with the CD3 probe. (F) Input-normalized H3K9me1/2/3 tracks at the KMT2A gene upon siKDM3B or siG9a alone or in combination in RPE cells. (G) Bar graphs representing H3K9 methylation ChIP-seq fold enrichment over input in three parts of KMT2A gene shown in (F). (H) A model depicting interplay between KDM3B-G9a regulating H3K9me1/2 and modulating KMT2A amplifications/rearrangements. Error bars represent the SEM. *p < 0.05 by two-tailed Student’s t-test. NS- not significant to control.
Figure 5.
Figure 5.. Reduced CTCF occupancy leads to KMT2A copy gains and break aparts.
(A) Publicly available ENCODE input-normalized ChIP-seq tracks densities of CTCF in multiple ENCODE cell lines or tissues at the KMT2A locus. CTCF binding at exon 11 of KMT2A is conserved in multiple cell lines and directly overlaps with KDM3B binding in HCT116 cells . (B) DNA FISH demonstrating single and co-siRNA depletion of KDM3B and CTCF promotes KMT2A copy gains and break aparts. No significant change occurred with the CD3 probe. (C) Quantification of western blots for CTCF in KDM3B siRNA depleted RPE cells. No significant change in steady state total CTCF protein levels were observed. (D) Publicly available input-normalized ChIP-seq tracks of KDM3B in control and shKDM3 cells. KDM3B binds at exon 11 and is lost upon shKDM3 (green tracks). Lower tracks: input-normalized ChIP-seq tracks of CTCF showing that siKDM3B reduced CTCF binding at exon 11 in RPE cells. (E) ChIP-qPCR demonstrating suppression of CTCF occupancy at KMT2A exon 11 (KMT2A ex 11; black) or a negative control for CTCF binding (CTCF negative site; yellow) following KDM3B siRNA depletion. (F) Venn diagram of the overlap between KDM3B ChIP-seq peaks from a public dataset and CTCF ChIP-seq peaks in this study. 6,386 of all KDM3B binding sites (41.5%) co-localize with a CTCF binding site (P-value=1.0e-07). (G) A total of 17,077 CTCF sites out of 46,340 (36.9%) had reduced occupancy with KDM3B depletion. Among all 6,386 KDM3B binding sites coinciding with CTCF binding, 1,005 sites show a significant decrease in CTCF binding upon KDM3B knockdown. Z-score=143.38 corresponding to a P-value close to 0. (H) Double KDM3B and G9a knockdown rescued the increase of H3K9me1 at the majority of CTCF peaks reduced by siKDM3B. Barplot showing genome-wide number of CTCF proximal regions (+/− 5Kb from a CTCF peak) that decreased CTCF and increased H3K9me1 level upon KDM3B knockdown (points above upper red line in I, left scatterplot). Red, the fraction of regions where this increase was rescued by double knockdown (points moved below upper red line in I, right scatterplot). (I) Genome-wide effects of siKDM3B, siG9a, and double knockdown on H3K9me1 levels at the subset of CTCF binding sites where CTCF binding was decreased by siKDM3B (17,077 sites). KDM3B and G9a knockdowns have opposite skews, whereas the double knockdown strongly reduces these H3K9me1 changes. Left, scatterplot comparing input-normalized H3K9me1 ChIP-seq densities in +/− 5Kb proximity of all these individual CTCF peaks across the genome in control vs siKDM3B; H3K9me1 changes are skewed towards increase (points above upper red line corresponding to > 1.5 fold increase in siKM3B cells). Middle, scatterplot for control vs siG9a cells; H3K9me1 changes are skewed towards decrease (points below lower red line corresponding to > 1.5 fold decrease in siG9a cells). Right, scatterplot for control vs siKDM3B + siG9a cells, with much fewer H3K9me1 changes in either direction. Red point, +/−5-Kb vicinity of CTCF binding site within KMT2A gene. (J) DNA FISH demonstrating siRNA depletion of G9a prevents KMT2A copy gains and break aparts upon CTCF siRNA depletion. No significant change occurred with the CD3 probe. (K) DNA FISH demonstrating EHMT1/2 chemical inhibition prevents KMT2A copy gains and break aparts upon CTCF siRNA depletion. No significant change occurred with the CD3 probe. (L) A model depicting interplay between KDM3B-G9a-CTCF upon H3K9me1/2 modulation. Error bars represent the SEM. *p < 0.05 by two-tailed Student’s t-test.
Figure 6.
Figure 6.. Doxorubicin promotes KMT2A amplification and rearrangement as well as reduces KDM3B and CTCF protein levels
(A and B) Schematic of human KMT2A and adjacent CD3 DNA FISH probes (top). Graph of the DNA FISH for RPE and HSPCs treated with Dox for 72hrs (bottom). Dox treatment causes significant copy gains and break aparts at the KMT2A locus; while the control region (CD3) changes were not significant. (C) A schematic of DNA FISH probe genomic locations used for mouse Kmt2a/Con9 locus (top). Graph of DNA FISH quantification demonstrating that cells isolated from the Spleen of mice treated with Dox have increased copy gains of Kmt2a but not the adjacent Control 9 region (bottom). (D) RT-qPCR demonstrating that Dox significantly reduced KDM3B transcript levels after 72 hours of exposure in RPE cells. (E) Representative western blot illustrating Dox reducing KDM3B protein levels after 72 hours of exposure in RPE cells. (F) Quantification of western blots (n=4) showing a significant reduction in KDM3B protein levels following Dox treatment after 72 hours of exposure in RPE cells. (G) RT-qPCR demonstrating that Dox significantly reduced CTCF transcript levels after 72 hours of exposure in RPE cells. (H) Representative western blot illustrating Dox reducing CTCF protein levels after 72 hours of exposure in RPE cells. (I) Quantification of western blots (n=4) showing a significant reduction in CTCF protein levels following Dox treatment after 72 hours of exposure in RPE cells. (J) Graph of the quantification of western blots in Figure S6F showing a significant reduction in KDM3B (black) and CTCF (blue) protein levels following Dox treatment in KG1a cells. (K) Western blot illustrating etoposide dose-dependently reduces KDM3B (upper) and CTCF (lower) protein levels after 72 hours of exposure in RPE cells. (L and M) Western blot illustrating MG132 partially rescues KDM3B and CTCF protein levels in the presence of Dox treatment in RPE cells. Average quantification of 3 experiments in Figure S6G are below. Protein levels were quantified using ImageJ and normalized to α-Actinin. Error bars represent the SEM. *p < 0.05 by two-tailed Student’s t-test.
Figure 7.
Figure 7.. KDM3B and CTCF regulation controls Doxorubicin-induced KMT2A amplification and rearrangement.
(A) ChIP-qPCR demonstrating increase of H3K9me1 at KMT2A exon 11 (KMT2A CTCF site) following KDM3B siRNA depletion (left; upper) and Dox treatment at 1pg/μL for 24hr (right; upper). ChIP-qPCR demonstrating suppression of CTCF occupancy at KMT2A exon 11 (KMT2A ex 11; black) or a negative control for CTCF binding (CTCF negative site; yellow) following Dox treatment at 1pg/μL for 24hr (lower). (B) Treatment schematic (upper) and DNA FISH (lower) demonstrating that Dox treatment causes KMT2A amplification and rearrangements. CTCF overexpression significantly rescues KMT2A amplifications. (C) Treatment schematic (upper) and DNA FISH (lower) demonstrating that Dox treatment causes KMT2A amplification and rearrangement. G9a depletion significantly rescues KMT2A amplifications and rearrangements. (D) Treatment schematic (upper) and DNA FISH (lower) demonstrating that Dox treatment causes KMT2A amplification and rearrangements that are significantly rescued with EHMT1/2 inhibition (EHMTi). (E) Treatment schematic (upper) and DNA FISH (lower) demonstrating that Dox treatment causes Kmt2a copy gains in mouse cells isolated from the spleen, however, pretreatment with EHMT1/2 inhibitor (EHMTi) blocked the Dox-induced Kmt2a copy gains. The control region on chr 9 had no significant changes with any condition (Control 9). (F) Treatment schematic (upper) and DNA FISH (lower) demonstrating that Dox treatment causes KMT2A amplification and rearrangements that are significantly rescued with KDM3B overexpression. (G) Model summarizing the data from Figures 1-7. The model illustrates that KDM3B and CTCF are suppressed with Dox treatment, leading to increased H3K9 mono- and di-methylation and reducing CTCF occupancy, which in turn promotes KMT2A amplification and rearrangements (BA). G9a is critical in promoting the KMT2A copy gains and rearrangements. Error bars represent the SEM. *p < 0.05 by two-tailed Student’s t-test.

References

    1. Hanahan D. (2022). Hallmarks of Cancer: New Dimensions. Cancer Discov 12, 31–46. 10.1158/2159-8290.Cd-21-1059. - DOI - PubMed
    1. Hanahan D, and Weinberg RA (2011). Hallmarks of cancer: the next generation. Cell 144, 646–674. 10.1016/j.cell.2011.02.013. - DOI - PubMed
    1. Mishra S, and Whetstine JR (2016). Different Facets of Copy Number Changes: Permanent, Transient, and Adaptive. Mol Cell Biol. 10.1128/MCB.00652-15. - DOI - PMC - PubMed
    1. Bailey C, Shoura MJ, Mischel PS, and Swanton C (2020). Extrachromosomal DNA-relieving heredity constraints, accelerating tumour evolution. Ann Oncol 31, 884–893. 10.1016/j.annonc.2020.03.303. - DOI - PubMed
    1. Song K, Minami JK, Huang A, Dehkordi SR, Lomeli SH, Luebeck J, Goodman MH, Moriceau G, Krijgsman O, Dharanipragada P, et al. (2022). Plasticity of Extrachromosomal and Intrachromosomal BRAF Amplifications in Overcoming Targeted Therapy Dosage Challenges. Cancer Discov 12, 1046–1069. 10.1158/2159-8290.CD-20-0936. - DOI - PMC - PubMed

Publication types

LinkOut - more resources