. 2023 Oct 3;14(1):6157.
doi: 10.1038/s41467-023-41924-0.

Structural insights into the conformational changes of BTR1/SLC4A11 in complex with PIP2

Affiliations

Structural insights into the conformational changes of BTR1/SLC4A11 in complex with PIP2

Yishuo Lu et al. Nat Commun. .

Abstract

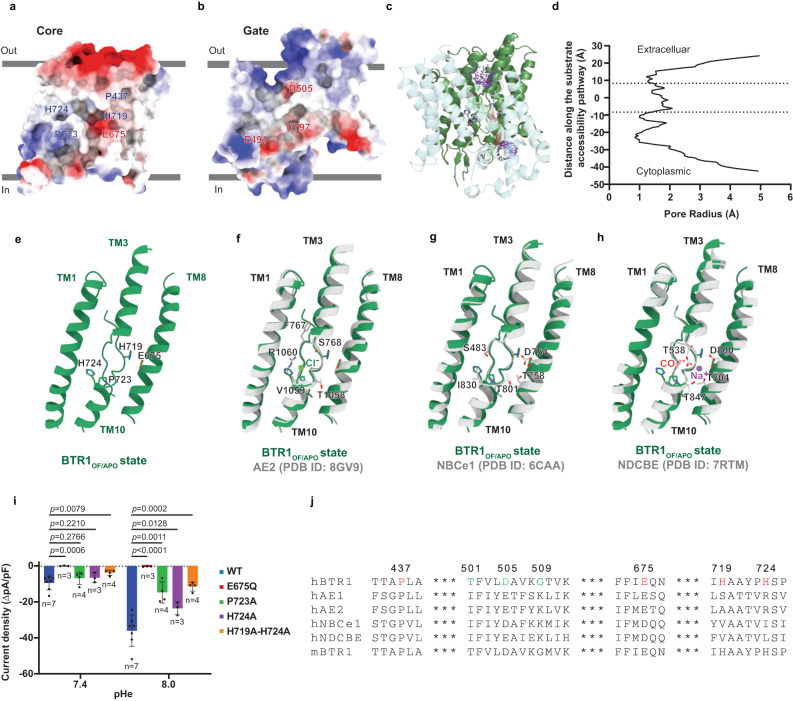
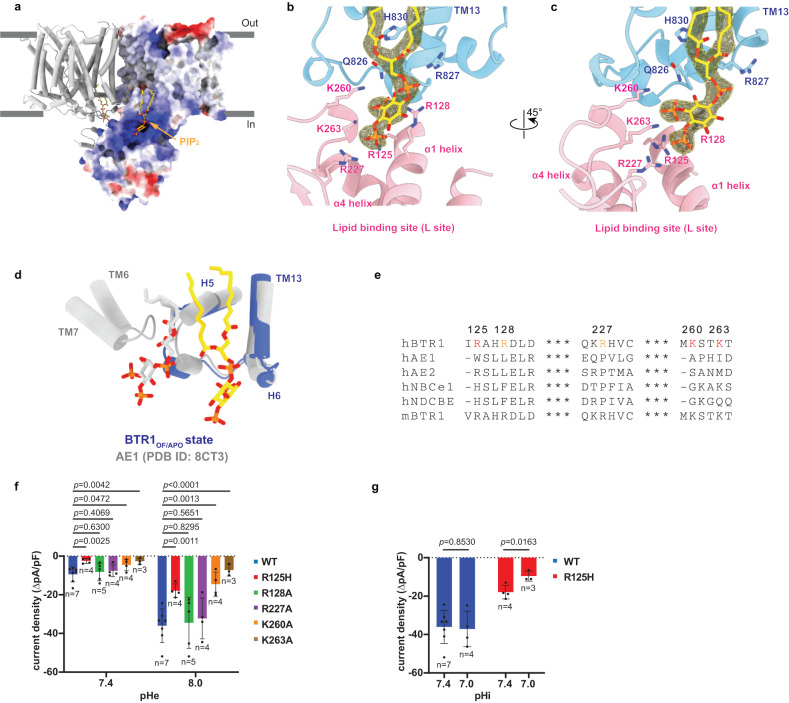
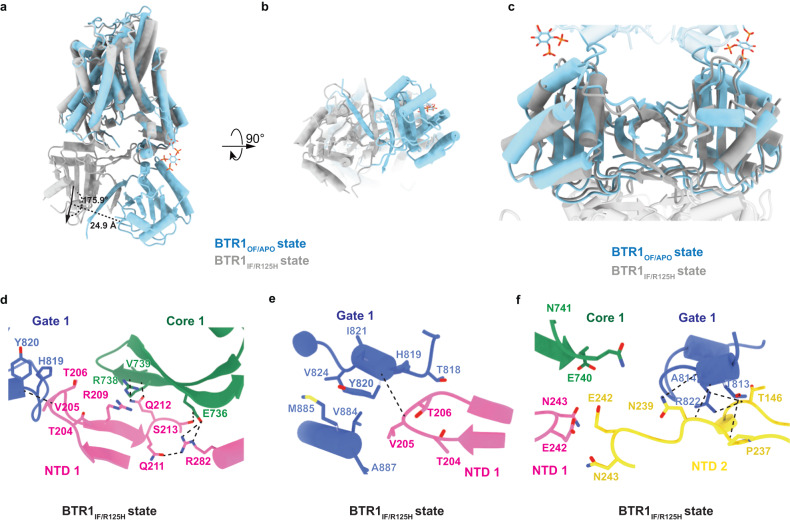
BTR1 (SLC4A11) is a NH3 stimulated H+ (OH-) transporter belonging to the SLC4 family. Dysfunction of BTR1 leads to diseases such as congenital hereditary endothelial dystrophy (CHED) and Fuchs endothelial corneal dystrophy (FECD). However, the mechanistic basis of BTR1 activation by alkaline pH, transport activity regulation and pathogenic mutations remains elusive. Here, we present cryo-EM structures of human BTR1 in the outward-facing state in complex with its activating ligands PIP2 and the inward-facing state with the pathogenic R125H mutation. We reveal that PIP2 binds at the interface between the transmembrane domain and the N-terminal cytosolic domain of BTR1. Disruption of either the PIP2 binding site or protonation of PIP2 phosphate groups by acidic pH can transform BTR1 into an inward-facing conformation. Our results provide insights into the mechanisms of how the transport activity and conformation changes of BTR1 are regulated by PIP2 binding and interaction of TMD and NTD.


Conflict of interest statement

The authors declare no competing interests.

Figures

Fig. 1
Fig. 1. Cryo-EM structure of BTR1 in the outward-facing state.
a IV curve of cells expressing wild-type BTR1 at pH 7.4 in the presence and absence of 5 mM NH4Cl. The current values are standardized by cell capacitance. Data shown are mean values ± s.d. of n = 4 biologically independent experiments. b Topology and domain arrangement of a BTR1 monomer. The gate domain, core domain and N-terminal cytoplasmic domain (NTD) are shown in blue, green and pink, respectively. Gray bars represent the boundaries of the cell membrane. c, d Cryo-EM maps of the outward-facing state of a BTR1 dimer bound to PIP2: views from the side (c) and the bottom (d). The two monomers of BTR1 are colored in blue and green, and the PIP2 molecules are colored in gold. The remaining lipid molecules are shown as transparent gray. e, f Structural model of the outward-facing state BTR1 views from the side (e) and the bottom (f). The two PIP2 molecules are shown in stick representations. The color scheme of one BTR1 monomer is the same as in (b), and the other monomer is colored in gray.
Fig. 2
Fig. 2. Substrates binding sites of BTR1.
a, b Electrostatic surface representation of the core domain (a) and gate domain (b) of BTR1 in the outward-facing state. Functionally important amino acids are shown in blue or red according to their charge. c, d Ion permeation pathway of BTR1 in the outward-facing state conformation (c) and the pore radius values along the pathway (d). The dotted lines represent the extracellular and intracellular borders of the substrate binding site. The gate domain and core domain are colored in blue and green, respectively. The analyses were performed using HOLE2. e Substrate binding pocket of BTR1OF/APO. The residues participating in the substrates coordination of BTR1 are labeled. fh Alignment of the substrate binding pocket of BTR1OF/APO with AE2 (PDB ID: 8GV9) (f), NBCe1 (PDB ID: 6CAA) (g) and NDCBE (PDB ID: 7RTM) (h). The residues participating in the substrates coordination of AE2, NBCe1 and NDCBE are labeled. The Cl- ion was shown as green sphere in (f). The CO32- ion and Na+ ion were shown as stick model and purple sphere in (h), respectively. i Functional analysis of the residues involved in the substrate binding pocket formation. The current density values were calculated by the extreme difference of the current values after addition of 5 mM NH4Cl at extracellular pH (pHe) 7.4 and 8.0. The current values are standardized by cell capacitance. Data shown are mean values ± s.d. of n biologically independent experiments and p-values were calculated by two-sided unpaired t-tests. j Sequence alignment of the residues in the pore region from Homo sapiens BTR1, Homo sapiens AE1, Homo sapiens AE2, Homo sapiens NBCe1, Homo sapiens NDCBE and Mus musculus BTR1 by PROMALS3D. Amino acids which are important for substrates coordination and permeation pathway formation are colored in red and green respectively.
Fig. 3
Fig. 3. PIP2 binding site of BTR1 in the outward-facing state.
a BTR1OF/APO dimer with one monomer shown as electrostatic surface representation. PIP2 molecules are shown as gold sticks. b, c Close-up views of the PIP2 binding site. The PIP2 density is shown in mesh. The PIP2 molecule and its surrounding residues are shown in stick representation. TMD, NTD and PIP2 are colored in blue, pink and gold, respectively. d Structural comparison of the PIP2 binding sites of BTR1OF/APO (blue, with PIP2 colored in gold) and AE1 (gray, with PIP2 colored in gray) (PDB ID: 8CT3) aligned by the gate domains. Helices of BTR1 and AE1 are labeled in blue and gray, respectively. e Sequence alignment of the NTD residues forming the PIP2 binding site from Homo sapiens BTR1, Homo sapiens AE1, Homo sapiens AE2, Homo sapiens NBCe1, Homo sapiens NDCBE and Mus musculus BTR1. Residues that are important for PIP2 coordination and involved in forming the PIP2 binding pocket (L site) are colored in red and orange, respectively. f Functional analysis of the residues in the PIP2 binding site. The current density values of wild-type and mutant BTR1 proteins after the addition of 5 mM NH4Cl at pHe 7.4 and 8.0 as measured by whole-cell patch-clamp. Data shown are mean values ± s.d. of n biologically independent experiments and p-values were calculated by two-sided unpaired t-tests. g The current density values of wild-type BTR1 and BTR1-R125H proteins at different intracellular pH (pHi 7.0 and 7.4), measured by whole-cell patch-clamp. Data shown are mean values ± s.d. of n biologically independent experiments and p-values were calculated by two-sided unpaired t-tests.
Fig. 4
Fig. 4. TMDs of BTR1 in the inward-facing conformation.
a, b Cryo-EM map and structural model of the BTR1 dimer in the inward-facing state as viewed from the side. The color schemes are the same as in Fig. 1 (ce). c, d Ion permeation pathway of BTR1 in the inward-facing state conformation (c) and the pore radius values along the pathway (d). e, f Structural alignment of TMDs of BTR1IF/R125H and BTR1OF/APO as viewed from the side (e) and the bottom (f). The shift directions of the transmembrane helices when transitioning from the outward-facing state to the inward-facing state are shown as red arrows. The alignment RMSDs of the gate domains and core domains are labeled below. g Structural alignment of the gate domains of BTR1IF/R125H and BTR1OF/APO. The helices with marked displacement are labeled in black. The shift direction of helices are shown as red arrows. h The centroid shift of the pore region during the state transition process. The centroids of residues P437 and P723 of BTR1IF/R125H and BTR1OF/APO are shown as green and gray spheres, respectively. The centroid shift is shown as red dotted arrow. The shift direction of helices are shown as red arrows.
Fig. 5
Fig. 5. NTDs of BTR1 in the inward-facing conformation.
a, b Structural comparison of BTR1OF/APO (blue) and BTR1IF/R125H (gray) monomers aligned by their TMDs viewed from the side (a) and the bottom (b). The rotation angle and centroid shift between BTR1OF/APO and BTR1IF/R125H are marked with dotted lines. c Structural comparison of BTR1OF/APO (blue) and BTR1IF/R125H (gray) aligned by their NTDs. The TMDs are both shown in transparent mode. d Hydrophobic interactions and hydrogen bonds formed between the NTD and TMD of one BTR1IF/R125H monomer. The NTD, gate domain and core domain of one BTR1IF/R125H monomer are colored in pink, blue and green, respectively. The interactions are shown as dotted lines. e Close-up view of the hydrophobic interactions between the NTD and gate domain of one BTR1IF/R125H monomer. The hydrophobic interaction between V205 and Y820 is shown as dotted lines. f Hydrogen bonds between the gate domain of one BTR1IF/R125H monomer and the NTD of the other monomer. The interactions are shown as dotted lines.
Fig. 6
Fig. 6. BTR1 state transition process.
a BTR1 is in the outward-facing state with PIP2 stably binding. b Dissociation of PIP2 molecules from the NTDs of BTR1 after ions reach the substrate binding sites induces the rotation of the core domains, leading to the occluded state of BTR1. c Disruption of the interaction between PIP2 and BTR1 due to acidic pathological condition or pathogenic mutation in the L site, triggers the flip of the NTD and the conformational change into the inward-facing state.

Similar articles

Cited by

References

    1. Thornell IM, Bevensee MO. Regulators of Slc4 bicarbonate transporter activity. Front. Physiol. 2015;6:166. doi: 10.3389/fphys.2015.00166. - DOI - PMC - PubMed
    1. Parker MD, Ourmozdi EP, Tanner MJ. Human BTR1, a new bicarbonate transporter superfamily member and human AE4 from kidney. Biochem Biophys. Res Commun. 2001;282:1103–1109. doi: 10.1006/bbrc.2001.4692. - DOI - PubMed
    1. Park M, Li Q, Shcheynikov N, Zeng W, Muallem S. NaBC1 is a ubiquitous electrogenic Na+ -coupled borate transporter essential for cellular boron homeostasis and cell growth and proliferation. Mol. Cell. 2004;16:331–341. doi: 10.1016/j.molcel.2004.09.030. - DOI - PubMed
    1. Zhang W, Ogando DG, Bonanno JA, Obukhov AG. Human SLC4A11 is a novel NH3/H+ Co-transporter. J. Biol. Chem. 2015;290:16894–16905. doi: 10.1074/jbc.M114.627455. - DOI - PMC - PubMed
    1. Kao L, et al. SLC4A11 function: evidence for H(+)(OH(-)) and NH3-H(+) transport. Am. J. Physiol. Cell Physiol. 2020;318:C392–C405. doi: 10.1152/ajpcell.00425.2019. - DOI - PMC - PubMed

Publication types

LinkOut - more resources