. 2023 Oct 3;14(1):5957.
doi: 10.1038/s41467-023-41269-8.

Sugar-sweetened beverage intakes among adults between 1990 and 2018 in 185 countries

Collaborators, Affiliations

Sugar-sweetened beverage intakes among adults between 1990 and 2018 in 185 countries

Laura Lara-Castor et al. Nat Commun. .

Abstract

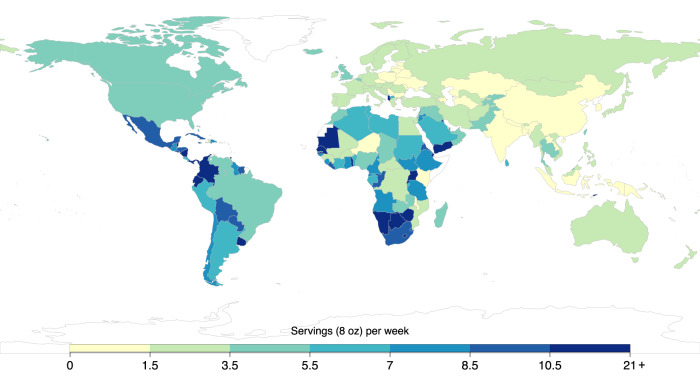
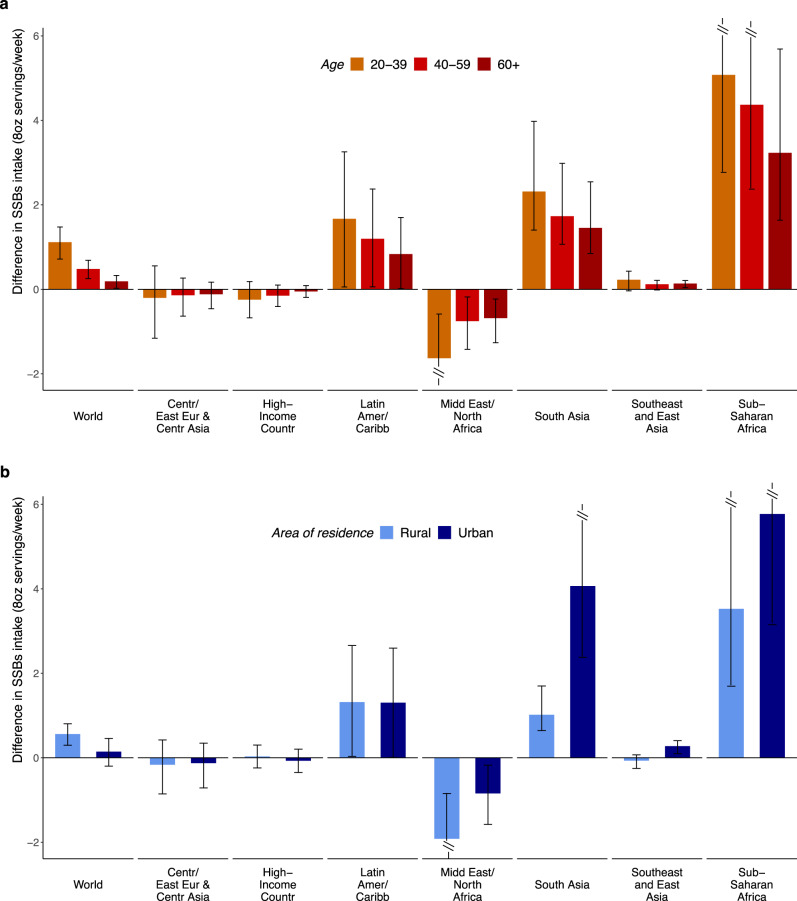
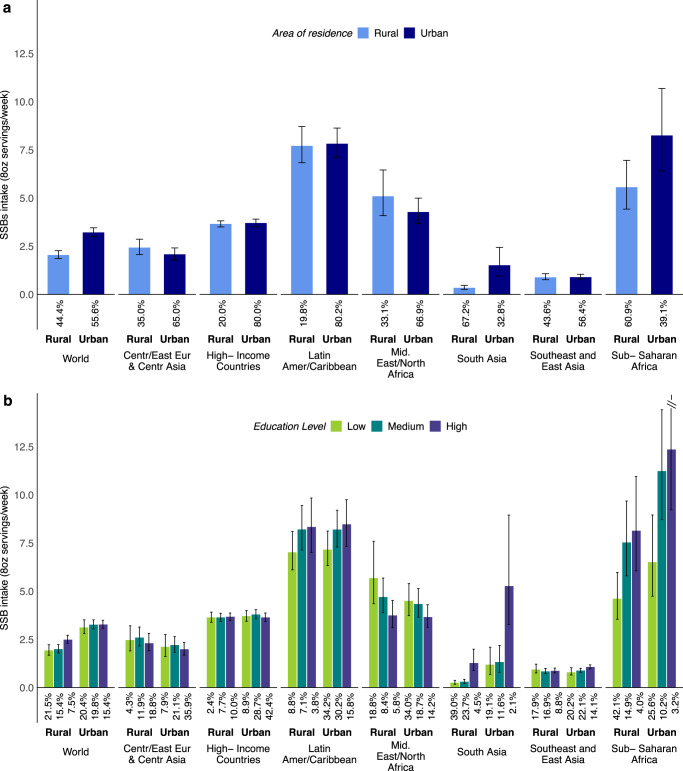
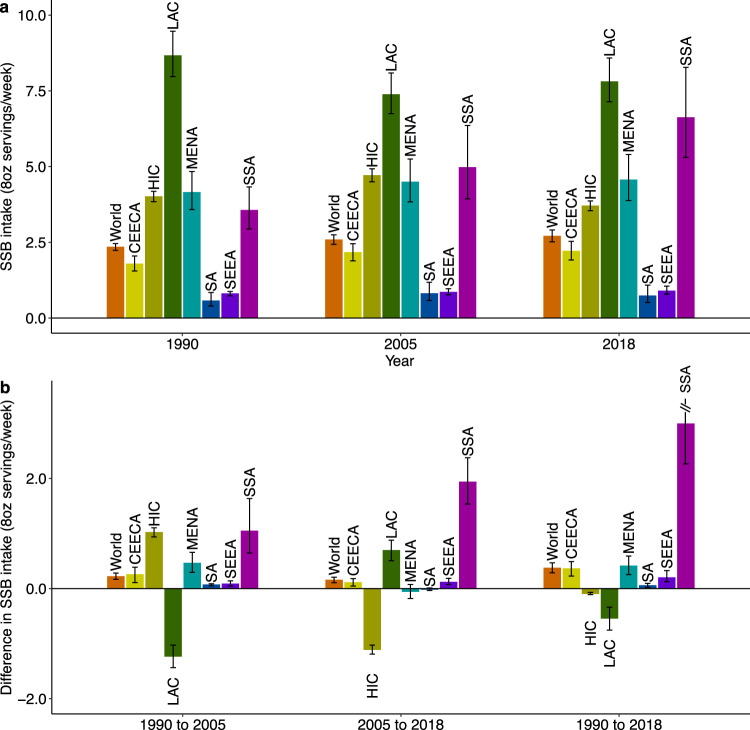
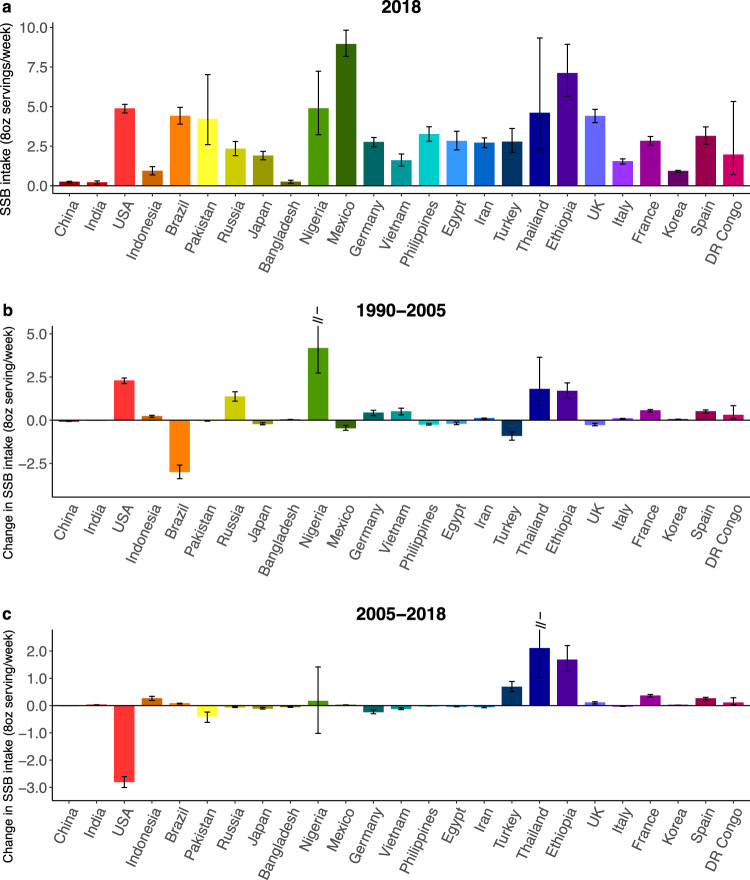
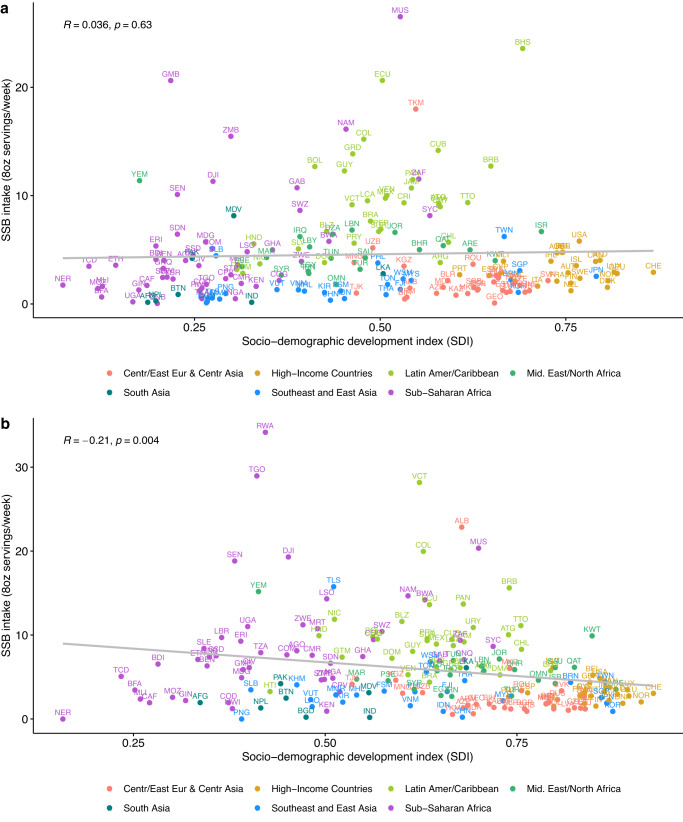
Sugar-sweetened beverages (SSBs) are associated with cardiometabolic diseases and social inequities. For most nations, recent estimates and trends of intake are not available; nor variation by education or urbanicity. We investigated SSB intakes among adults between 1990 and 2018 in 185 countries, stratified subnationally by age, sex, education, and rural/urban residence, using data from the Global Dietary Database. In 2018, mean global SSB intake was 2.7 (8 oz = 248 grams) servings/week (95% UI 2.5-2.9) (range: 0.7 (0.5-1.1) in South Asia to 7.8 (7.1-8.6) in Latin America/Caribbean). Intakes were higher in male vs. female, younger vs. older, more vs. less educated, and urban vs. rural adults. Variations by education and urbanicity were largest in Sub-Saharan Africa. Between 1990 and 2018, SSB intakes increased by +0.37 (+0.29, +0.47), with the largest increase in Sub-Saharan Africa. These findings inform intervention, surveillance, and policy actions worldwide, highlighting the growing problem of SSBs for public health in Sub-Saharan Africa.


Conflict of interest statement

The investigators did not receive funding from a pharmaceutical company or other agency to write this report. L.L.C reports research funding from the Gates Foundation, the American Heart Association, and Consejo Nacional de Ciencia y Tecnología in Mexico, outside of the submitted work. R.M. reports research funding from the Gates Foundation; and (ended) the U.S. National Institutes of Health, Danone, and Nestle. She also reports consulting from Development Initiatives and as IEG chair for the Global Nutrition Report, outside of the submitted work. F.C., J.Z., and P.S. report research funding from the Gates Foundation, as well as the National Institutes of Health, outside of the submitted work. V.M. reports research funding from the Canadian Institutes of Health Research and from the American Heart Association, outside the submitted work. J.R.S. reports research funding from the Gates Foundation, as well as the National Institutes of Health, Nestlé, Rockefeller Foundation, and Kaiser Permanent Fund at East Bay Community Foundation, outside of the submitted work. S.B.C. reports research funding from the U.S. National Institutes of Health, the U.S. Department of Agriculture, the Rockefeller Foundation, the U.S. Agency for International Development, and the Kaiser Permanente Fund at East Bay Community Foundation, outside the submitted work. D.M. reports research funding from the U.S. National Institutes of Health, the Gates Foundation, the Rockefeller Foundation, Vail Innovative Global Research, and the Kaiser Permanente Fund at East Bay Community Foundation; personal fees from Acasti Pharma, Barilla, Danone and Motif FoodWorks; is on the scientific advisory board for Beren Therapeutics, Brightseed, Calibrate, Elysium Health, Filtricine, HumanCo, Instacart, January Inc., Perfect Day, Tiny Organics, and (ended) Day Two, Discern Dx, and Season Health; has stock ownership in Calibrate and HumanCo; and receives chapter royalties from UpToDate, all outside the submitted work. J.E.M. declares no competing interests.

Figures

Fig. 1
Fig. 1. National mean sugar-sweetened beverage intakes (8 oz servings/week) in adults (20+ years) across 185 countries in 2018.
SSBs were defined as any beverage with added sugars and ≥50 kcal per 8 oz serving, including commercial or homemade beverages, soft drinks, energy drinks, fruit drinks, punch, lemonade, and aguas frescas. This definition excludes 100% fruit and vegetable juices, non-caloric artificially sweetened drinks, and sweetened milk. The standardized serving size used for this analysis is 8 oz serving (248 grams). For this visual representation, values were truncated at 21 servings/week to better reflect the distribution of intakes globally. The analysis of the data was done using the rworldmap package (v1.3-6). Source data are provided as Source Data file 1. Oz ounces, SSBs sugar-sweetened beverages.
Fig. 2
Fig. 2. Global and regional sugar-sweetened beverage intakes (8 oz serving/week) by age in adults (20+ years) in 2018.
SSBs were defined as any beverage with added sugars and ≥50 kcal per 8 oz serving, including commercial or homemade beverages, soft drinks, energy drinks, fruit drinks, punch, lemonade, and aguas frescas. This definition excludes 100% fruit and vegetable juices, non-caloric artificially sweetened drinks, and sweetened milk. The standardized serving size used for this analysis is 8 oz serving (248 grams). The filled circles represent the mean SSBs intake (8 oz serving/week) and the error bars of the 95% UIs. Age groups are 20–24, 25–29, 30–34, 35–39, 40–44, 45–49, 50–54, 55–59, 60–64, 65–69, 70–74, 75–79, 80–84, 85+ years. In prior GDD reports, the region Central/Eastern Europe and Central Asia was referred as Former Soviet Union, and Southeast and East Asia was referred to as Asia. Source data are provided as Source Data file 2. Centr/East Eur & Centr Asia, Central/Eastern Europe and Central Asia, GDD Global Dietary Database, Latin Amer/Caribbean Latin America/Caribbean, oz ounces, SSBs sugar-sweetened beverages, UIs uncertainty intervals.
Fig. 3
Fig. 3. Difference in sugar-sweetened beverage intakes (8 oz serving/week) between high vs. low educated adults (20+ years) by age and by area of residence.
a Difference SSB intakes in high vs. low educated adults by age. b difference in SSB intakes in high vs. low educated adults by area of residence. SSBs were defined as any beverage with added sugars and ≥50 kcal per 8 oz serving, including commercial or homemade beverages, soft drinks, energy drinks, fruit drinks, punch, lemonade, and aguas frescas. This definition excludes 100% fruit and vegetable juices, non-caloric artificially sweetened drinks, and sweetened milk. The standardized serving size used for this analysis is 8 oz serving (248 grams). The filled bars represent the mean difference in SSBs intake (8 oz serving/week) and the error bars the 95% UIs. Values were truncated at −2.0 and 5.8 (8 oz) servings/week to better represent the distribution of intakes. Upper and lower 95% UIs above or below those values are displayed with a dashed line. Colors represent the age category as “20–30 years” (orange), “40–59 years” (red), or “60+ years” (dark red); and the area of residence as “rural” (light blue) or “urban” (dark blue). In prior GDD reports, the region Central/Eastern Europe and Central Asia was referred to as Former Soviet Union, and Southeast and East Asia was referred to as Asia. Source data are provided as Source Data file 3. Centr/East Eur & Centr Asia Central/Eastern Europe and Central Asia, GDD Global Dietary Database, Latin Amer/Caribbean Latin America/Caribbean, oz ounces, SSBs sugar-sweetened beverages, UIs uncertainty intervals.
Fig. 4
Fig. 4. Difference in sugar-sweetened beverage intakes (8 oz serving/week) between adults from urban vs. rural areas by age and by education level in 2018.
a Difference in SSB intakes in adults from urban vs. rural areas by age. b difference SSB intakes in adults from urban vs. rural areas by education. SSBs were defined as any beverage with added sugars and ≥50 kcal per 8 oz serving, including commercial or homemade beverages, soft drinks, energy drinks, fruit drinks, punch, lemonade, and aguas frescas. This definition excludes 100% fruit and vegetable juices, non-caloric artificially sweetened drinks, and sweetened milk. The standardized serving size used for this analysis is 8 oz serving (248 grams). The filled bars represent the mean difference in SSBs intake (8 oz serving/week) and the error bars the 95% UIs. Values were truncated at −2.0 and 5.8 (8 oz) servings/week to better represent the distribution of intakes. Upper and lower 95% UIs above or below those values are displayed with a dashed line. Colors represent the age category as “20–30 years” (orange), “40–59 years” (red), or “60+ years” (dark red); and education level as “low” 0–6 years of education (light green), “medium” >6 years to 12 years of education (dark green), or “high” >12 years of education (purple). In prior GDD reports, the region Central/Eastern Europe and Central Asia was referred to as Former Soviet Union, and Southeast and East Asia was referred to as Asia. Source data are provided as Source Data file 4. Centr/East Eur & Centr Asia, Central/Eastern Europe and Central Asia; GDD Global Dietary Database; Latin Amer/Caribbean, Latin America/Caribbean, oz ounces, SSBs sugar-sweetened beverages, UIs uncertainty intervals.
Fig. 5
Fig. 5. Global and regional sugar-sweetened beverage intakes (8 oz servings/week) in adults (+20 years) by area of residence and education level in 2018.
a SSB intakes in adults by area of residence. b SSB intakes in adults by area of residence and education level. SSBs were defined as any beverage with added sugars having ≥50 kcal per 8 oz serving, including commercial or homemade beverages, soft drinks, energy drinks, fruit drinks, punch, lemonade, and aguas frescas. This definition excludes 100% fruit and vegetable juices, non-caloric artificially sweetened drinks, and sweetened milk. The standardized serving size used for this analysis is 8 oz serving (248 grams). The filled bars represent the mean SSBs intake (8 oz servings/week) and the error bars the 95% UIs. Values were truncated at 14.5 (8 oz) servings/week to better reflect the distribution of intakes. Upper 95% UIs above that value are shown with a dashed line. The values below the bars correspond to the percentage (%) of the global population represented in that strata. Colors represent the education level as “low” 0 to 6 years of education (light green), “medium” >6 years to 12 years of education (dark green), or “high” >12 years of education (purple); and area of residence as “rural” (light blue) or “urban” (dark blue). In prior GDD reports, the region Central or Eastern Europe and Central Asia was referred to as Former Soviet Union, and Southeast and East Asia was referred as Asia. Source data are provided as Source Data file 2. GDD Global Dietary Database, oz ounces, SSBs sugar-sweetened beverages, UIs uncertainty intervals.
Fig. 6
Fig. 6. Mean SSB intakes (8 oz servings/week) by world region in 1990, 2005, and 2018 and absolute changes from 1990–2005, 2005–2018, and 1990–2018 in adults (20+ years).
a Mean SSB intakes by world region in 1990, 2005, and 2018. b absolute changes in SSB intakes from 1990–2005, 2005–2018, and 1990–2018. SSBs were defined as any beverage with added sugars and ≥50 kcal per 8 oz serving, including commercial or homemade beverages, soft drinks, energy drinks, fruit drinks, punch, lemonade, and aguas frescas. This definition excludes 100% fruit and vegetable juices, non-caloric artificially sweetened drinks, and sweetened milkks. The standardized serving size used for this analysis is 8 oz serving (248 grams). The filled bars represent the mean intake (a) and the absolute change in the mean intake (b), and the error bars represent the 95% UIs. Values in (b) were truncated at 3.5 (8 oz) servings per week to better reflect the distribution of change in intakes. Upper 95% UIs above that value are shown with a dashed line. In prior GDD reports, the region Central/Eastern Europe and Central Asia was called the Former Soviet Union, and Southeast and East Asia was called Asia. Source data are provided as Source Data files 2 and 6. GDD Global Dietary Database, oz ounces, SSBs sugar-sweetened beverages, UIs uncertainty intervals, World regions CEECA, Central/Eastern Europe and Central Asia, HIC High-Income Countries, LAC Latin America/Caribbean, MENA Middle East/North Africa, SA South Asia, SEEA Southeast and East Asia, SSA Sub-Saharan Africa.
Fig. 7
Fig. 7. Mean sugar-sweetened beverage intakes (8 oz servings/week) in adults (20+ years) in the 25 most populous countries in 2018, and absolute change from 1990 to 2005 and 2005 to 2018.
a Mean SSB intakes in the 25 most populous countries in 2018. b absolute change in SSB intakes from 1990 to 2005. c absolute change in SSB intakes from 2005 to 2018. SSBs were defined as any beverage with added sugars and ≥50 kcal per 8 oz serving, including commercial or homemade beverages, soft drinks, energy drinks, fruit drinks, punch, lemonade, and aguas frescas. This definition excludes 100% fruit and vegetable juices, non-caloric artificially sweetened drinks, and sweetened milk. The standardized serving size used for this analysis is 8 oz serving (248 grams). The filled bars represent the mean SSB intakes (8 oz serving/week) and the error bars the 95% UIs. Values were truncated at 5.0 (8 oz) servings/week for b and at 2.5 (8 oz) servings/week for c. Upper 95% UIs above those values are shown with a dashed line. Countries are ordered left to right from most to least populous based on 2018 adult (20+ years) population data. Source data are provided as Source Data files 1 and 7. Oz ounces, SSBs sugar-sweetened beverages, UIs uncertainty intervals.
Fig. 8
Fig. 8. National correlation of sugar-sweetened beverage intake (8 oz servings/week) in adults (20+ years) and sociodemographic development index by world region in 1990 and 2018 for 185 countries.
a National correlation of SSB intakes adults and SDI by world region in 1990 and b national correlation of SSB intakes adults and SDI by world region in 2018. Person correlation was assessed between SDI and SSB intakes among a total of 185 countries were included in this analysis. SSBs were defined as any beverage with added sugars having ≥50 kcal per 8 oz serving, including commercial or homemade beverages, soft drinks, energy drinks, fruit drinks, punch, lemonade, and aguas frescas. This definition excludes 100% fruit and vegetable juices, non-caloric artificially sweetened drinks, and sweetened milk. The standardized serving size used for this analysis is 8 oz serving (248 g). SDI was obtained from the Global Burden of Diseases study. Source data are provided as Source Data File 1. Centr/East Eur & Centr Asia Central/Eastern Europe and Central Asia, GDD Global Dietary Database, Latin Amer/Caribbean, Latin America/Caribbean, SDI sociodemographic development, SSB sugar-sweetened beverage, UI uncertainty interval.

Similar articles

Cited by

References

    1. Klemm S. Ethics: health equity and dietetics-related inequalities. J. Acad. Nutr. Diet. 2022;122:1558–1562. - PubMed
    1. Murray CJL, et al. Global burden of 87 risk factors in 204 countries and territories, 1990–2019: a systematic analysis for the Global Burden of Disease Study 2019. Lancet. 2020;396:1223–1249. - PMC - PubMed
    1. O’Hearn M, Liu J, Cudhea F, Micha R, Mozaffarian D. Coronavirus disease 2019 hospitalizations attributable to cardiometabolic conditions in the United States: a comparative risk assessment analysis. J. Am. Heart Assoc. 2021;10:e019259. - PMC - PubMed
    1. Singh GM, et al. Estimated global, regional, and national disease burdens related to sugar-sweetened beverage consumption in 2010. Circulation. 2015;132:639–666. - PMC - PubMed
    1. Malik VS, Hu FB. The role of sugar-sweetened beverages in the global epidemics of obesity and chronic diseases. Nat. Rev. Endocrinol. 2022;18:205–218. - PMC - PubMed

Publication types