. 2023 Oct 3;14(1):6089.
doi: 10.1038/s41467-023-41674-z.

Controlling piezoresistance in single molecules through the isomerisation of bullvalenes

Affiliations

Controlling piezoresistance in single molecules through the isomerisation of bullvalenes

Jeffrey R Reimers et al. Nat Commun. .

Abstract

Nanoscale electro-mechanical systems (NEMS) displaying piezoresistance offer unique measurement opportunities at the sub-cellular level, in detectors and sensors, and in emerging generations of integrated electronic devices. Here, we show a single-molecule NEMS piezoresistor that operates utilising constitutional and conformational isomerisation of individual diaryl-bullvalene molecules and can be switched at 850 Hz. Observations are made using scanning tunnelling microscopy break junction (STMBJ) techniques to characterise piezoresistance, combined with blinking (current-time) experiments that follow single-molecule reactions in real time. A kinetic Monte Carlo methodology (KMC) is developed to simulate isomerisation on the experimental timescale, parameterised using density-functional theory (DFT) combined with non-equilibrium Green's function (NEGF) calculations. Results indicate that piezoresistance is controlled by both constitutional and conformational isomerisation, occurring at rates that are either fast (equilibrium) or slow (non-equilibrium) compared to the experimental timescale. Two different types of STMBJ traces are observed, one typical of traditional experiments that are interpreted in terms of intramolecular isomerisation occurring on stable tipped-shaped metal-contact junctions, and another attributed to arise from junction‒interface restructuring induced by bullvalene isomerisation.


Conflict of interest statement

The authors declare no competing interests.

Figures

Fig. 1
Fig. 1. Molecular and interfacial structural changes in solution and in NEMS devices.
a Sigmatropic Cope rearrangements make bullvalene a fluxional molecule in solution. b Diaryl substituted (Ar = para (C6H4)‒SCH3) bullvalenes bind as bent isomers at short tip-tip distances in STMBJ experiments. c At specific tip extensions, bullvalene isomers with different conductances appear in equilibrium, allowing oscillating single-molecule reactions, occurring on the ms timescale, to be followed. d Tip retraction induces bullvalene isomerisation that controls conductance, manifesting piezoresistance. e Bullvalene isomerisation at short tip distances drives tip reconstruction. Blue colour in (be) represents possible electron pathways.
Fig. 2
Fig. 2. bis(4-thioanisole)bullvalene isomerism and isomerisation.
a Synthetic conditions and observed isomers in solution: 4 bromothioanisole 2.2 eq., Pd2(dba)3 20 mol%, [HP(t-Bu)3]BF4 80 mol%, NaOH, THF/H2O. 65 °C, 85% yield. b Possibly distinguishable constitutional isomers A − L, highlighting also 3 sets of enantiomeric pairs (B, B′), (D, D′), and (E, E′). c Network isomer diagram showing the possible Cope rearrangements.
Fig. 3
Fig. 3. STM measurements of the conductance of diaryl bullvalenes caught between two gold electrodes at a bias voltage of 50 mV in 1,2,4−trichlorobenzene solution using a tip retraction rate of 0.5 Å ms−1 and sampling rate of 30 kHz.
a Representative conductance traces. Highlighted in red is single molecule plateaus near 100 μG0, in black the plateaus at near 13 μG0 and in blue the plateaus near 9 μG0. b Two-dimensional conductance versus distance histogram of conductances accumulated from 2425 individual traces. The yield of the junctions, those which showed clear plateaus, is 48%; the two-dimensional conductance histograms of the entire 5067 curves collected are shown in the supporting information (Supplementary Fig. 10a). Circles highlight the features that correspond to the those highlighted by arrows in Fig. 3c. c One dimensional conductance histograms, with three conductance signals appearing as peaks near 100 μG0 (red arrow, η=3.6), 13 μG0 (black arrow, η=1.2), and 9 μG0 (blue arrow, η=1.1). d 2D correlation conductance map for the same data used to build the 1D conductance histogram in (c). Intersection regions labelled 1 to 6 correspond to the comparison of the relevant conductance signals at 100, 13, and 9 μG0: regions 1‒3 form the diagonal that reproduces the 1D-conductance histograms in (c), whilst off-diagonal regions 4‒6 give the strength of the correlation between each two of the three different conductance states. The dark blue colour in (b) represents the absence of data (0 counts) while the red colour represents the maximum counts for accumulated data, as indicated in the colour-bar scale. The light-blue colour in (d) represents the lack of correlation between data while the yellow colour represents the highest correlation.
Fig. 4
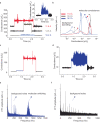
Fig. 4. STM single-molecule blinking (current‒time) experiments.
Blinking current‒time traces (a) representative blinks at specific separation between the tip and the surface at 11.8 Å (red trace), 12.8 Å (brown trace) and 16.2 Å (blue trace). The surface bias was +100 mV. b Conductance histograms built from 100 blinks for each distance; arrows at low conductance indicate the background tunnelling between the two gold electrodes in the absence of a molecule, whereas arrows at high conductance indicate through-molecule conductance. c An example of a blink, which represent 10% of the blinks observed at 16.2 Å, that switches from ≈10 μG0 (blue trace) to 100 μG0 (red trace). The molecular conductance is the difference between the blinking conductance and the background tunnelling conductance. d Typical of 80% of blinks at 16.2 Å, showing the current fluctuating by 2–5 fold at 750–1000 Hz (blue trace), unlike the blinks observed at 11.8 and 12.8 Å. e FFT analysis of the blinks observed at 16.2 Å assigned to bullvalene switching (blue histogram). f FFT analysis of the background tunnelling current in the absence of a connecting molecule.
Fig. 5
Fig. 5. Tipped gold – diaryl bullvalene – gold junctions used in initial STMBJ simulations.
Tipped gold – diaryl bullvalene – gold junctions comprising of 4-layer Au(111) (4 × 4) surfaces plus 4-atom atomic models to which bullvalenes bind. The structure shown is for the Amm conformer at d = 15.2 Å; green- bullvalene 3-membered ring, cyan- other carbon, white- hydrogen, yellow- sulfur, gold- gold. The parameter d is frozen in initial cluster-model simulations, whilst d’ is frozen in these periodic-image simulations, along with the outer two gold layers of each electrode model. Source data are provided as a Source Data file.
Fig. 6
Fig. 6. STMBJ kinetic Monte Carlo simulations of tipped gold – diaryl bullvalene – gold junctions.
STMBJ kinetic Monte Carlo simulations of tipped gold – diaryl bullvalene – gold junctions retracted at 0.5 Å ms−1 and sampled at 30 kHz for bullvalene constitutional isomers AL at various conformations m or p of the bullvalene-aryl bonds. a Lowest-conformer DFT potential-energy surfaces, or else just single-point energies for F, I, J, and L. b Various analogous DFT transition-state potential-energy surfaces. c Speedup factor for various Cope-rearrangements in situ for the slowest interconversion reaction rate, compared to that of a single reaction in solution (observed at 1.1 kHz); the squares pertain to the ADB interconversion at the equipotential separation of d = 15.6 Å. d Mole fraction of highly conductive isomers (results for others are shown in Supplementary Fig. 6). e NEGF junction conductances for the most significant isomers. f Conductance histogram made from 3000 simulated traces, and its major isomeric contributors. Colours for isomers: A black, B red, C blue, E brown. Colours for transition states: A–D blue, B–C red, B–D black, B–E magenta, D–G green, G–K brown. Source data are provided as a Source Data file.
Fig. 7
Fig. 7. Bullvalene-driven tip reconstruction.
At d = 9.2 Å, an Amp bullvalene conformer is bound to two gold tips with interaction energies ΔE with respect to separated tips and molecule: a initial extended structure bound to tip sides; b after relaxation to make a π-stacked structure located within the tip gap; c is activated to make a transition-state for tip reconstructing; d a cascade of processes leading to flattening of the lower tip; e a cascade of processes leading to flattening of the top tip. The atomic model used is a 3-layer Au(111) (5 × 5) surface with 10-atom tips; green- bullvalene 3-membered ring, cyan- other carbon, white- hydrogen, yellow- sulfur, gold- gold. Source data are provided as a Source Data file.
Fig. 8
Fig. 8. Simulated conductance traces for collapsed tips.
The collapsed structures for Cmp (red trace) and E (blue trace) optimised at d = 6.8 Å are retracted using MD at a rate of 1 Å ps−1 and the conductance calculated (exposing sub-ps-timescale dependence of conductance on atomic vibration). The strong conductance predicted at d = 8–10 Å could account for the observed average 100 μG0 observed in Fig. 3c, whilst the conductance at greater extension could account for the observed 9 and 13 μG0 peaks. Source data are provided as a Source Data file.

Similar articles

Cited by

  • A guide to bullvalene stereodynamics.
    Ives RA, Maturi W, Gill MT, Rankine C, McGonigal PR. Ives RA, et al. Chem Sci. 2024 Aug 23;15(36):14608-17. doi: 10.1039/d4sc03700f. Online ahead of print. Chem Sci. 2024. PMID: 39220163 Free PMC article.
  • Correlated shapeshifting and configurational isomerization.
    Hussein BA, Maturi W, Rylands MK, Bismillah AN, Wen Y, Aguilar JA, Ayub R, Rankine CD, McGonigal PR. Hussein BA, et al. Chem Sci. 2024 Aug 23;15(36):14618-24. doi: 10.1039/d4sc03699a. Online ahead of print. Chem Sci. 2024. PMID: 39239481 Free PMC article.
  • Role of Hydrogen Transfer in Functional Molecular Materials and Devices.
    Zhang E, Bai L, Chen Z, Zhang A, Tang Y, Ran J, Wang S, Wang J, Jia C, Guo X. Zhang E, et al. Precis Chem. 2025 Mar 11;3(5):233-260. doi: 10.1021/prechem.4c00097. eCollection 2025 May 26. Precis Chem. 2025. PMID: 40443766 Free PMC article. Review.

References

    1. Aragonès AC, et al. Electrostatic catalysis of a Diels–Alder reaction. Nature. 2016;531:88–91. - PubMed
    1. Gu C, et al. Label-free dynamic detection of single-molecule nucleophilic-substitution reactions. Nano Lett. 2018;18:4156–4162. - PubMed
    1. Tang C, et al. Identifying the conformational isomers of single-molecule cyclohexane at room temperature. Chem. 2020;6:2770–2781.
    1. Yang, C., et al. Unveiling the full reaction path of the Suzuki–Miyaura cross-coupling in a single-molecule junction. Nat. Nanotechnol. 16 1214–1223 (2021). - PubMed
    1. Yang C, et al. Electric field–catalyzed single-molecule Diels-Alder reaction dynamics. Sci. Adv. 2021;7:eabf0689. - PMC - PubMed