. 2023 Oct 3;13(1):16590.
doi: 10.1038/s41598-023-43856-7.

An eXplainable Artificial Intelligence analysis of Raman spectra for thyroid cancer diagnosis

Affiliations

An eXplainable Artificial Intelligence analysis of Raman spectra for thyroid cancer diagnosis

Loredana Bellantuono et al. Sci Rep. .

Abstract

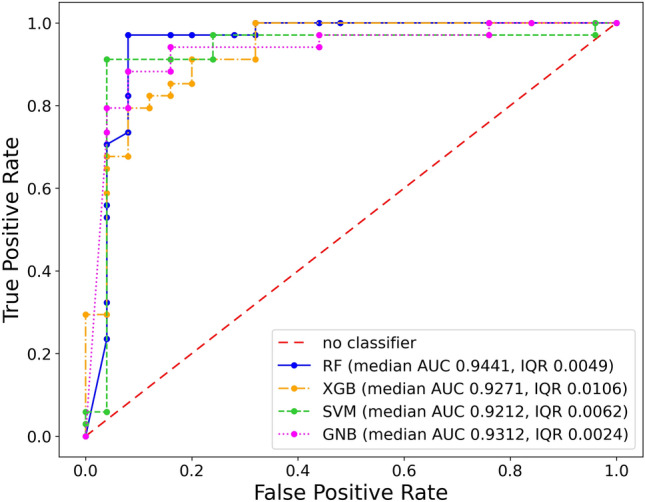
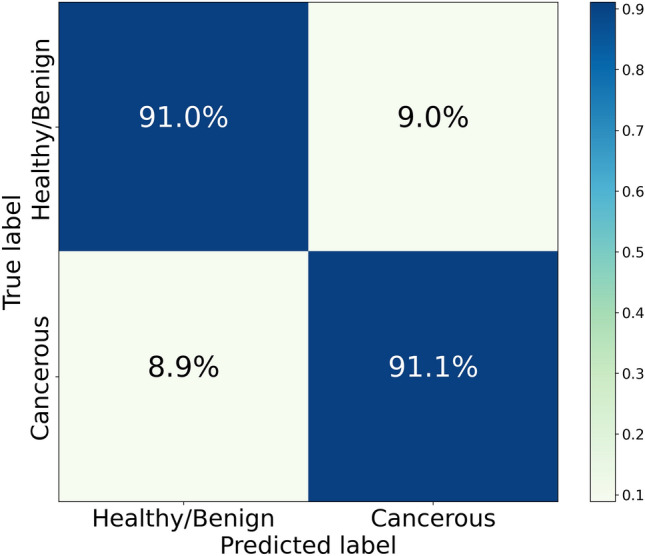
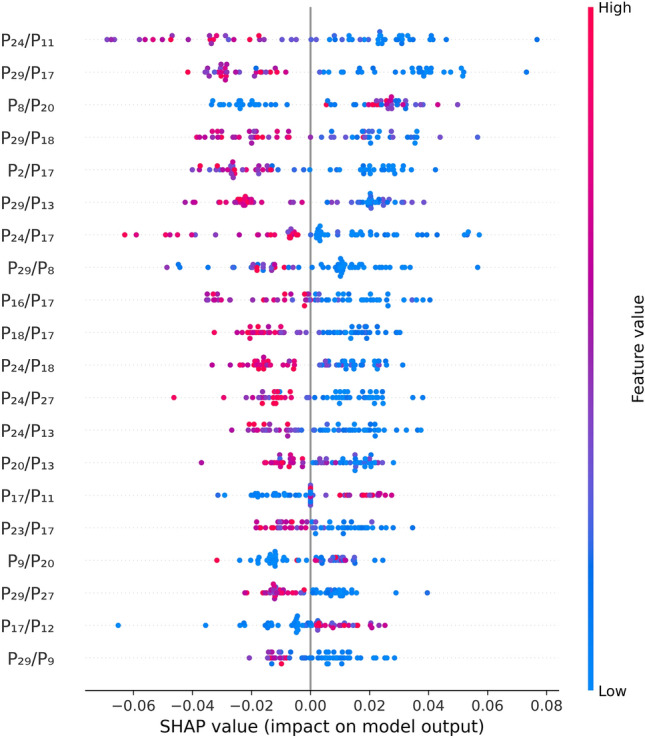
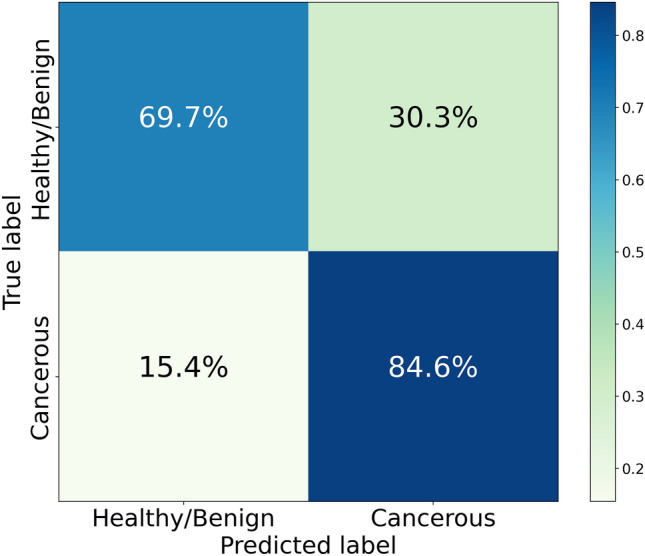
Raman spectroscopy shows great potential as a diagnostic tool for thyroid cancer due to its ability to detect biochemical changes during cancer development. This technique is particularly valuable because it is non-invasive and label/dye-free. Compared to molecular tests, Raman spectroscopy analyses can more effectively discriminate malignant features, thus reducing unnecessary surgeries. However, one major hurdle to using Raman spectroscopy as a diagnostic tool is the identification of significant patterns and peaks. In this study, we propose a Machine Learning procedure to discriminate healthy/benign versus malignant nodules that produces interpretable results. We collect Raman spectra obtained from histological samples, select a set of peaks with a data-driven and label independent approach and train the algorithms with the relative prominence of the peaks in the selected set. The performance of the considered models, quantified by area under the Receiver Operating Characteristic curve, exceeds 0.9. To enhance the interpretability of the results, we employ eXplainable Artificial Intelligence and compute the contribution of each feature to the prediction of each sample.


Conflict of interest statement

The authors declare no competing interests.

Figures

Figure 1
Figure 1
General workflow of the analysis.
Figure 2
Figure 2
Raman spectra. Typical Raman spectra of the examined thyroid tissues, labelled according to the histology report. Blue squares correspond to the Raman characteristic peaks of reduced cytochrome c, orange stars indicate the spectral lines of oxidised cytochrome c, green triangles the ones of oxidised cytochrome b and the red circles those of carotenoids.
Figure 3
Figure 3
Detailed workflow of the Machine Learning and eXplainable Artificial Intelligence (XAI) analysis. After preprocessing, 100 runs of the synthetic minority over-sampling technique (SMOTE) with different random seeds are executed. In each SMOTE run, a leave-one-out classification is implemented, and in the ith leave-one-out iteration (where i ranges from 1 to 59) the Boruta algorithm selects Ni relevant features, that are used to construct the training set; then, before implementing different Machine Learning algorithms, SMOTE is applied to oversample the minority class. The classification algorithms employed in this study are random forest (RF), XGBoost (XGB), support vector machine (SVM), and Gaussian Naïve Bayes (GNB). Their performances are quantified by the AUC metrics, which is the area under the receiver operating characteristic (ROC) curve. The impact of features on the prediction for each instance is evaluated through the Shapley (SHAP) values, averaged over all SMOTE runs.
Figure 4
Figure 4
Receiver operating characteristic (ROC) curves for one of the random forest (RF) classifiers that maximize median AUC (n_estimators = 50, max_depth = 5, criterion = ‘entropy’), for XGBoost (XGB) and support vector machine (SVM) algorithms with arbitrary internal parameters, and for the Gaussian Naïve Bayes (GNB) algorithm. Plots referred to XGB and SVM have been obtained in the configurations num_parallel_tree = 100, max_depth = 3, n_jobs = 1, and c = 1, kernel = ‘entropy’, respectively. The True Positive Rate and False Positive Rate coordinates of points in the ROC curves are median values computed over 100 SMOTE runs.
Figure 5
Figure 5
Confusion matrix obtained by collecting the predictions of 100 SMOTE runs, with different random seeds, for a Random Forest model with n_estimators = 50, max_depth = 5, and criterion = ‘entropy’. Such a model provides the best performance in terms of AUC (median 0.9441, interquartile range 0.0049) among the considered ones.
Figure 6
Figure 6
Summary plot of the mean SHAP values, computed on 100 runs of the SMOTE algorithm, with different random seeds, for a Random Forest model with n_estimators = 50, max_depth = 5, and criterion = ‘entropy’.
Figure 7
Figure 7
Confusion matrix quantifying the aggregated performance of 100 SMOTE runs of a Random Forest model with n_estimators = 50, max_depth = 5, and criterion = ‘entropy’, applied to all 72 available samples, namely the 59 spectra included in the original dataset and 13 ambiguous spectra. The results are obtained through a two-step process: first, the 59 unambiguous spectra are classified with a leave-one-out procedure, not involving the ambiguous ones; then the 13 ambiguous spectra are classified with the same algorithm trained only on the 59 unambiguous ones.

References

    1. NIH National Cancer Institute. Thyroid Cancer—Cancer Stat Facts. https://seer.cancer.gov/statfacts/html/thyro.html (2023). Accessed 22 June 2023.
    1. Vaccarella S, et al. Worldwide thyroid-cancer epidemic? The increasing impact of overdiagnosis. N. Engl. J. Med. 2016;375:614–617. - PubMed
    1. Rusinek D, et al. Current advances in thyroid cancer management. Are we ready for the epidemic rise of diagnoses? Int. J. Mol. Sci. 2017;18:1817. - PMC - PubMed
    1. Patel KN, et al. The American Association of Endocrine Surgeons guidelines for the definitive surgical management of thyroid disease in adults. Ann. Surg. 2020;271:e21–e93. - PubMed
    1. Alyami J, et al. Interobserver variability in ultrasound assessment of thyroid nodules. Medicine. 2022;101:e31106. - PMC - PubMed

Publication types