. 2023 Oct 4;22(1):163.
doi: 10.1186/s12943-023-01859-y.

LINC00922 decoys SIRT3 to facilitate the metastasis of colorectal cancer through up-regulation the H3K27 crotonylation of ETS1 promoter

Affiliations

LINC00922 decoys SIRT3 to facilitate the metastasis of colorectal cancer through up-regulation the H3K27 crotonylation of ETS1 promoter

Meijian Liao et al. Mol Cancer. .

Abstract

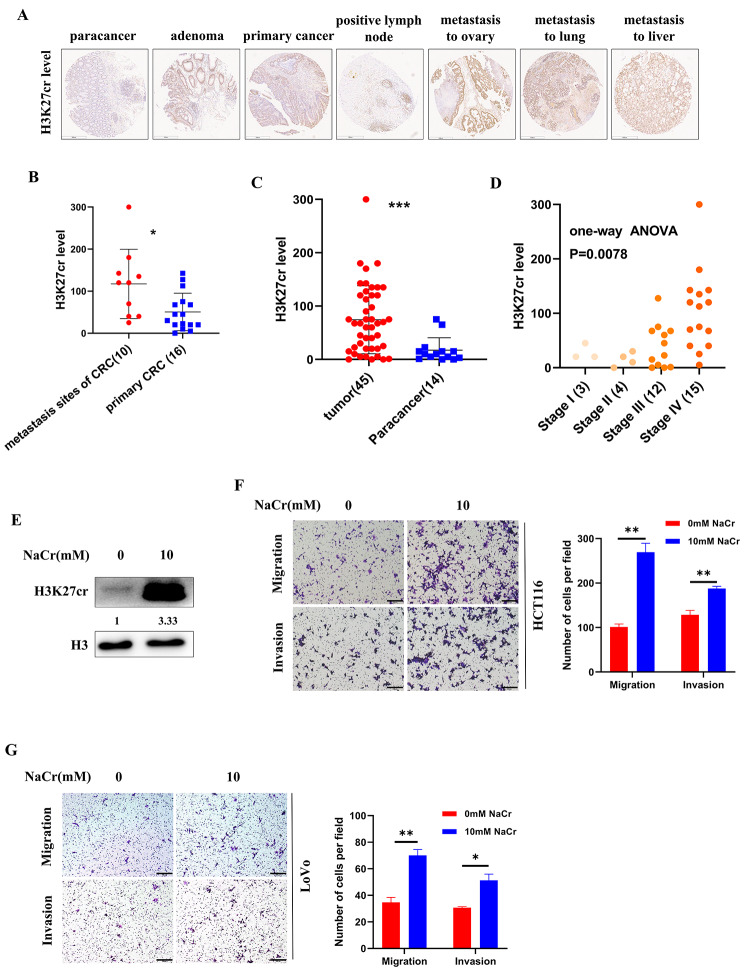
Background: Lysine crotonylation (Kcr) is up-regulation in colorectal cancer (CRC) tissues, while its specific contribution remains uncertain. This study aimed to elucidate the role and mechanism of crotonylation on Lys27 of histone H3 (H3K27cr) in facilitating CRC metastasis.

Methods: Immunohistochemistry was employed to investigate the correlation between H3K27cr and CRC metastasis. Both in vitro and in vivo assays employing loss function or gain function approaches were conducted to elucidate the role of LINC00922 in promoting CRC metastasis. ScRNA-seq analysis and immunoprecipitation analyses were employed to explore the underlying mechanism by which LINC00922 facilitates CRC metastasis through H3K27cr.

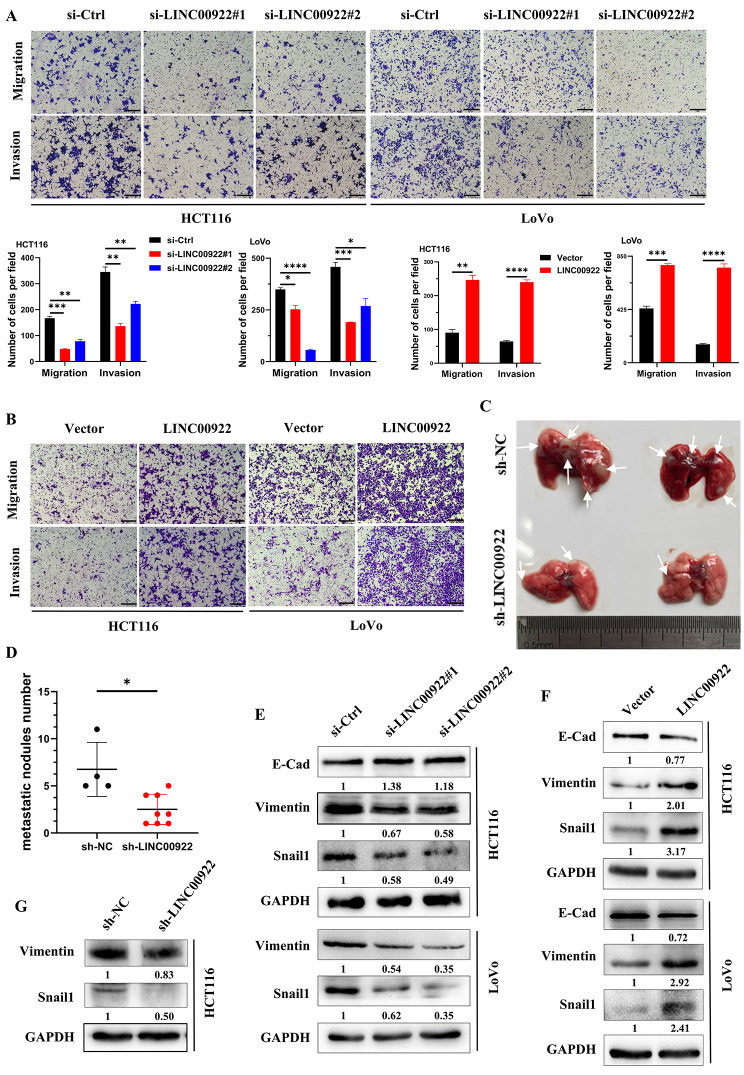
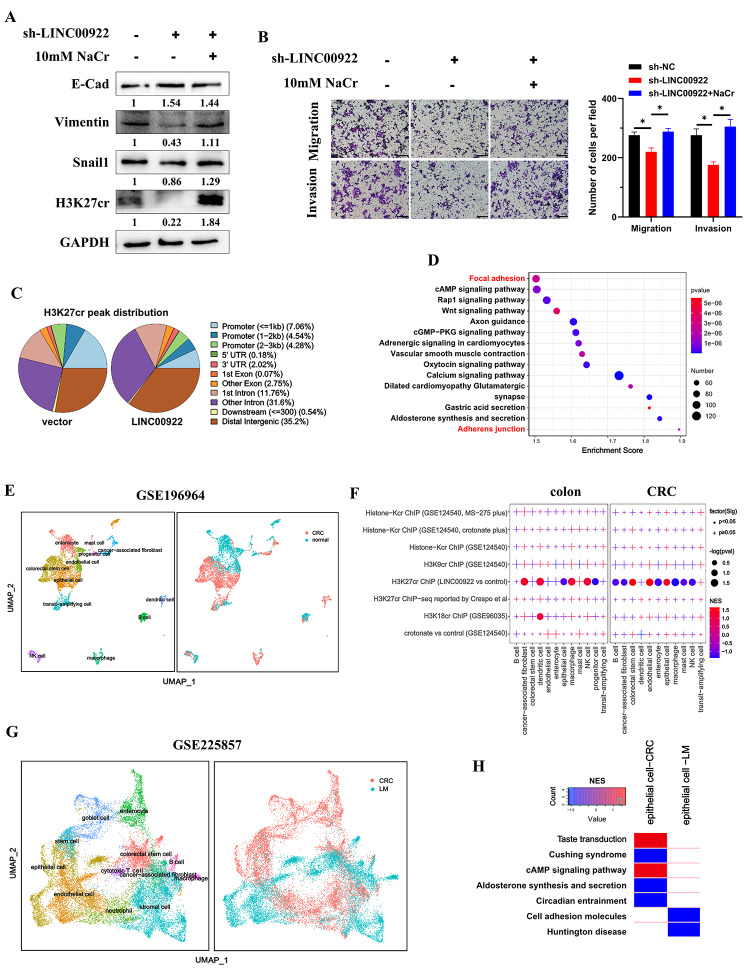
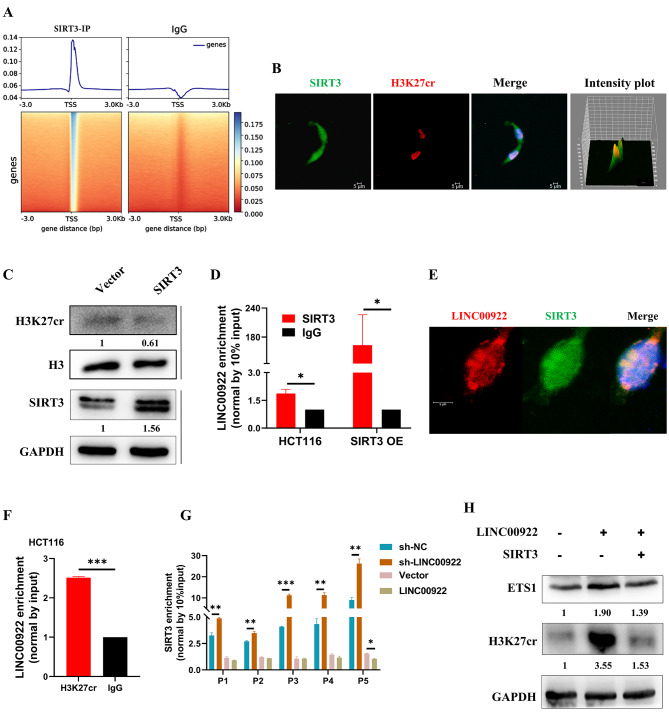
Results: Clinically, H3K27cr was upregulated in metastatic CRC tissues and positively correlated with advanced clinical stages. Functionally, knockdown of LINC00922 inhibited migration of CRC cells both in vitro and in vivo. Furthermore, the supplementation of NaCr restored the migration and invasion levels of LINC00922 stable knockdown cells by restoring the H3K27cr level. Mechanistically, LINC00922 promoted invasion and migration through H3K27cr mediated cell adhesion molecules (CAMs) in epithelial cells. Notably, LINC00922 interacted with the protein sirtuin 3 (SIRT3) and obstructed its binding to the promoter region of ETS1, leading to an elevation in the level of H3K27cr in this promoter region and the subsequent activation of ETS1 transcription.

Conclusions: Our findings uncovered a novel regulatory function of H3K27cr, regulated by LINC00922, in facilitating CRC metastasis. This discovery contributed to a deeper comprehension of the involvement of histone crotonylation in the metastatic process of CRC.

Keywords: Colorectal cancer; H3K27cr; LINC00922; Metastasis; SIRT3.


Conflict of interest statement

The authors declare no competing interests.

The authors declare no potential conflicts of interest.

Figures

Fig. 1
Fig. 1
Clinical results showing H3K27cr was associated with CRC metastasis. (A) Representative immunohistochemistry images depicting H3K27cr level across different types of CRC tissues. Scale bar, 500 μm. (B-D) Mann-Whitney U (B-C) and one-way ANOVA (D) analysis of H3K27cr level across different types of CRC tissues. The 45 cases of tumor samples in Fig. 1C contained 10 cases of distant metastatic colorectal cancer tissues, 16 cases of primary colorectal cancer tissues, 11 cases of colorectal adenoma tissues, and 8 cases positive lymph node tissues. (E) Immunoblotting analysis of H3K27cr level in HCT116 cells treated with 10 mM NaCr for 48 h. The numbers below H3K27cr indicate the ratio of H3K27cr versus H3 in experimental groups to that in control group, analyzed using Image J2. (F-G) Transwell assay images demonstrating the levels of invasion and migration in HCT116 (F) and LoVo cells (G) treated with 10 mM NaCr for 48 h (left panel). Scale bar, 200 μm. Cells were counted in 3 random fields (right panel). Data are represented as means ± SD, *P < 0.05, **P < 0.01, ***P < 0.001, unpaired, two-tailed, Student’s t-test
Fig. 2
Fig. 2
Association of LINC00922 with CRC metastasis and poor prognosis. (A) Enrichment of genes with promoter occupied by histone crotonalytion across various dysregulated lncRNAs. The significance was calculated using GSEA. Dot indicates P < 0.05, and plus symbol indicates P ≥ 0.05. The red point represents gene set positively expressed with the corresponding lncRNA, and the blue point represents the opposite. The size of point represents the negative base 10 logarithm of p-value. NES: normalized enrichment score. (B) Immunoblotting analysis of H3K27cr level in HCT116 cells transfected with LINC00922 plasmid for 48 h. The numbers below H3K27cr indicate the ratio of H3K27cr versus H3 in experimental groups to that in control group, analyzed using Image J2. (C) Kaplan-Meier survival curve analysis of the association of LINC00922 expression with overall survival (OS, n = 326) in CRC samples from the TCGA cohort. (D) The Mann-Whitney U analysis of LINC00922 expression level between normal and CRC tissues from the TCGA database. ****P < 0.0001. E-F. Mann-Whitney U analysis of LINC00922 expression in CRC samples from the TCGA cohort with or without distant metastasis (E), or with or without lymph node invasion (F). **P < 0.01, ****P < 0.0001. G. Meta-analysis of the relationship between LINC00922 expression and distant metastasis in CRC samples (n = 972) from the GEO database
Fig. 3
Fig. 3
LINC00922 promoted CRC metastasis. (A-B) Representative images of transwell assay showing the invasion and migration levels of CRC cells after instantaneous knockdown (A) or overexpression (B) of LINC00922 for 48 h. Scale bar, 200 μm. Cells were counted in 3 random fields (middle panel). (C) Illustrations of LINC00922 stable knockdown HCT116 cell-derived lung metastases. The arrow indicates the tumor nodule. (D) Comparison of lung metastasis nodules between the sh-NC and sh-LINC00922 groups. (E-G) Immunoblotting analysis of E-Cad, Vimentin, Snail1, and GAPDH levels in CRC cells with LINC00922 transient knockdown (E), transient overexpression (F), or stable knockdown (G). The numbers below western bands indicate the ratio of protein versus GAPDH in experimental groups to that in control group, analyzed using Image J2. Data are represented as means ± SD, *P < 0.05, **P < 0.01, ***P < 0.001, ****P < 0.0001, unpaired, two-tailed, Student’s t-test
Fig. 4
Fig. 4
LINC00922 promoted invasion and migration via H3K27cr mediated CAMs in epithelial cells. (A) Immunoblotting analysis of E-Cad, Vimentin, and Snail1 expression in LINC00922 stable knockdown HCT116 cells treated with 10 mM NaCr for 48 h. The numbers below western bands indicate the ratio of protein versus GAPDH in experimental groups to that in control group, analyzed using Image J2. (B) Transwell assay images demonstrating the level of invasion and migration in LINC00922 stable knockdown HCT116 cells treated with 10 mM NaCr for 48 h (left panel). Scale bar, 200 μm. Cells were counted in 3 random fields (right panel). Data are represented as means ± SD, *P < 0.05, unpaired, two-tailed, Student’s t-test. (C) H3K27cr peaks distribution in HCT116 cells transfected with the LINC00922 or control plasmid for 48 h. (D) KEGG analysis of enrichment pathways of genes annotated by 21,253 different H3K27cr peaks in HCT116 cells with or without transient LINC00922 overexpression for 48 h. (E) UMAP plotting single cell transcriptome profiles of CRC tissues (GSE196964). The color represents different cell types (left panel) or tissue types (right panel). (F) Enrichment of 653 genes and other histone crotonylation-related gene sets across various cell types of colon tissues (left panel) and CRC tissues (right panel). The significance was calculated using GSEA. Dot indicates P < 0.05, and plus symbol indicates P ≥ 0.05. The red point represents gene set positively expressed in the corresponding cell type, and the blue point represents the opposite. The size of dot represents the negative base 10 logarithm of p-value. (G) UMAP plotting single cell transcriptome profile of CRC tissues (GSE225857). The color represents different cell types (left panel) or tissue types (right panel). (H) Heatmap showing the enrichment of pathways annotated by 653 genes in epithelial cells derived from primary CRC and LM tissues. The NES was calculated using GSEA. The red represents pathway positively enriched in the epithelial cells, and the blue represents the opposite. LM: liver metastasis
Fig. 5
Fig. 5
LINC00922 promoted invasion and migration via ETS1. (A-B) Representative images of Transwell (A) and wound healing assay (B) depicting motility of cells following ETS1 overexpression for 48 h (left panel). Scale bar, 200 μm. The number of cells and percent of wound closure were counted in 3 random fields (right panel). (C) Immunoblotting analysis of E-Cad, Vimentin, Snail1, ETS1, and GAPDH levels in CRC cells subjected to ETS1 transient overexpression for 48 h. (D-E) Representative images of Transwell assay (D) and wound healing assay (E) depicting motility in HCT116 cells co-transfected with LINC00922 plasmid and si-ETS1 for 48 h (left panel). Scale bar, 200 μm. The number of cells and percent of wound closure were counted in 3 random fields (right panel). (F) Immunoblotting analysis of Vimentin, Snail1, ETS1, and GAPDH levels in CRC cells co-transfected with LINC00922 plasmid and si-ETS1 for 48 h. The numbers below western bands indicate the ratio of protein versus GAPDH in experimental groups to that in control group, analyzed using Image J2. Data are represented as means ± SD, *P < 0.05, **P < 0.01, ***P < 0.001, ****P < 0.0001, unpaired, two-tailed, Student’s t-test
Fig. 6
Fig. 6
LINC00922 regulated ETS1 expression via H3K27cr. (A) qRT-PCR analysis of association between LINC00922 and ETS1 expression in CRC tissues (n = 28). (B-G) qRT-PCR analysis (B-D) and immunoblotting analysis (E-G) of ETS1 expression in HCT116 cells with LINC00922 stable knockdown (B, E), or CRC cells transfected with si-LINC00922 (C, F) or LINC00922 plasmid (D, G) for 48 h. (H) Immunofluorescence images of ETS1 (red) in HCT116 cells with LINC00922 stable knockdown. Scale bar, 100 μm. (I) Immunoblotting analysis of ETS1, H3K27cr, H3, and GAPDH levels in HCT116 cells treated with 10 mM NaCr for 48 h. (J-K) qRT-PCR (J) and immunoblotting (K) analysis of ETS1 expression in LINC00922 stable knockdown HCT116 cells supplemented with 10 mM NaCr for 48 h. (L) Image showing H3K27cr enrichment on the EST1 promoter region in HCT116 with LINC00922 transient overexpression for 48 h. (M) ChIP-qPCR assay analysis of H3K27cr enrichment on the EST1 promoter in HCT116 cells treated with LINC00922 stable knockdown or transient overexpression for 48 h. The numbers below western bands indicate the ratio of protein versus GAPDH or H3 in experimental groups to that in control group, analyzed using Image J2. Data are represented as means ± SD, *P < 0.05, **P < 0.01, ***P < 0.001, ****P < 0.0001, unpaired, two-tailed, Student’s t-test
Fig. 7
Fig. 7
LINC00922 altered H3K27cr occupation via SIRT3. (A) Heatmaps and signal density plots centered on transcriptional start sites of genes targeted by SIRT3. (B) Immunofluorescence images depicting the location of SIRT3 (green) and H3K27cr (red) in HCT116 cells. Scale bar, 5 μm. (C) Immunoblotting analysis of H3K27cr level in HCT116 cells transfected with SIRT3 plasmid for 48 h. (D) RIP-qPCR analysis of LINC00922-SIRT3 interaction in HCT116 cells with or without SIRT3 transient overexpression for 48 h (n = 3). (E) RNA-FISH and immunofluorescence staining of LINC00922 RNA (red) and SIRT3 protein (green) in HCT116 cells. Scale bar, 5 μm. (F) RIP-qPCR analysis of LINC00922-H3K27cr interaction in HCT116 cells. (G) ChIP-qPCR analysis of SIRT3 enrichment on the EST1 promoter in HCT116 cells with LINC00922 stable knockdown or transient overexpression for 48 h (n = 3). H Immunoblotting analysis of ETS1 expression in HCT116 cells co-transfected with LINC00922 and SIRT3 plasmids for 48 h. The numbers below western bands indicate the ratio of protein versus GAPDH or H3 in experimental groups to that in control group, analyzed using Image J2. Data are represented as means ± SD, *P < 0.05, **P < 0.01, ***P < 0.001, unpaired, two-tailed, Student’s t-test

References

    1. Tan M, Luo H, Lee S, Jin F, Yang JS, Montellier E, Buchou T, Cheng Z, Rousseaux S, Rajagopal N, et al. Identification of 67 histone marks and histone lysine crotonylation as a new type of histone modification. Cell. 2011;146(6):1016–28. doi: 10.1016/j.cell.2011.08.008. - DOI - PMC - PubMed
    1. Fang Y, Xu X, Ding J, Yang L, Doan MT, Karmaus PWF, Snyder NW, Zhao Y, Li JL, Li X. Histone crotonylation promotes mesoendodermal commitment of human embryonic stem cells. Cell Stem Cell. 2021;28(4):748–763e747. doi: 10.1016/j.stem.2020.12.009. - DOI - PMC - PubMed
    1. Liu S, Yu H, Liu Y, Liu X, Zhang Y, Bu C, Yuan S, Chen Z, Xie G, Li W, et al. Chromodomain Protein CDYL Acts as a Crotonyl-CoA hydratase to regulate histone crotonylation and spermatogenesis. Mol Cell. 2017;67(5):853–866e855. doi: 10.1016/j.molcel.2017.07.011. - DOI - PubMed
    1. Wang J, Shen F, Liu F, Zhuang S. Histone modifications in Acute kidney Injury. Kidney Dis (Basel Switzerland) 2022;8(6):466–77. - PMC - PubMed
    1. Jiang G, Nguyen D, Archin NM, Yukl SA, Méndez-Lagares G, Tang Y, Elsheikh MM, Thompson GR 3rd, Hartigan-O’Connor DJ, Margolis DM et al. HIV latency is reversed by ACSS2-driven histone crotonylation. The Journal of clinical investigation 2018, 128(3):1190–1198. - PMC - PubMed

Publication types