. 2022 Apr 20;2(1):10.
doi: 10.1186/s43897-022-00031-2.

Yang cycle enzyme DEP1: its moonlighting functions in PSI and ROS production during leaf senescence

Affiliations

Yang cycle enzyme DEP1: its moonlighting functions in PSI and ROS production during leaf senescence

Chu-Kun Wang et al. Mol Hortic. .

Abstract

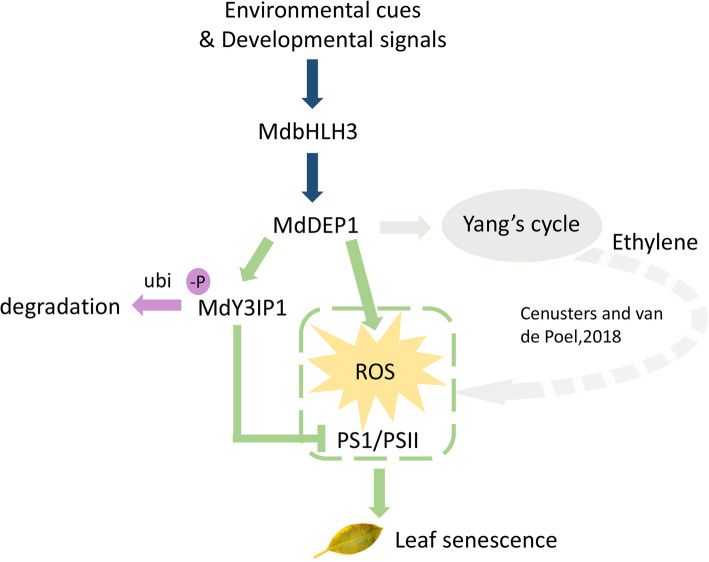
Ethylene-mediated leaf senescence and the compromise of photosynthesis are closely associated but the underlying molecular mechanism is a mystery. Here we reported that apple DEHYDRATASE-ENOLASE-PHOSPHATASE-COMPLEX1 (MdDEP1), initially characterized to its enzymatic function in the recycling of the ethylene precursor SAM, plays a role in the regulation of photosystem I (PSI) activity, activating reactive oxygen species (ROS) homeostasis, and negatively regulating the leaf senescence. A series of Y2H, Pull-down, CO-IP and Cell-free degradation biochemical assays showed that MdDEP1 directly interacts with and dephosphorylates the nucleus-encoded thylakoid protein MdY3IP1, leading to the destabilization of MdY3IP1, reduction of the PSI activity, and the overproduction of ROS in plant cells. These findings elucidate a novel mechanism that the two pathways intersect at MdDEP1 due to its moonlighting role in destabilizing MdY3IP1, and synchronize ethylene-mediated leaf senescence and the compromise of photosynthesis.

Keywords: DEHYDRATASE-ENOLASE-PHOSPHATASE-COMPLEX1; Leaf senescence; Photosynthesis; Photosystem I; ROS; Yang cycle.


Conflict of interest statement

The authors declare that they have no competing interests.

Figures

Fig. 1
Fig. 1
MdDEP1 plays key roles in chloroplast development. A. Light microscopy of leaves at T3 stage. The red arrows indicate the distribution of chloroplasts in mesophyll cells. Bars = 200 μm. B. Transmission electron microscopy of leaves at T3 stage. Bars = 2 μm
Fig. 2
Fig. 2
Gene expression profiling of MdDEP1-transgenic apple plantlets with RNAseq compared to the WT apple plantlets. A-B. Venn diagram analysis of common upregulated (A) and downregulated (B) genes (DEG; − 1.5 > logFC> 1.5; FDR < 0.01). C-D. Expression changes of genes involved in the photosynthetic pathway in WT vs TRV-MdDEP1 (C) and WT vs MdDEP1 (D), respectively. Red boxes, up-regulated genes; green boxes, down-regulated genes. E-F. Heat map showing selected differentially expressed genes with log2fold change scale. Means of three experiments are shown; complete data are given in Appendix S1 and S2. E. Positive regulator genes of leaf senescence. F. Negative regulator of leaf senescence and PSI and PSII genes
Fig. 3
Fig. 3
Effect of MdDEP1 overexpression on the Yang’s cycle. A. Expression of pCaMV35S::MdDEP1-GFP in transiently transformed apple leaf protoplasts. All experiments were assayed 6–12 h after bombardment. Protoplasts expressing pCaMV35S::GFP were used as control. Bars = 50 μm. B. Immunoblot assay of protein extracts from apple leaf protoplasts, cytosol, chloroplast, and mitochondria, using specific antibodies against the chloroplast protein LHCB1, the mitochondria-specific cytochrome C protein, and the cytosol-localized protein ACTIN. C-E. Methionine contents (C), ethylene production (D), the expression of genes in Yang’s cycle (E) in the WT and three 35S::MdDEP1-Myc transgenic apple plantlets. F. WT and MdDEP1 overexpression plants treated with or without 150 mg L− 1 AVG for 2-weeks. G. Chlorophyll content of plants shown in (F). Note: In (C-E) and (G), the data are shown as the mean ± SE, which were analyzed based on more than 9 replicates. Statistical significance was determined using Student’s t-test in different samples. *P < 0.01; **P < 0.001
Fig. 4
Fig. 4
MdDEP1 interacts with, dephosphorylates and destabilizes MdY3IP1. A. MdDEP1 interacts with MdY3IP1 in Y2H assays. Interaction was shown by the ability of yeast cells to grow on minimal medium -Leu/−Trp/−His/−Ade with or without β-galactosidase. B. Co-IP assays of MdDEP1 and MdY3IP1 in apple leaf protoplasts expressing the 35S::MdDEP1-GFP and the 35S:: MdY3IP1-Myc fusion proteins. The MdDEP1-GFP proteins were immunoprecipitated with an anti-GFP antibody and immunoblotted with an anti-Myc antibody. Note: Red Asterisk and pound sign represent GFP and MdDEP1-GFP proteins, respectively. C. In vitro pull-down assays using antibodies against the GST tag. Both the MdDEP1-His and the MdY3IP1-GST are expressed and purified from E. coli. D. MdDEP1 dephosphorylates MdY3IP1 protein in vitro. The phosphatase assay was initiated by adding radiolabeled ATP to the mixtures. Purified proteins are from E. coli expression. Total protein was extracted from apple leaves. MdDEP1-His is indicated by the black asterisk. MdY3IP1-GST is indicated by black triangles. Note: Phosphorylated protein bands were quantified by scanning densitometry using a Hewlett Packard scanjet scanner and Scanplot software. E. E. coli expressed MdDEP1 facilitates the degradation of the MdY3IP1-Myc proteins expressed in the apple leaf protoplasts. Total proteins were extracted from 35S::MdY3IP1-Myc transiently transformed apple leaf protoplasts, and incubated with E. coli expressed MdDEP1-His proteins or buffer control. Actin is used as a control. Note: Protein bands were quantified by scanning densitometry using a Hewlett Packard scanjet scanner and Scanplot software. F. Degradation assays of recombinant MdY3IP1-GST proteins in the presence of protein extracts from the WT apple leaf protoplasts or the ones expressing 35S::MdDEP1 or 35S::antiMdDEP1. Samples were incubated in the degradation buffer with or without proteasome inhibitor (50 mM MG132). MdY3IP1-GST levels were visualized by immunoblotting using the anti-GST antibody. ACTIN was used as control. G. The degradation curve of MdY3IP1-GST proteins as indicated in (F). Quantification of the MdY3IP1-GST proteins using ImageJ software
Fig. 5
Fig. 5
MdDEP1 attenuates PSI activity in apple leaf cells. A. Induction and relaxation of NPQ monitored during dark-to-light transition (120 μmol photons m− 2 s− 1). Curves represent an average of six independent measurements. B. Re-reduction of P700+ in darkness. P700 was oxidized by illumination of the leaf with far red (FR) light for 30 s and after termination of FR illumination, P700+ re-reduction was monitored in darkness. Curves, representing an average of six independent measurements, are normalized to the same amplitude for direct comparison of the kinetics. C. Immunoblot assays of PS I core protein subunits PsaA, PsaD, and PsaF, and PS II reaction center protein D1. An anti-MdDEP1 antibody was used to detect MdDEP1 and an anti-ACTIN antibody was used as a control. Note: Protein bands were quantified by scanning densitometry using a Hewlett Packard scanjet scanner and Scanplot software. D. Accumulation of PSI complexes in the WT and three MdDEP1 transgenic apple plantlets. Thylakoids were isolated at the end of the dark period, solubilized with digitonin and protein complexes were separated by large pore blue native analysis. Gels were loaded on Chl basis. PSI complexes were identified by second dimension (BN-PAGE). A representative example from three independent biological replications is shown
Fig. 6
Fig. 6
MdDEP1 triggers ROS overproduction in apple leaf cells. A. ATPase content in the WT and MdDEP1 transgenic apple plantlets. B. Protoplasts isolated from WT and MdDEP1-overexpressing apple leaves were incubated in C-H2DCFDA for 90 s. C. The fluorescence signals of protoplasts in (B) were quantified by pixel intensity. Data represent means ± SD of 12 to 15 individual protoplasts. D. DAB staining for H2O2 in the leaves of the WT and MdDEP1 transgenic apple plantlets. E. DAB staining intensity as determined with imageJ software. F. NBT staining for superoxide in the leaves of the WT and MdDEP1 transgenic apple plantlets. G. NBT staining intensity as determined with imageJ software. Note: In (A), (C), (E), and (G), the data are shown as the mean ± SE, which were analyzed based on more than 9 replicates. Statistical significance was determined using Student’s t-test in different samples. *P < 0.01; **P < 0.001
Fig. 7
Fig. 7
The moonlighting protein MdDEP1 functions in two different directions to eventually regulate/control leaf senescence. On one direction, MdDEP1 activates the Yang’s cycle to promote ethylene production and signaling, which will weaken the function of photosystems and promote ROS production. On the other direction, MdDEP1 promote the MdY3IP1 dephosphorylation, whose degradation also inhibits the function of photosystems and promote ROS production. The weakened PSI/PSII functions and increased ROS production will lead to leaf senescence

References

    1. Adams DO, Yang SF. Ethylene biosynthesis: identification of 1-aminocyclopropane-1-carboxylic acid as an intermediate in the conversion of methionine to ethylene. Proc Natl Acad Sci U S A. 1979;76(1):170–174. doi: 10.1073/pnas.76.1.170. - DOI - PMC - PubMed
    1. Albus C, Ruf S, Schöttler MA, Lein W, Kehr J, Bock R. Y3IP1 a nucleus-encoded thylakoid protein cooperates with the plastid-encoded Ycf3 protein in photosystem I assembly of tobacco and Arabidopsis. Plant Cell. 2010;22(8):2838–2855. doi: 10.1105/tpc.110.073908. - DOI - PMC - PubMed
    1. Amunts A, Toporik H, Borovikova A, Nelson N. Structure determination and improved model of plant photosystem I. J Biol Chem. 2010;285(5):3478–3486. doi: 10.1074/jbc.M109.072645. - DOI - PMC - PubMed
    1. Audic S, Claverie JM. The significance of digital gene expression profiles. Genome Res. 1997;7(10):986–995. doi: 10.1101/gr.7.10.986. - DOI - PubMed
    1. Boudreau E, Takahashi Y, Lemieux C, Turmel M, Rochaix JD. The chloroplast ycf3 and ycf4 open reading frames of Chlamydomonas reinhardtii are required for the accumulation of the photosystem I complex. EMBO J. 1997;16(20):6095–6104. doi: 10.1093/emboj/16.20.6095. - DOI - PMC - PubMed

LinkOut - more resources