. 2023 Sep 14;3(4):100131.
doi: 10.1016/j.bpr.2023.100131. eCollection 2023 Dec 13.

Decoding stoichiometric protein synthesis in E. coli through translation rate parameters

Affiliations

Decoding stoichiometric protein synthesis in E. coli through translation rate parameters

Inayat Ullah Irshad et al. Biophys Rep (N Y). .

Abstract

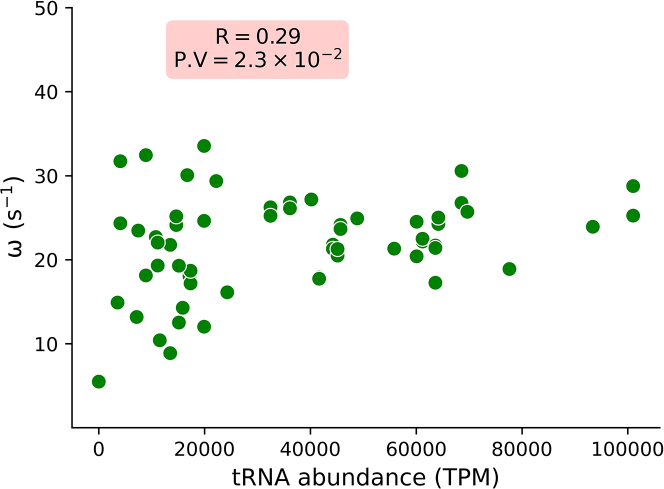
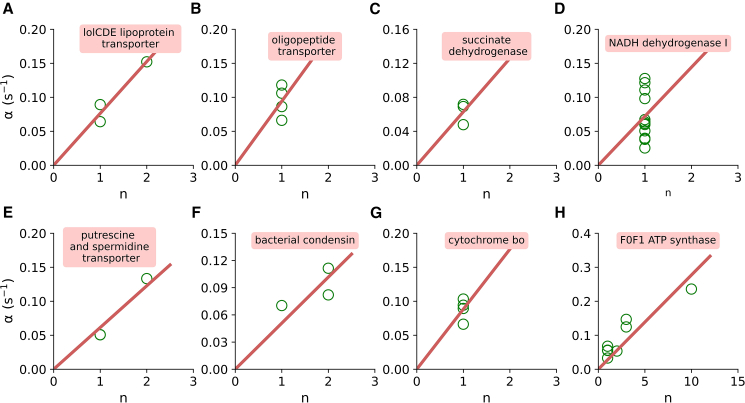
E. coli is one of the most widely used organisms for understanding the principles of cellular and molecular genetics. However, we are yet to understand the origin of several experimental observations related to the regulation of gene expression in E. coli. One of the prominent examples in this context is the proportional synthesis in multiprotein complexes where all of their obligate subunits are produced in proportion to their stoichiometry. In this work, by combining the next-generation sequencing data with the stochastic simulations of protein synthesis, we explain the origin of proportional protein synthesis in multicomponent complexes. We find that the estimated initiation rates for the translation of all subunits in those complexes are proportional to their stoichiometry. This constraint on protein synthesis kinetics enforces proportional protein synthesis without requiring any feedback mechanism. We also find that the translation initiation rates in E. coli are influenced by the coding sequence length and the enrichment of A and C nucleotides near the start codon. Thus, this study rationalizes the role of conserved and nonrandom features of genes in regulating the translation kinetics and unravels a key principle of the regulation of protein synthesis.


Conflict of interest statement

The authors declare no competing interests.

Figures

Fig. 1
Fig. 1
Estimation of translation initiation rates in E. coli and molecular factors that may influence them. Probability distribution of the estimated E. coli initiation rates is plotted in (A). E. coli initiation rates are plotted against the CDS length, mRNA stability near the start codon, and Shine-Dalgarno (SD) similarity score in (B), (C), and (D), respectively. In (D), blue color data points are the average initiation rates at different SD similarity scores.
Fig. 2
Fig. 2
Enrichment of A and C nucleotides near the start codon influences the initiation rate. Translation initiation rates are plotted against the number of A and C nucleotides between the start codon and 5 and 13 nucleotides upstream of it in (A) and (B), respectively. Blue colored points in both figures are the average initiation rates at different number of A and C nucleotides in (A) and (B), respectively.
Fig. 3
Fig. 3
The average codon translation rate at which a specific codon is translated by the ribosome is influenced by the concentration of its corresponding cognate tRNA molecule.
Fig. 4
Fig. 4
Translation initiation and mRNA copy number determines the cellular protein abundance. (A) Overall protein synthesis rate measured from our simulations (F) are plotted against the ones reported in experiments (6). (B) Protein synthesis rate from each E. coli transcript (f) is plotted as a function of translation initiation rate (discrete data points). The red solid line is the identity line. (C) Cellular protein abundances are plotted against the product of the mRNA copy number and initiation rate.
Fig. 5
Fig. 5
Machine learning model predicts translation initiation rate with a reasonable accuracy. (A) Predicted initiation rates are plotted against the ones computed using the Ribo-seq and RNA-seq data reported in (6,33). (B) The relative contribution of molecular factors influencing initiation rate is shown.
Fig. 6
Fig. 6
Translation initiation rate normalized by the stoichiometric coefficient of both components of a two-protein complex are plotted against each other. Note, here both components of the complex are coded by a polycistronic transcript. The solid line is the identity line. Translation initiation rates were estimated using the Ribo-seq and RNA-seq data reported in (33) and (6), respectively.
Fig. 7
Fig. 7
Translation initiation rate for each of the components of eight different complexes are plotted against their stoichiometric coefficient (AH). All components of these complexes are encoded by a single polycistronic transcript. The red solid line is the best-fit line passing through the origin. Translation initiation rates were estimated using the Ribo-seq and RNA-seq data reported in (33) and (6), respectively.
Fig. 8
Fig. 8
The overall protein synthesis rate normalized by protein stoichiometry of the both subunits of two-component protein complexes are plotted against each other. Both subunits of these complexes are not coded by a single operon. The red solid line is the identity line. Translation initiation rates were estimated using the Ribo-seq and RNA-seq data reported in (33) and (6), respectively.

References

    1. Kim S., Yu N.-K., Kaang B.-K. Ctcf as a multifunctional protein in genome regulation and gene expression. Exp. Mol. Med. 2015;47:e166. - PMC - PubMed
    1. Schliwa M., Woehlke G. Molecular motors. Nature. 2003;422:759–765. - PubMed
    1. Martin G.S. Cell signaling and cancer. Cancer Cell. 2003;4:167–174. - PubMed
    1. Isaacs J.D., Jackson G.S., Altmann D.M. The role of the cellular prion protein in the immune system. Clin. Exp. Immunol. 2006;146:1–8. - PMC - PubMed
    1. Møller J.V., Juul B., le Maire M. Structural organization, ion transport, and energy transduction of p-type atpases. Biochim. Biophys. Acta. 1996;1286:1–51. - PubMed

LinkOut - more resources