. 2023 Sep 14;26(10):107915.
doi: 10.1016/j.isci.2023.107915. eCollection 2023 Oct 20.

Immunogenicity of COVID-19 vaccines and their effect on HIV reservoir in older people with HIV

Affiliations

Immunogenicity of COVID-19 vaccines and their effect on HIV reservoir in older people with HIV

Vitaliy A Matveev et al. iScience. .

Abstract

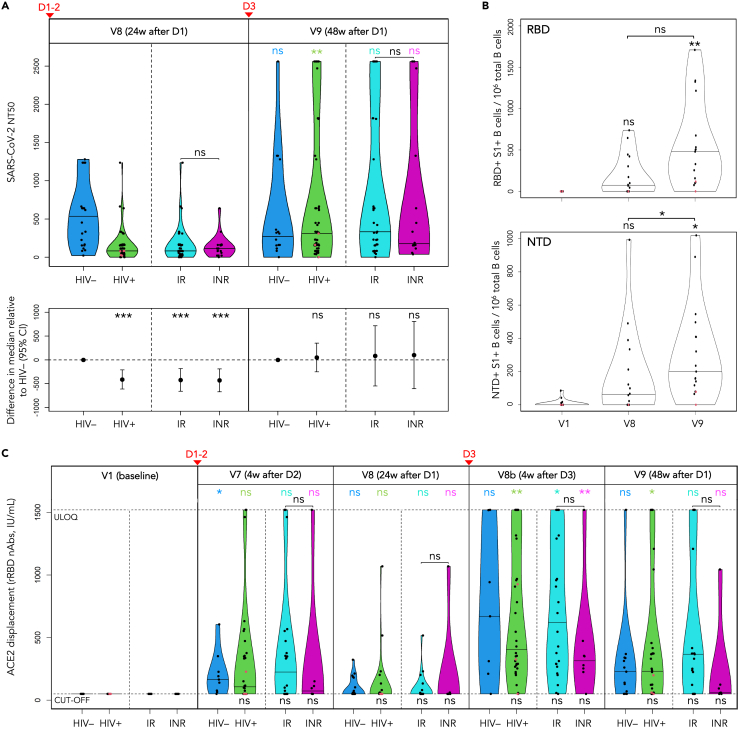
Older individuals and people with HIV (PWH) were prioritized for COVID-19 vaccination, yet comprehensive studies of the immunogenicity of these vaccines and their effects on HIV reservoirs are not available. Our study on 68 PWH and 23 HIV-negative participants aged 55 and older post-three vaccine doses showed equally strong anti-spike IgG responses in serum and saliva through week 48 from baseline, while PWH salivary IgA responses were low. PWH had diminished live-virus neutralization responses after two vaccine doses, which were 'rescued' post-booster. Spike-specific T cell immunity was enhanced in PWH with normal CD4+ T cell count, suggesting Th1 imprinting. The frequency of detectable HIV viremia increased post-vaccination, but vaccines did not affect the size of the HIV reservoir in most PWH, except those with low-level viremia. Thus, older PWH require three doses of COVID-19 vaccine for maximum protection, while individuals with unsuppressed viremia should be monitored for adverse reactions from HIV reservoirs.

Keywords: Immunology; Virology.


Conflict of interest statement

The authors declare no competing interests.

Figures

None
Graphical abstract
Figure 1
Figure 1
Study protocol, timeline, participants (A) HIV status of study participants. PWH: IR – immunological responders, INR – immunological non-responders, LLV – PWH with low-level viremia, LTNP – long-term non-progressors. See also Tables 1, S1. (B) Age distribution. See also Tables 1, S1. (C) The timeline showing study visits (in blue, gray, or green) and clinically administered COVID-19 vaccine doses D1-3 (red). See also Tables 1, S1, and S2.
Figure 2
Figure 2
Three doses of COVID-19 vaccines elicit equally high levels of serum anti-RBD IgG that increase with each dose The top panel shows a violin plot with medians for IgG concentrations (BAU/mL) in HIV (blue), total PWH (green), IRs (cyan), INRs (purple); N+ and/or post-COVID-19 samples are excluded. The bottom panel shows adjusted loge mean differences between PWH and HIV individuals, based on mixed effects linear regression. p values for loge mean differences between HIV+ and HIV samples at each timepoint are shown at the top of the bottom panel: p < 0.001 (∗∗∗), p < 0.01 (∗∗), p < 0.05 (∗), p ≥ 0.05 (ns = ‘not significant’). p values for within-group/subgroup changes from the preceding timepoint for each pair of adjacent timepoints are shown at the top of the top panel and are color-coded accordingly. p values for IR vs. INR differences are shown below each pair at the bottom of the top panel. The lower limit of detection, LLOD (3.02 BAU/mL), the upper limit of quantification, ULOQ (4,454 BAU/mL), and the seropositivity threshold (31 BAU/mL) are shown as dashed horizontal lines. LLV participants are shown as red dots. Vaccination timepoints (D1, D2, D3) are indicated with red arrowheads. See also Figure S1, Tables S3, S5, and S7.
Figure 3
Figure 3
PWH had lower SARS-CoV-2 nAb titers after two vaccine doses than HIV individuals, with responses ‘rescued’ by the booster (A) Live SARS-CoV-2 50% neutralization titers (NT50) in HIV individuals (blue), total PWH (green), IRs (cyan), INRs (purple); the horizontal bars show median titers. The bottom panel shows adjusted median differences between PWH and HIV participants at each timepoint (based on quantile regression), with p values shown at the top: p < 0.001 (∗∗∗), p < 0.01 (∗∗), p < 0.05 (∗), p ≥ 0.05 (ns). p values for within-group/subgroup changes from V8 to V9 are shown at the top of the top panel and are color-coded accordingly. Vaccination timepoints (D1-2, D3) are indicated with red arrowheads. See also Figure S2, Tables S9–S11. (A–C) LLV participants are shown as red dots. (B) Changes in frequency of RBD/NTD-specific B cells in selected PWH (n = 17) following COVID-19 vaccination expressed as the number of RBD+S1+ and NTD+S1+ B cells per 106 total B cells, based on spectral flow cytometry data. The horizontal bars show median frequencies. p values are based on quantile regression. See also Figures S2A and S2B, Table S12. (C) Changes in concentrations of anti-RBD nAbs in sera (IU/mL) following COVID-19 vaccination: in HIV participants (blue), total PWH (green), IRs (cyan), INRs (purple). The responses are measured with snELISA based on the ability of sera to displace rACE2 and analyzed by adjusted quantile regression. The horizontal bars show median concentrations; the neutralization cut-off (54.8 IU/mL) and ULOQ (1,520 IU/mL) are shown as dashed horizontal lines. p values for differences between PWH and HIV participants at each time point are shown at the bottom. p values for within-group/subgroup changes from the preceding timepoint for each pair of adjacent timepoints are shown at the top and are color-coded accordingly. Vaccination timepoints (D1-2, D3) are indicated with red arrowheads. See also Figure S2C, Tables S13 and S14.
Figure 4
Figure 4
Strong anti-spike IgG responses to three mRNA vaccine doses in saliva contrast with weak anti-spike IgA responses, with little effect from the booster on IgA Longitudinal changes in levels of spike-specific IgG (top) and IgA (bottom) Abs in saliva following COVID-19 vaccination in HIV participants (blue), total PWH (green), IRs (cyan), INRs (purple). The values are expressed as %AUC (percentage of the area under the curve of the positive control of acute and convalescent COVID-19 samples whose average response is plotted as 100% and marked with black horizontal dashed lines); the horizontal bars show median responses. p values for differences between PWH and HIV participants, and those between IRs and INRs, are based on Wilcoxon rank-sum test and are shown below their respective violin plots or above each IR/INR pair: p < 0.001 (∗∗∗), p < 0.01 (∗∗), p < 0.05 (∗), p ≥ 0.05 (ns). p values for within-group/subgroup changes from the preceding timepoint for each pair of adjacent timepoints are shown at the top of each panel and are color-coded accordingly (based on quantile regression). LLV participants are shown as red dots. Seropositivity thresholds, 0.35%AUC for IgG and 4.06%AUC for IgA, are shown as red dashed lines. Vaccination timepoints (D1, D2, D3) are indicated with red arrowheads. See also Tables S15–S18.
Figure 5
Figure 5
IRs mount strong T cell responses to two and three vaccine doses, outperforming HIV individuals, while INRs show modest responses Changes in anti-spike T cell responses in HIV participants (blue), total PWH (green), IRs (cyan), and INRs (purple) following COVID-19 vaccination are determined with ELISpot as frequencies of cells secreting IFN-γ (top), IL-2 (middle) or both (‘Dual’, bottom) in response to stimulation with SARS-CoV-2 spike peptide pool and expressed as spot-forming cells (SFC) per 106 PBMC. The horizontal bars show median frequencies. p values for differences between PWH and HIV participants, and those between IRs and INRs, are based on Wilcoxon rank-sum test and are shown below their respective violin plots or above each IR/INR pair: p < 0.001 (∗∗∗), p < 0.01 (∗∗), p < 0.05 (∗), p ≥ 0.05 (ns). p values for within-group/subgroup changes from the preceding timepoint for each pair of adjacent timepoints are shown at the top of each panel and are color-coded accordingly (based on quantile regression). LLV participants are shown as red dots. Vaccination timepoints (D1-2, D3) are indicated with red arrowheads. See also Tables S19 and S20.
Figure 6
Figure 6
The size of intact HIV reservoir in peripheral CD4+ T cells does not increase after three COVID-19 vaccine doses, with a possible exception of PWH with unsuppressed viremia The violin plot (left) shows IPDA-derived frequencies of intact HIV proviruses (with medians) per 106 CD4+ T cells analyzed by quantile regression. The dots representing the same person are connected, and LLV participants are shown in red; ns = ‘not significant’ (p ≥ 0.05). Vaccination timepoints (D1-2, D3) are indicated with red arrowheads. IPDA values for LLV participants on the original scale. See also Table S21.
Figure 7
Figure 7
Longitudinal modelling of humoral spike/RBD-specific IgG responses (A) Serum anti-spike IgG longitudinal model (Equation 1d) mean fit prediction as a function of HIV status. Solid lines show IgG dynamics from the primary COVID-19 vaccine series (D1-2) and booster (D3). Dashed lines extend the trend in IgG decay from D1-2. (B and C) Model-predicted spike IgG production rates, μAspike (B), and decay rates, γAspike (C). For (A–C), see also Figures 9, S8, Tables S4, S6, S8, and S27. The lower error bars for the IQR boxplots with medians are computed by Q1 (25th percentile) multiplied by 1.5 times the IQR, and the top bar is Q3 (75th percentile) multiplied by 1.5 times the IQR. (D) Serum anti-RBD IgG longitudinal model (Equation 1e) mean fit prediction as a function of HIV status. Also see Figure S8. Model predictions for PWH and HIV-negative participants in (A) and (D) are similar; both are shown as equivalent and near-overlapping time-dependent trends. The error bars are computed as in (B and C). (E and F) Model-predicted RBD IgG production rates, μARBD (E), and decay rates, γARBD (F). For (D–F), see also Figures 9, S8, Tables S3, S5, S7, S27. (G) Longitudinal model (Equations 1f and 1g) mean fit predictions for RBD+S1+ and NTD+S1+ B cells, respectively, in PWH. Shaded regions illustrate the range in dosage time intervals where the B cell data were measured. See also Figure 9. (H) A boxplot of individual model-predicted production rates for spike-specific B cells. The error bars are computed as in (B, C, E, and F).
Figure 8
Figure 8
Longitudinal modelling of cytokine responses in T cells (A-B) Longitudinal model (Equations 1g and 1h) mean fit predictions for anti-spike cytokine T cell responses as a function of HIV status. Shaded regions are the dosage time intervals across all individuals. Panels (A) and (B) are IFN-γ (Equation 1g), and IL-2 (Equation 1h) three-dose predictions as a function of days since COVID-19 vaccine D1, respectively. (C-D) Boxplots of production rate model estimates sorted by HIV status for IFN-γ (C) and IL-2 (D). For (A-D), see also Figures 9, S8, Table S28. The lower error bars for the IQR boxplots with medians are computed by Q1 (25th percentile) multiplied by 1.5 times the IQR, and the top bar is Q3 (75th percentile) multiplied by 1.5 times the IQR.
Figure 9
Figure 9
Vaccination model for within-host immunization A schematic diagram of COVID-19 vaccine inoculation, T cell stimulation, cytokine, IgG, and spike-specific B cell production model ((Equation 1a), (Equation 1b), (Equation 1c), (Equation 1d), (Equation 1e), (Equation 1f), (Equation 1g), (Equation 1h), (Equation 1i)).

Update of

References

    1. Tesoriero J.M., Swain C.A.E., Pierce J.L., Zamboni L., Wu M., Holtgrave D.R., Gonzalez C.J., Udo T., Morne J.E., Hart-Malloy R., et al. COVID-19 Outcomes Among Persons Living With or Without Diagnosed HIV Infection in New York State. JAMA Netw. Open. 2021;4 doi: 10.1001/jamanetworkopen.2020.37069. - DOI - PMC - PubMed
    1. Western Cape Department of Health in collaboration with the National Institute for Communicable Diseases South Africa. Davies M.-A., Hussey H., Ismail M., Morden E., Vundle Z., Zweigenthal V. Risk Factors for Coronavirus Disease 2019 (COVID-19) Death in a Population Cohort Study from the Western Cape Province, South Africa. Clin. Infect. Dis. 2021;73:e2005–e2015. doi: 10.1093/cid/ciaa1198. - DOI - PMC - PubMed
    1. Bhaskaran K., Rentsch C.T., MacKenna B., Schultze A., Mehrkar A., Bates C.J., Eggo R.M., Morton C.E., Bacon S.C.J., Inglesby P., et al. HIV infection and COVID-19 death: a population-based cohort analysis of UK primary care data and linked national death registrations within the OpenSAFELY platform. Lancet. HIV. 2021;8:e24–e32. doi: 10.1016/S2352-3018(20)30305-2. - DOI - PMC - PubMed
    1. Sigel K., Swartz T., Golden E., Paranjpe I., Somani S., Richter F., De Freitas J.K., Miotto R., Zhao S., Polak P., et al. Coronavirus 2019 and People Living With Human Immunodeficiency Virus: Outcomes for Hospitalized Patients in New York City. Clin. Infect. Dis. 2020;71:2933–2938. doi: 10.1093/cid/ciaa880. - DOI - PMC - PubMed
    1. Hoffmann C., Casado J.L., Härter G., Vizcarra P., Moreno A., Cattaneo D., Meraviglia P., Spinner C.D., Schabaz F., Grunwald S., Gervasoni C. Immune deficiency is a risk factor for severe COVID-19 in people living with HIV. HIV Med. 2021;22:372–378. doi: 10.1111/hiv.13037. - DOI - PubMed