[Preprint]. 2023 Sep 21:2023.09.21.558834.
doi: 10.1101/2023.09.21.558834.

Identification and targeting of microbial putrescine acetylation in bloodstream infections

Affiliations

Identification and targeting of microbial putrescine acetylation in bloodstream infections

Jared R Mayers et al. bioRxiv. .

Abstract

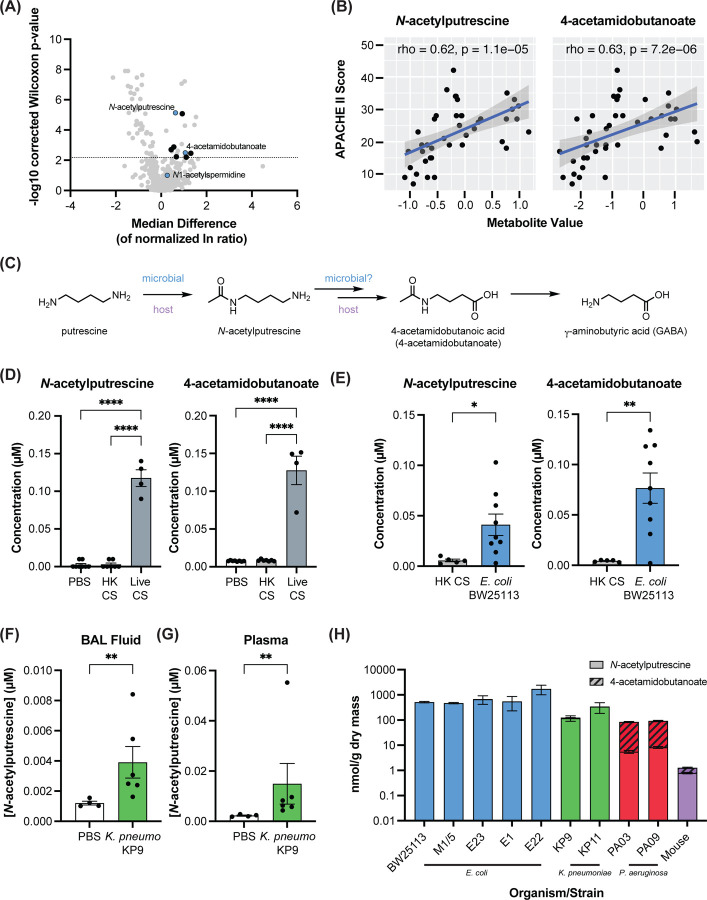
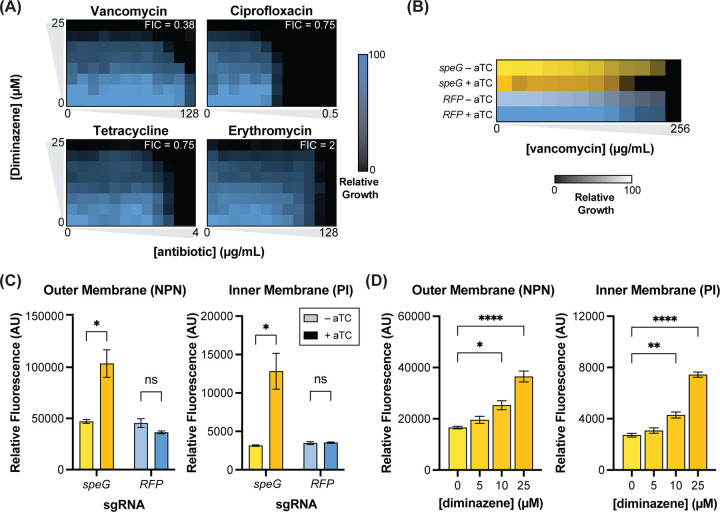
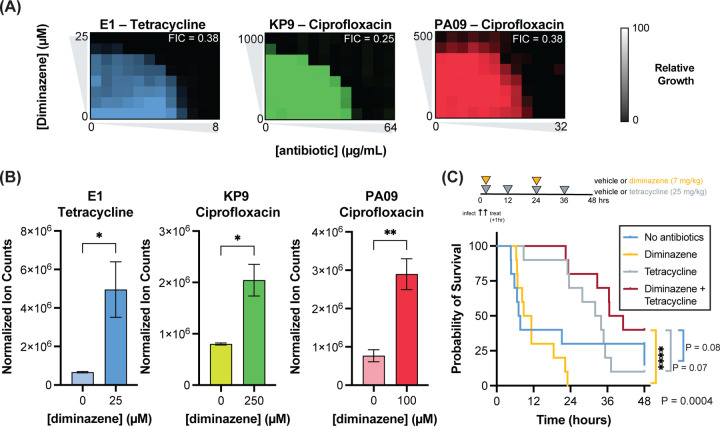
The growth of antimicrobial resistance (AMR) has highlighted an urgent need to identify bacterial pathogenic functions that may be targets for clinical intervention. Although severe bacterial infections profoundly alter host metabolism, prior studies have largely ignored alterations in microbial metabolism in this context. Performing metabolomics on patient and mouse plasma samples, we identify elevated levels of bacterially-derived N-acetylputrescine during gram-negative bloodstream infections (BSI), with higher levels associated with worse clinical outcomes. We discover that SpeG is the bacterial enzyme responsible for acetylating putrescine and show that blocking its activity reduces bacterial proliferation and slows pathogenesis. Reduction of SpeG activity enhances bacterial membrane permeability and results in increased intracellular accumulation of antibiotics, allowing us to overcome AMR of clinical isolates both in culture and in vivo. This study highlights how studying pathogen metabolism in the natural context of infection can reveal new therapeutic strategies for addressing challenging infections.

Keywords: Metabolomics; N-acetylputrescine; antibiotic resistance; polyamine/diamine acetyltransferase; polyamines; sepsis.


Conflict of interest statement

DECLARATION OF INTERESTS The authors declare no competing interests.

Figures

Figure 1.
Figure 1.. Putrescine metabolites are elevated in humans with gram-negative septic shock and mouse models of sepsis and are produced by bacteria
(A) Volcano plot highlighting significant elevations in N-acetylputrescine and 4-acetamidobutanoate in humans with gram-negative septic shock (B) N-acetylpturescine and 4-acetomidobutanoate levels correlate with worse clinical outcomes as measured by APACHE II scores (C) Putrescine metabolic pathway outlining production of N-acetylputrescine and 4-acetamidobutanoate (D) Putrescine metabolites are elevated in the mouse cecal slurry model of septic shock/BSI; HK = heat killed, CS = cecal slurry; n = 8 PBS, n = 7 HK CS, n = 4 Live CS; p-values were determined by One-way ANOVA followed by Tukey’s multiple comparisons test (E) Septic shock/BSI with heat-killed cecal slurry rescued with E. coli BW25113 results in increased plasma putrescine metabolite levels; n = 5 HK CS, n = 9 HK CS + E. coli BW25113; Two-tailed p-values were determined by unpaired t test (F) Klebsiella pneumoniae pneumonia results in increased bronchial alveolar lavage (BAL) fluid levels of N-acetylputrescine; n = 4 PBS, n = 6 K. pneumoniae (KP9); Two-tailed p-values were determined by Mann Whitney test to include the outlier. (G) Klebsiella pneumoniae pneumonia results in increased plasma levels of N-acetylputrescine; n = 4 PBS, n = 6 K. pneumoniae (KP9); Two-tailed p-values were determined by Mann Whitney test to include the outlier. (H) Bacterial and mouse production of N-acetylputrescine + 4-acetamidobutanoate from putrescine; n = 3 for bacteria, representative data from 1–3 independent repeats; n = 6 mice; Blue = E. coli, Green = K. pneumoniae, Red = P. aeruginosa For all panels, data presented are means ± SEM; *p < 0.05; **p < 0.01; ***p < 0.001; ****p<0.0001
Figure 2.
Figure 2.. SpeG homologs are responsible for production of N-acetylputrescine in gram-negative pathogens
(A) Complementation in E. coli BW25113 demonstrates SpeG can produce N-acetylputrescine; n = 3 per condition, representative data from 3 independent experiments (B) 1 hour production of N-acetylputrescine from putrescine by recombinant purified enzymes; n = 3 per condition, representative data from 3 independent experiments; NE = no enzyme, GFP = green fluorescent protein (C) Kinetics of putrescine acetylation by SpeG is consistent with previously demonstrated cooperative mechanism on spermidine, n = 2–3 per substrate concentration, representative data from 4 independent experiments; summary parameters includes all experiments (D) Maximum-likelihood phylogenetic tree of a representative member of each group of protein sequences sharing >80% amino acid ID (RepNode80); Blue = E. coli SpeG clade, Purple = mammalian SAT1 clade, Turquoise = B. subtilis BltD clade (E) Complementation in E. coli BW25113 demonstrates PA1472 can produce N-acetylputrescine; n = 3 per condition, representative data from 2–3 independent experiments (F) 1 hour production of N-acetylputrescine from putrescine by recombinant purified enzymes; n = 3 per condition, representative data from 2–3 independent experiments; NE = no enzyme, GFP = green fluorescent protein (G) Kinetics of PA1472 on putrescine; n = 2 per concentration, representative data from 3 independent experiments; summary parameters includes all experiments (H) SpeG (PDB: 3WR7) and PA1472 (AlphaFold2) dimers For all panels, data presented are means ± SEM
Figure 3.
Figure 3.. Suppression of speG expression impacts proliferation
(A) Suppression of speG expression with inducible CRISPRi in E. coli patient bloodstream isolate E23; n = 3 per condition, representative data from 2 independent experiments (B) Decreased levels of extracellular N-acetylputrescine with inducible CRISPRi of speG in E23, concentrations normalized to OD600 = 1.0; n = 3 per condition, representative data from 2 independent experiments (C) Increased relative intracellular putrescine levels (concentrations normalized to OD600 = 1.0 and then normalized to concentration of control condition) and decreased ratio of N-acetylputrescine/putrescine with inducible CRISPRi of speG in E23; n = 3 per condition, representative data from 2 independent experiments (D) Inducible CRISPRi of speG suppresses E23 growth in culture; n = 3 per condition, representative data from 3 independent experiments (E) Inducible CRISPRi of speG delays mortality in a cecal slurry model of sepsis with E23; n = 10 mice per group for all groups except n = 9 for RFP – aTC; p-value determined by Log-rank (Mantel-Cox) test For panels A-D, data presented are means ± SEM; Two-tailed p-values were determined by unpaired t test; *p < 0.05; **p < 0.01; ***p < 0.001; ****p<0.0001 aTC = anhydrotetracycline
Figure 4.
Figure 4.. Diminazene inhibits SpeG and phenocopies inducible CRISPRi
(A) Structures of spermidine and diminazene (B) Determination of in vitro IC50 of diminazene against speG with putrescine substrate; n = 2 per inhibitor concentration, representative data from 3 independent experiments; summary data includes all experiments (C) Diminazene treatment reduces extracellular levels of N-acetylputrescine in E23, concentrations normalized to OD600 = 1.0; n = 3 per condition, representative data from 3 independent experiments; p-values were determined by One-way ANOVA followed by Dunnett’s multiple comparisons test with all comparisons made against no drug control (D) Diminazene treatment increases relative intracellular putrescine levels (concentrations normalized to OD600 = 1.0 and then normalized to concentration of control, 0 µM) condition) and decreases the ratio of N-acetylputrescine in E23; n = 3 per condition, p-values were determined by One-way ANOVA followed by Dunnett’s multiple comparisons test with all comparisons made against no drug control (E) MIC90 of diminazene treated E23, M 1/5, and BW25113 in LB; n = 3 per condition, representative data from 3 independent experiments; summary data includes all experiments (F) Inducible CRISPRi of speG blocks growth inhibition by diminazene in E23; n = 3 per condition, representative data from 2 independent experiments; Two-tailed p-values were determined by unpaired t test For all panels, data presented are means ± SEM; *p < 0.05; **p < 0.01; ***p < 0.001; ****p<0.0001 aTC = anhydrotetracycline
Figure 5.
Figure 5.. Reducing SpeG activity enhances membrane permeability.
(A) Checkerboard assays demonstrate synergy between diminazene and vancomycin in E. coli E23; representative data from 3 independent experiments (B) Inducible CRISPRi of speG reduces MIC of vancomycin in E. coli E23; mean growth of n = 3 per condition, representative data from 3 independent experiments (C) Inducible CRISPRi of speG enhances membrane permeability in E23; n = 3 per condition, representative data from 2 independent experiments; Two-tailed p-values were determined by unpaired t test (D) Diminazene treatment for 6 hours enhances membrane permeability in E. coli E23; n = 3 per condition, representative data from 2 independent experiments; p-values were determined by One-way ANOVA followed by Dunnett’s multiple comparisons test with all comparisons made against no drug control For panels B-D, data presented are means ± SEM; *p < 0.05; **p < 0.01; ***p < 0.001; ****p<0.0001 aTC = anhydrotetracycline
Figure 6.
Figure 6.. Blocking SpeG synergizes with existing clinical antibiotics in resistant bacteria in culture and in vivo
(A) Checkerboard assays demonstrate synergy between diminazene and antibiotics to which the assayed MDR strains are clinically resistant; representative data from 3–4 independent experiments per strain (B) Diminazene treatment enhances uptake of antibiotics to which MDR strains are resistant; n = 3 per condition, representative data from 1–3 independent experiments; Two-tailed p-values were determined by unpaired t test (C) Combination of diminazene and tetracycline treatment reduces mortality in a cecal slurry model of sepsis with the tetracycline resistant clinical isolate E. coli E1; n = 10 mice per group; p-value determined by Log-rank (Mantel-Cox) test For panels B, data presented are means ± SEM; *p < 0.05; **p < 0.01; ***p < 0.001; ****p<0.0001 aTC = anhydrotetracycline

References

    1. Murray C. J. et al. Global burden of bacterial antimicrobial resistance in 2019: a systematic analysis. Lancet, 629–655 (2022). - PMC - PubMed
    1. O’Neill J. Tackling Drug-Resistant Infections Globally: Final Report and Recommendations. The Review on Antimicrobial Resistance (2016).
    1. Rawson T. M. et al. Bacterial and Fungal Coinfection in Individuals With Coronavirus: A Rapid Review To Support COVID-19 Antimicrobial Prescribing. Clin Infect Dis 71, 2459–2468 (2020). https://doi.org: 10.1093/cid/ciaa530 - DOI - PMC - PubMed
    1. Ventola C. L. The antibiotic resistance crisis: part 1: causes and threats. P T 40, 277–283 (2015). - PMC - PubMed
    1. Chen N. et al. Epidemiological and clinical characteristics of 99 cases of 2019 novel coronavirus pneumonia in Wuhan, China: a descriptive study. Lancet 395, 507–513 (2020). https://doi.org: 10.1016/S0140-6736(20)30211-7 - DOI - PMC - PubMed

Publication types