[Preprint]. 2023 Sep 15:rs.3.rs-3193270.
doi: 10.21203/rs.3.rs-3193270/v1.

Prediction of cancer treatment response from histopathology images through imputed transcriptomics

Affiliations

Prediction of cancer treatment response from histopathology images through imputed transcriptomics

Danh-Tai Hoang et al. Res Sq. .

Update in

Abstract

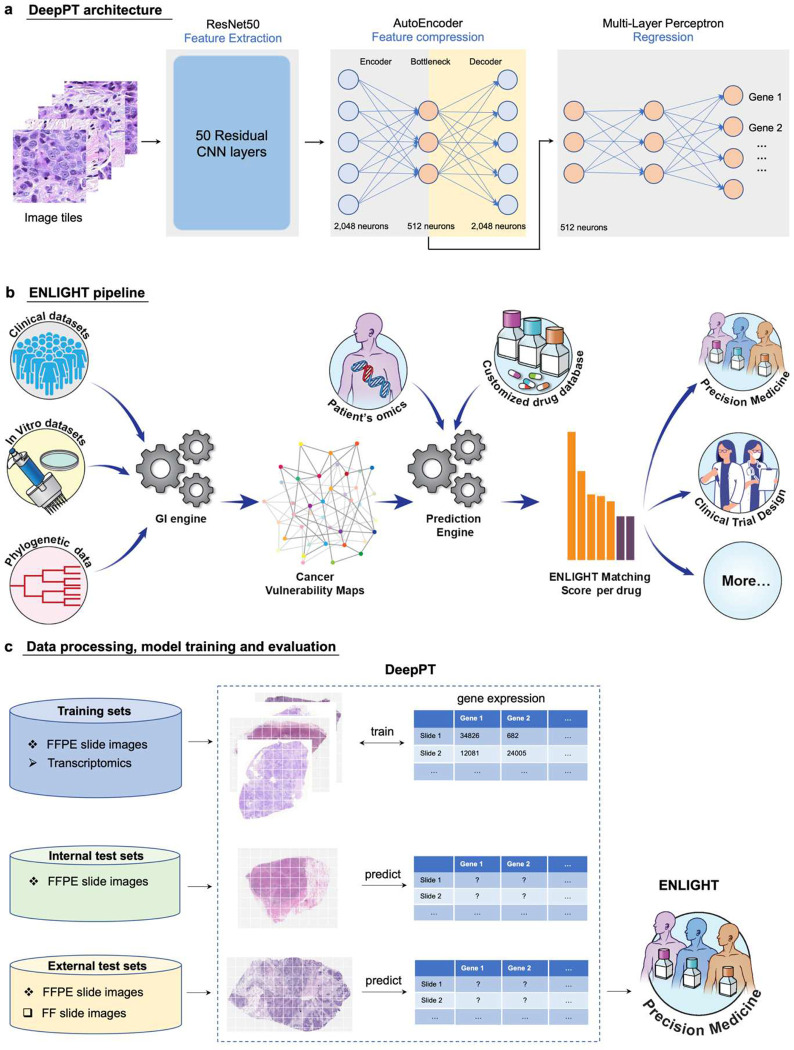
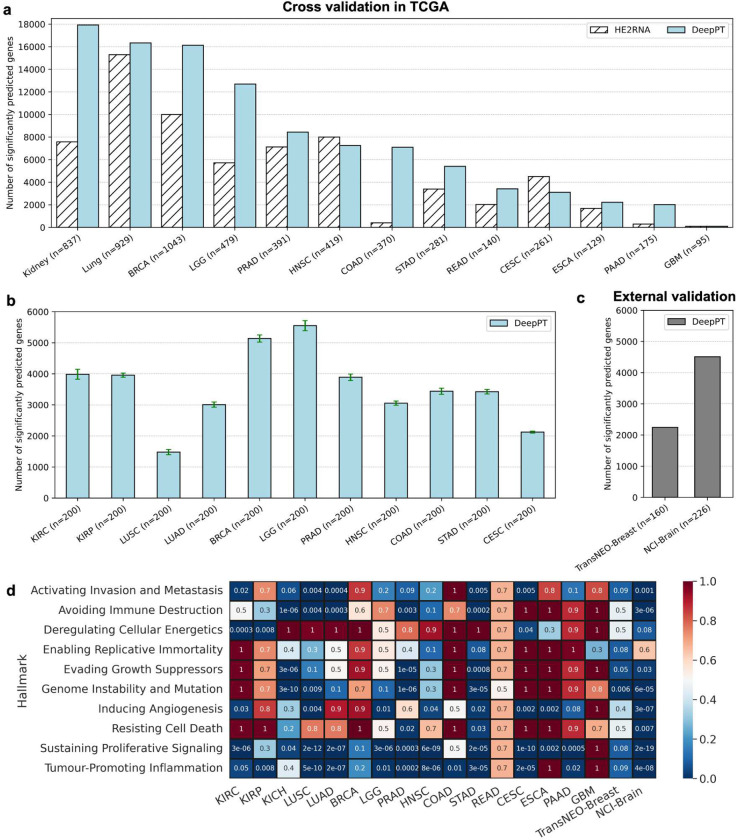
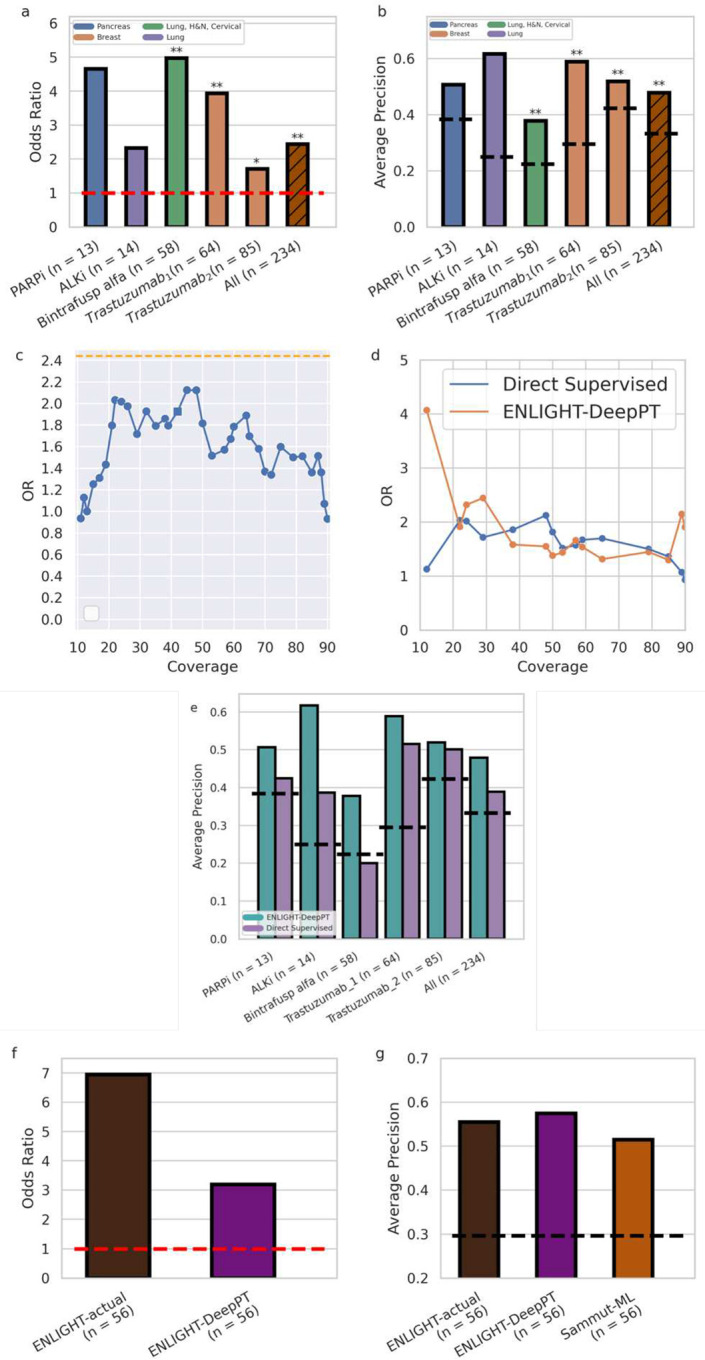
Advances in artificial intelligence have paved the way for leveraging hematoxylin and eosin (H&E)-stained tumor slides for precision oncology. We present ENLIGHT-DeepPT, an approach for predicting response to multiple targeted and immunotherapies from H&E-slides. In difference from existing approaches that aim to predict treatment response directly from the slides, ENLIGHT-DeepPT is an indirect two-step approach consisting of (1) DeepPT, a new deep-learning framework that predicts genome-wide tumor mRNA expression from slides, and (2) ENLIGHT, which predicts response based on the DeepPT inferred expression values. DeepPT successfully predicts transcriptomics in all 16 TCGA cohorts tested and generalizes well to two independent datasets. Our key contribution is showing that ENLIGHT-DeepPT successfully predicts true responders in five independent patients' cohorts involving four different treatments spanning six cancer types with an overall odds ratio of 2.44, increasing the baseline response rate by 43.47% among predicted responders, without the need for any treatment data for training. Furthermore, its prediction accuracy on these datasets is comparable to a supervised approach predicting the response directly from the images, which needs to be trained and tested on the same cohort. ENLIGHT-DeepPT future application could provide clinicians with rapid treatment recommendations to an array of different therapies and importantly, may contribute to advancing precision oncology in developing countries.


Conflict of interest statement

Declaration of interests G.D, D.S.B, E.E, T.B, and R.A are employees of Pangea Biomed. E.R. is a co-founder of Medaware, Metabomed, and Pangea Biomed (divested from the latter). E.R. serves as a non-paid scientific consultant to Pangea Biomed under a collaboration agreement between Pangea Biomed and the NCI.

Figures

Figure 1.
Figure 1.. Study overview.
(a) The three main components of DeepPT architecture, from left to right. The pre-trained ResNet50 CNN unit extracts histopathology features from tile images. The autoencoder compresses the 2,048 features to a lower dimension of 512 features. The multi-layer perceptron integrates these histopathology features to predict the sample’s gene expression. (b) An overview of the ENLIGHT pipeline (illustration taken from [44]: ENLIGHT starts by inferring the genetic interaction partners of a given drug from various cancer in-vitro and clinical data sources. Given the SL and SR partners and the transcriptomics for a given patient sample, ENLIGHT computes a drug matching score that is used to predict the patient response. Here, ENLIGHT uses DeepPT predicted expression to produce drug matching scores for each patient studied. (c) Overview of the Analysis employing DeepPT and ENLIGHT: (i) top row: DeepPT was trained with formalin-fixed paraffin-embedded (FFPE) slide images and matched transcriptomics for an array of different cancer types from the TCGA. (ii) Middle row: After the training phase, the models were applied to predict gene expression on the internal (held-out) TCGA datasets and on two external datasets on which they were never trained. (iii) Bottom row: The predicted tumor transcriptomics in each five independent test clinical datasets serves as input to ENLIGHT for predicting the patients’ response to treatment and assessing the overall prediction accuracy.
Figure 2.
Figure 2.. DeepPT prediction of gene expression from H&E slides.
(a) The number of significantly predicted genes for each TCGA cohort, in comparison with the current state-of-the-art method, HE2RNA. For apples-to-apples comparison against HE2RNA, the performance of each cancer subtypes in Kidney (KIRC, KIRP, KICH) and Lung (LUSC, LUAD) are shown together, as reported in [41]. (b) The number of significantly predicted genes, averaging over 30 randomly selected subsets. Each subset comprises 200 samples that were randomly selected from the cohort. Only cohorts with at least 200 samples were analyzed. Error bars represent standard error of the mean. (c) The number of significantly predicted genes in two independent test cohorts, obtained by using pre-trained models on the corresponding TCGA cohorts. (d) Pathway enrichment analysis on the significantly predicted genes. Each row represents a different cancer hallmark and each column a different cohort (the two right columns correspond to the two external cohorts). Values denote the multiple hypothesis corrected p-value for pathway enrichment among the genes significantly predicted by DeepPT.
Figure 3.
Figure 3.
Comparison of the correlation of survival association in terms of log(HR) for three proliferation signatures (left: MK67; middle: Proliferation index; right: EMT pathway) based on actual (X axis) and predicted expressions (Y axis). Each point represents a different TCGA cohort, and points are color-coded according to the significance of survival association using a corrected p < 0.05 cutoff: green denotes that the survival association was significant by both the actual and predicted signatures, red/black only by the actual/predicted signatures, respectively. Pearson R and corresponding p-values are denoted in each panel.
Figure 4.
Figure 4.. Predicting treatment response from H&E slides.
(a) Odds Ratio (OR, Y axis) for the five datasets tested and the aggregate cohort of all patients together (X axis). Drug and sample sizes are denoted in the X axis labels. Orange horizontal dashed line denotes an OR of 1 which is expected by chance. Bars are color coded according to the indication(s) of the respective cohort. Asterisks denote significance of OR being larger than 1 according to Fisher’s exact test (b) Average Precision (AP, Y axis) for the five datasets and the aggregate cohort, as in a. Black horizontal dashed lines denote the ORR for each dataset. An AP higher than the ORR demonstrates better accuracy than expected by chance. Asterisks denote significance of AP being higher than response rate using one-sided proportion test. (c) OR of the Direct Supervised method (Y axis) for all 234 patients as a function of the fraction of patients above a given threshold (coverage, X axis). We present only coverage between 10–90% to avoid the measurement noise of extreme coverage values, where data is too small. Orange dashed line denotes the OR of ENLIGHT-DeepPT for all 234 patients at its original clinical decision threshold. The square denotes the threshold on the Direct Supervised that yields the same coverage as ENLIGHT-DeepPT at its original, fixed threshold. (d) Comparison of the OR of ENLIGHT-DeepPT and the Direct Supervised methods (Y axis) at thresholds that yield the same coverage (X axis). (e) Average Precision of ENLIGHT-DeepPT (cyan) and Direct Supervised (purple) for each dataset and on aggregate as in b. Dashed lines denote the ORR for each case as in b (f) OR for ENLIGHT-actual and ENLIGHT-DeepPT when predicting response to Trastuzumab (for the Trastuzumab1 cohort). (g) Comparison of AP (Y axis) for both ENLIGHT based models and the Sammut-ML predictor of Sammut et al. [47]. All methods were applied to the same patient group. Black horizontal dashed line denotes the ORR. All p-values were FDR corrected. * = p < 0.1, ** = p < 0.05.

References

    1. Golub TR, Slonim DK, Tamayo P, Huard C, Gaasenbeek M, Mesirov JP, et al. Molecular classification of cancer: class discovery and class prediction by gene expression monitoring. Science. 1999;286: 531–537. - PubMed
    1. Curtis C, Shah SP, Chin S-F, Turashvili G, Rueda OM, Dunning MJ, et al. The genomic and transcriptomic architecture of 2,000 breast tumours reveals novel subgroups. Nature. 2012;486: 346–352. - PMC - PubMed
    1. Doroshow DB, Doroshow JH. Genomics and the History of Precision Oncology. Surg Oncol Clin N Am. 2020;29: 35–49. - PMC - PubMed
    1. Rosenthal J, Carelli R, Omar M, Brundage D, Halbert E, Nyman J, et al. Building Tools for Machine Learning and Artificial Intelligence in Cancer Research: Best Practices and a Case Study with the PathML Toolkit for Computational Pathology. Mol Cancer Res. 2022;20: 202–206. - PMC - PubMed
    1. Ström P, Kartasalo K, Olsson H, Solorzano L, Delahunt B, Berney DM, et al. Artificial intelligence for diagnosis and grading of prostate cancer in biopsies: a population-based, diagnostic study. Lancet Oncol. 2020;21: 222–232. - PubMed

Publication types