[Preprint]. 2023 Sep 18:rs.3.rs-3294233.
doi: 10.21203/rs.3.rs-3294233/v1.

Common and divergent gene regulatory networks control injury-induced and developmental neurogenesis in zebrafish retina

Affiliations

Common and divergent gene regulatory networks control injury-induced and developmental neurogenesis in zebrafish retina

Seth Blackshaw et al. Res Sq. .

Update in

Abstract

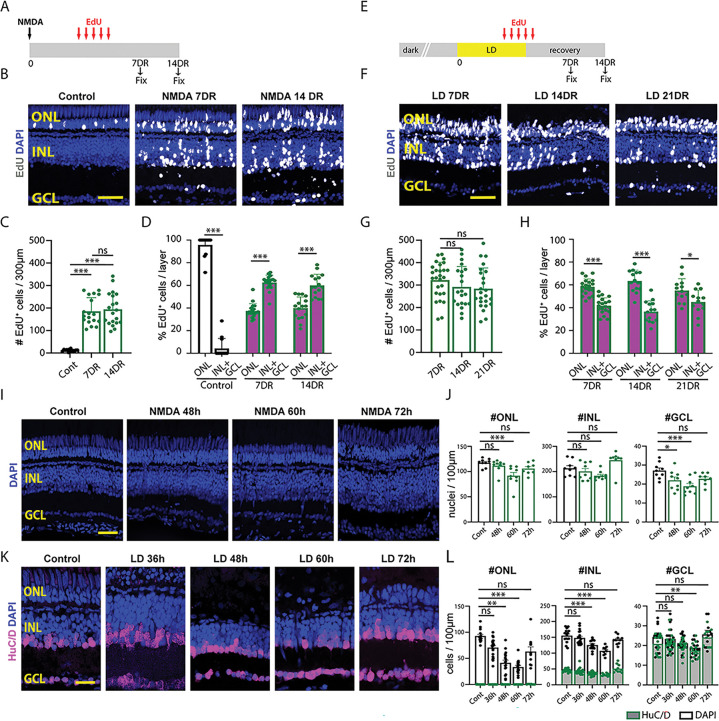
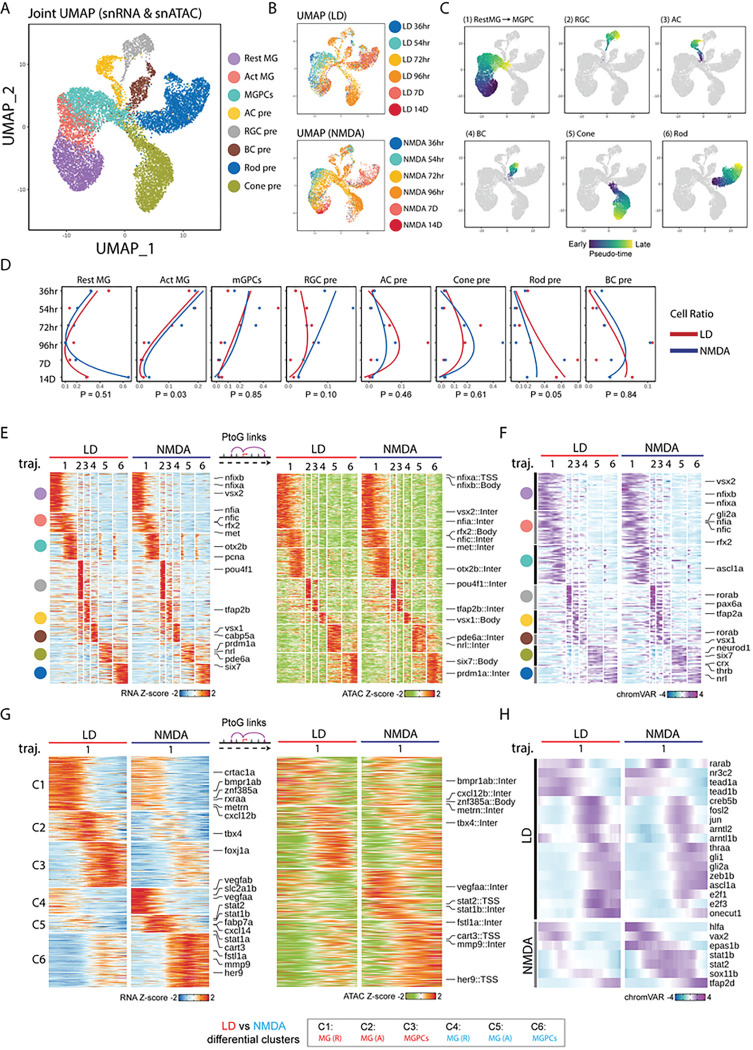
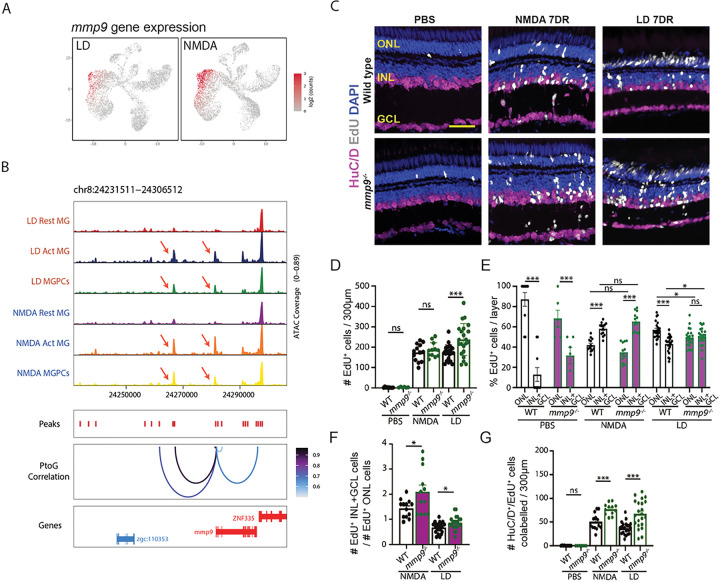
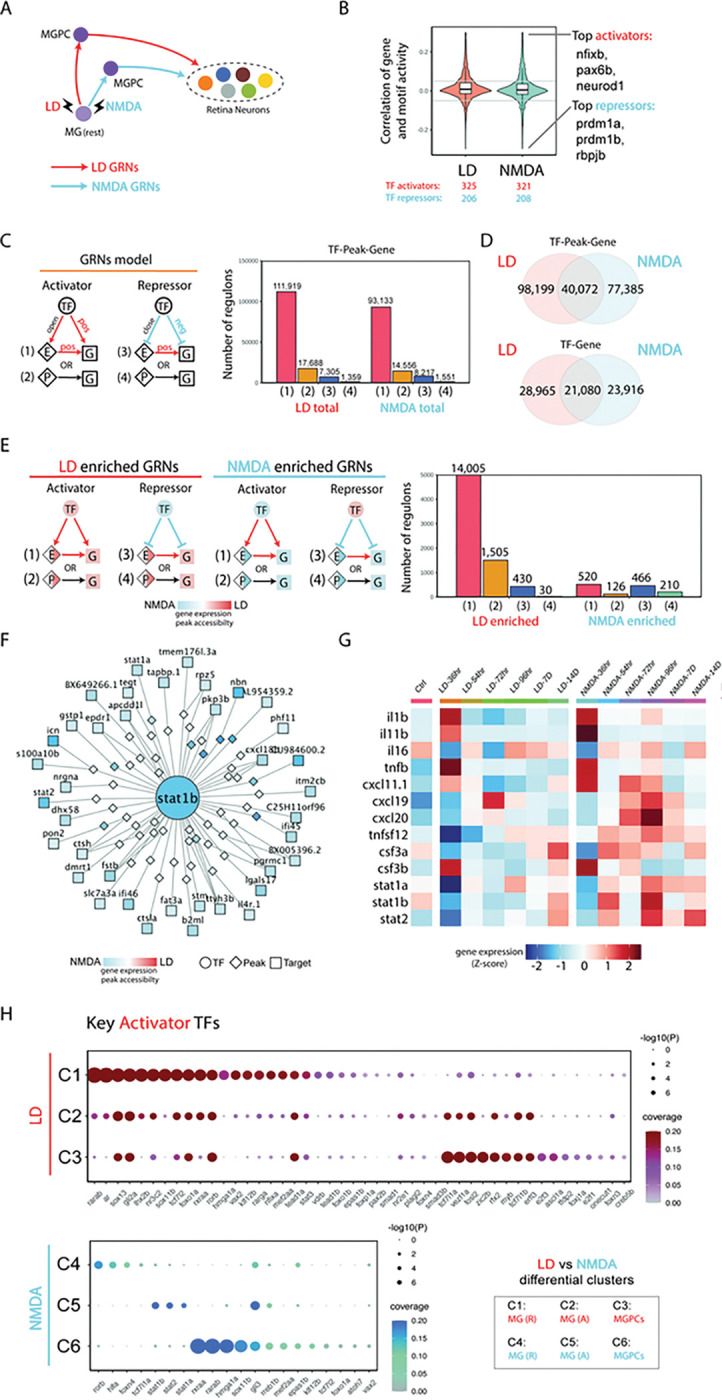
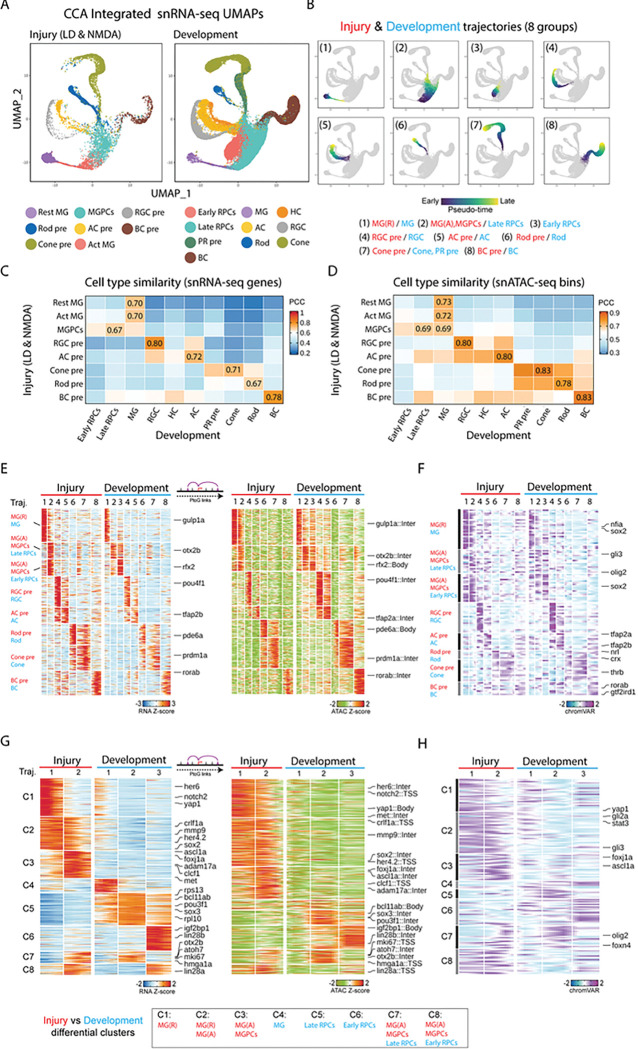
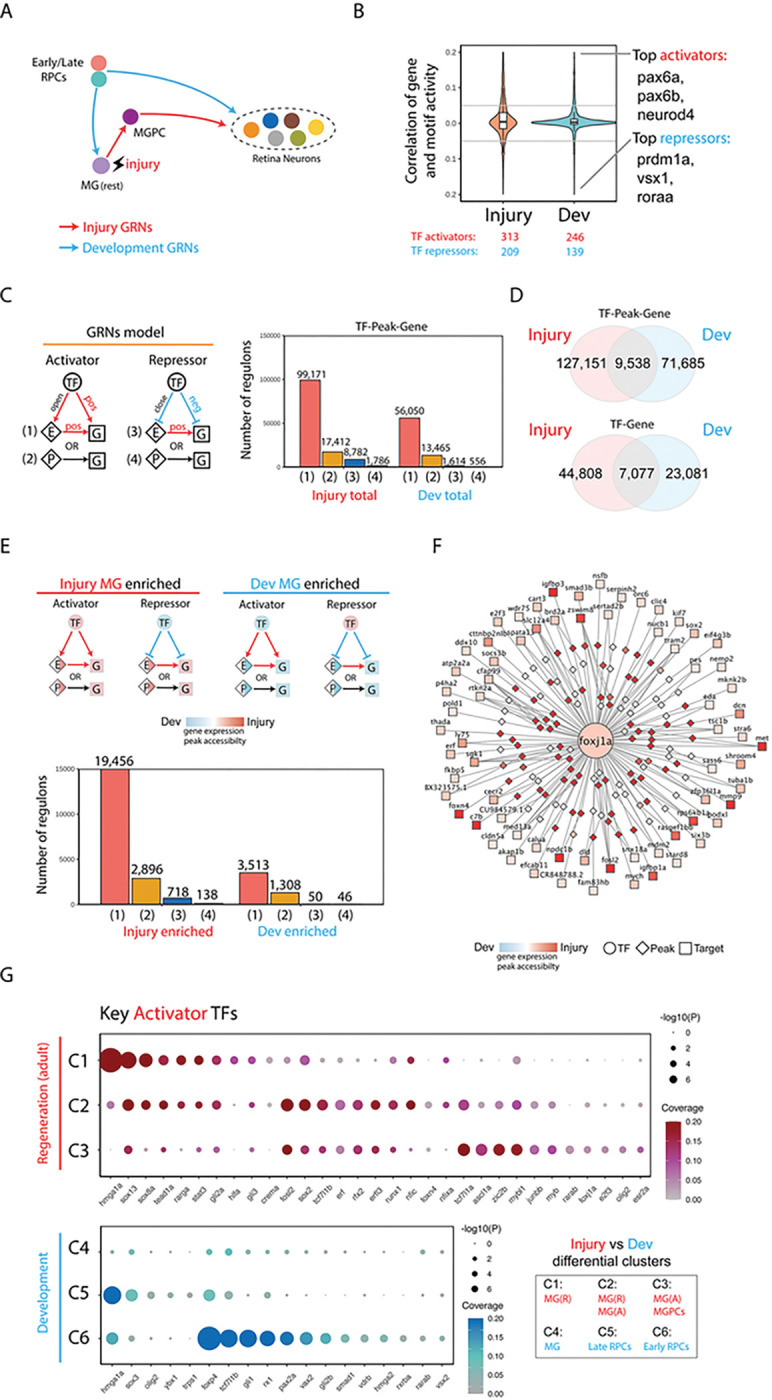
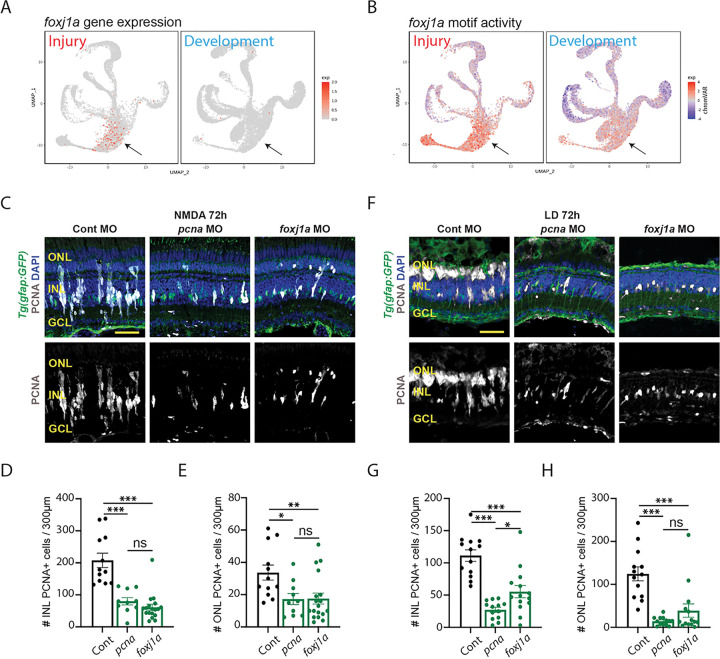
Following acute retinal damage, zebrafish possess the ability to regenerate all neuronal subtypes. This regeneration requires Müller glia (MG) to reprogram and divide asymmetrically to produce a multipotent Müller glia-derived neuronal progenitor cell (MGPC). This raises three key questions. First, does loss of different retinal cell subtypes induce unique MG regeneration responses? Second, do MG reprogram to a developmental retinal progenitor cell state? And finally, to what extent does regeneration recapitulate retinal development? We examined these questions by performing single-nuclear and single-cell RNA-Seq and ATAC-Seq in both developing and regenerating retinas. While MG reprogram to a state similar to late-stage retinal progenitors in developing retinas, there are transcriptional differences between reprogrammed MG/MGPCs and late progenitors, as well as reprogrammed MG in outer and inner retinal damage models. Validation of candidate genes confirmed that loss of different subtypes induces differences in transcription factor gene expression and regeneration outcomes. This work identifies major differences between gene regulatory networks activated following the selective loss of different subtypes of retina neurons, as well as between retinal regeneration and development.


Conflict of interest statement

STATEMENT OF INTERESTS: S.B. co-founded, and is a shareholder of, CDI Labs LLC..

Figures

Figure 1:
Figure 1:. Comparison of NMDA-induced and light-induced retinal damage.
(A) Schematic of NMDA-induced damage experiment. (B) EdU-labeling in control retinas and following NMDA damage. (C) Quantification of the number of EdU-labeled cells in all three retinal layers. (D) The percentage of the EdU-labeled cells in the Outer Nuclear Layer (ONL) versus combined in the Inner Nuclear Layer (INL) and Ganglion Cell Layer (GCL). (E) Schematic of light-induced damage experiment. (F) EdU-labeling following light damage. (G) Quantification of the number of EdU-labeled cells in all three retinal layers. (H) The percentage of the EdU-labeled cells in the ONL versus combined in the INL+GCL. (I) DAPI staining of undamaged retinas and 48, 60, and 72 hours after injecting NMDA. (J) Quantification of the number of DAPI-labeled nuclei in the ONL. (K) Quantification of the number of DAPI-labeled nuclei in the INL. (L) Quantification of the number of DAPI-labeled nuclei in the GCL. (M) DAPI and HuC/D staining of undamaged retinas and 36, 48, 60, and 72 hours after starting constant light treatment. (N) Quantification of the number of DAPI- or HuC/D-labeled nuclei in the ONL. (O) Quantification of the number of DAPI- or HuC/D-labeled nuclei in the INL. (P) Quantification of the number of DAPI- or HuC/D-labeled nuclei in the GCL. Scale bars in B, F, and I are 20μm and in M is 14μm.
Figure 2:
Figure 2:. Shared and differential patterns of gene expression and chromatin accessibility data observed in MG-derived cells following LD and NMDA treatment.
(A,B) Combined UMAP projection of MG and progenitor neuron cells profiled using multiomic sequencing. Each point (cell) is colored by cell type (A) and time points (B). (C) UMAPs showing trajectories constructed from mutiomics datasets of combined LD and NMDA datasets. Color indicates pseudotime state. (D) Line graphs showing the fraction of cells (x axis) at each time point (y axis) of each cell type. Lines are colored by treatment. (E) Heatmap shows the consensus marker genes and their related marker peaks (TSS and enhancer) between LD and NMDA treatment for each cell type. (F) Heatmap shows the consensus motifs between LD and NMDA treatment for each cell type. (G) Heatmap shows the differential genes and their related differential peaks (TSS and enhancer) between LD and NMDA treatment for MG(R), MG(A) and MGPCs. (H) Heatmap shows the differential motifs between LD and NMDA treatment for MG(R), MG(A), and MGPCs.
Figure 3:
Figure 3:. Mmp9 selectively inhibits generation of inner retinal neurons from MGPCs.
(A) Gene expression pattern of mmp9 between LD and NMDA model. (B) Changing of chromatin accessibility around mmp9 loci between LD and NMDA models. (C) Schematic of NMDA-damaged experiments in wild-type and mmp9 mutant fish. Retinas were PBS-injected (undamaged) or damaged for 96 hours and then isolated after 7 days of recovery. (D) Schematic of light-damaged experiments in wild-type and mmp9 mutant fish. Fish were placed in constant darkness for 2 weeks and then exposed to constant intense light for 96 hours and then placed in standard light conditions and sacrificed 7 days later. (E) Retinal sections were immunostained with HuC/D and EdU and then counterstained with DAPI. (F) Quantification of the number of EdU-labeled cells in all three retinal layers in wild-type and mmp9 mutants following either PBS injection, NMDA damage, or light damage. (G) The percentage of EdU-positive cells in the ONL versus the INL+GCL is plotted for wild-type and mmp9 mutant retinas after PBS injection, NMDA damage, and light damage. (H) The ratio of EdU-positive ONL cells to EdU-positive INL+GCL cells is plotted for wild-type and mmp9 mutant fish following either NMDA damage or light damage. (I) Quantification of the number of cells colabelled for EdU and HuC/D in PBS-injected, NMDA-injected, and light-damaged retinas. Scale bar in E is 20μm.
Figure 4:
Figure 4:. Transcription factors controlling differential gene expression in MG and MGPC following LD and NMDA treatment.
(A) Schematic of MG regeneration after LD and NMDA treatment. (B) Inference of activator and repressor function for each individual transcription factor from mulitomic datasets. The y-axis represents the correlation distribution between gene expression and chromVAR score. The top three activator and repressor TFs are shown on the right. (C) Gene regulatory networks of LD and NMDA datasets. (left) Triple regulons model. (right) barplot shows the types of regulons between LD and NMDA datasets. (D) Venn diagram shows the overlap of regulons between LD and NMDA datasets. (E) Enriched gene regulatory networks of LD and NMDA treatment. (left) Enriched Triple regulons model for each condition. (right) barplot shows the number of different types of regulons between LD and NMDA enriched GRNs. (F) An example of stat2 regulons. Color indicates the log2 fold change between the LD and NMDA datasets. (G) Heatmap showing the differentially expressed genes in microglia/macrophages after LD and NMDA treatment. Microglia/macrophage cells are ordered by time points after injury, and an averaged expression level is shown for each timepoint. Color represents mean-centered normalized expression levels. (H) Dotplot showing the key activator TFs for each divergent gene cluster. The size of the dot shows the gene expression ratio, and color indicates the statistical significance of differential expression.
Figure 5:
Figure 5:. Shared and differential features of MG derived cells between injury and development datasets.
(A) Integrated UMAP projection of MG and progenitor neuron cells using injury (left) and development (right) snRNA-seq datasets. Each point (cell) is colored by cell type in each dataset. (B) UMAPs showing the 8 trajectories (groups) constructed from the integrated UMAPs of combined injury and development datasets. Color indicates pseudotime state. The label indicates the cell types included for each trajectory. (C,D) The heatmap displays the Pearson correlations between the cell types from the injury and development datasets using snRNA-seq RNA expression (C) and snATAC-seq bin signals (D). The highest correlation score for each injury cell type is labeled on the heatmap. (E) Heatmap shows the consensus marker genes and their related marker peaks (TSS and enhancer) between injury and development model for each group. (F) Heatmap shows the consensus motifs between injury and development model for each group. (G) Heatmap shows the differential genes and their related differential peaks (TSS and enhancer) between injury and development model for MG groups (group1 and group2). (H) Heatmap shows the differential motifs between injury and development model for MG groups (group1 and group2).
Figure 6:
Figure 6:. Transcription factors controlling differential expression genes in MGPC in injured retina and progenitor cells in developing retina.
(A) Schematic of MG regeneration between injury and development. (B) Inference of activator and repressor function for each individual transcription factor from mulitomic datasets. The y-axis represents the correlation distribution between gene expression and chromVAR score. The top three activator and repressor TFs are shown on the right. (C) Gene regulatory networks of injury and development datasets. (left) Triple regulons model. (right) barplot shows the number of types of regulons. (D) Venn diagram shows the overlap of regulons between injury and development GRNs. (E) Enriched gene regulatory networks of injury and development. (Left) Enriched Triple regulons model for each condition. (Right) barplot shows the number of different types of regulons between injury and development enriched GRNs. (F) An example of foxj1a regulons. Color indicates the log2 fold change between injury and developmental datasets. (G) Dotplot showing key activator TFs for each divergent gene cluster. The size of the dot showing the gene ratio and color indicates the significance of regulation.
Figure 7:
Figure 7:. Foxj1a is required for MGPC proliferation.
(A). UMAPs showing the gene expression pattern of foxj1a between injury (left) and development model (right). (B). UMAPs showing the chromVAR motif activity of foxj1a between injury (left) and development model (right). (C) Tg(gfap:GFP) retinas electroporated with either Standard Control morpholino (Cont MO), pcna MO, or foxj1a MO were isolated 72 hours after NMDA injection and immunostained for PCNA, GFP, and counterstained with DAPI. (D) Quantification of the number of PCNA-labeled cells in the INL. (E) Quantification of the number of PCNA-labeled cells in the ONL. (F) Tg(gfap:GFP) retinas electroporated with either Cont MO, pcnaMO, or foxj1a MO were isolated 72 hours after starting constant light and immunostained for PCNA, GFP, and DAPI. (G) Quantification of the number of PCNA-labeled cells in the INL. (H) Quantification of the number of PCNA-labeled cells in the ONL. Scale bars in A and D are 20μm.

References

    1. Lahne M., Nagashima M., Hyde D. R. & Hitchcock P. F. Reprogramming Müller Glia to Regenerate Retinal Neurons. Annu Rev Vis Sci 6, 171–193 (2020). - PMC - PubMed
    1. Vihtelic T. S. & Hyde D. R. Light-induced rod and cone cell death and regeneration in the adult albino zebrafish (Danio rerio) retina. J. Neurobiol. 44, 289–307 (2000). - PubMed
    1. Bernardos R. L., Barthel L. K., Meyers J. R. & Raymond P. A. Late-stage neuronal progenitors in the retina are radial Müller glia that function as retinal stem cells. J. Neurosci. 27, 7028–7040 (2007). - PMC - PubMed
    1. Thomas J. L., Nelson C. M., Luo X., Hyde D. R. & Thummel R. Characterization of multiple light damage paradigms reveals regional differences in photoreceptor loss. Exp. Eye Res. 97, 105–116 (2012). - PMC - PubMed
    1. Powell C., Cornblath E., Elsaeidi F., Wan J. & Goldman D. Zebrafish Müller glia-derived progenitors are multipotent, exhibit proliferative biases and regenerate excess neurons. Sci. Rep. 6, 24851 (2016). - PMC - PubMed

Publication types

LinkOut - more resources