[Preprint]. 2023 Sep 22:2023.09.22.559056.
doi: 10.1101/2023.09.22.559056.

Single cell analysis of dup15q syndrome reveals developmental and postnatal molecular changes in autism

Affiliations

Single cell analysis of dup15q syndrome reveals developmental and postnatal molecular changes in autism

Yonatan Perez et al. bioRxiv. .

Update in

Abstract

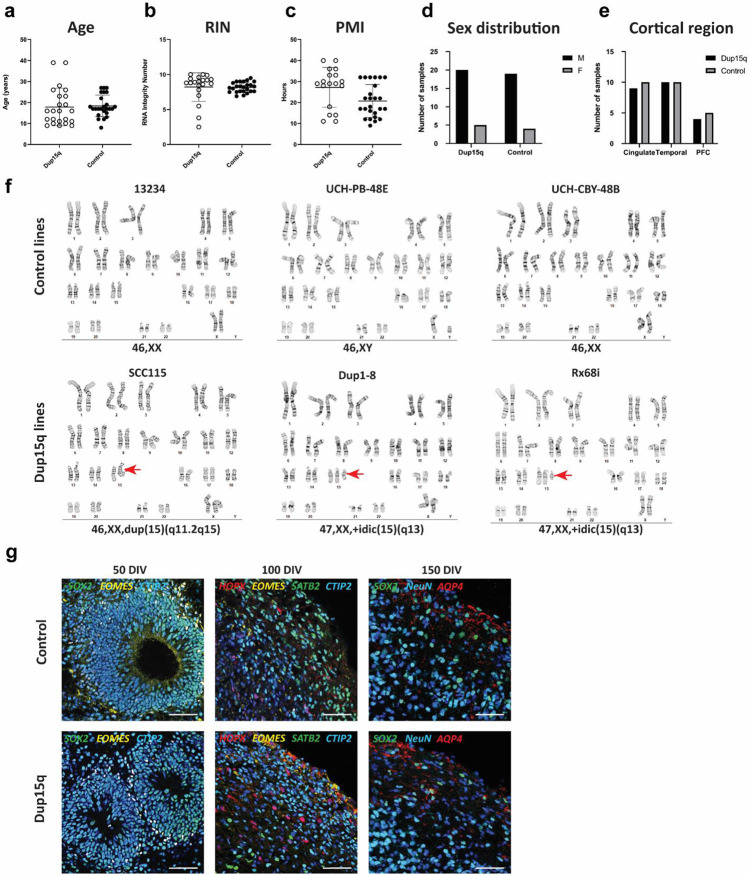
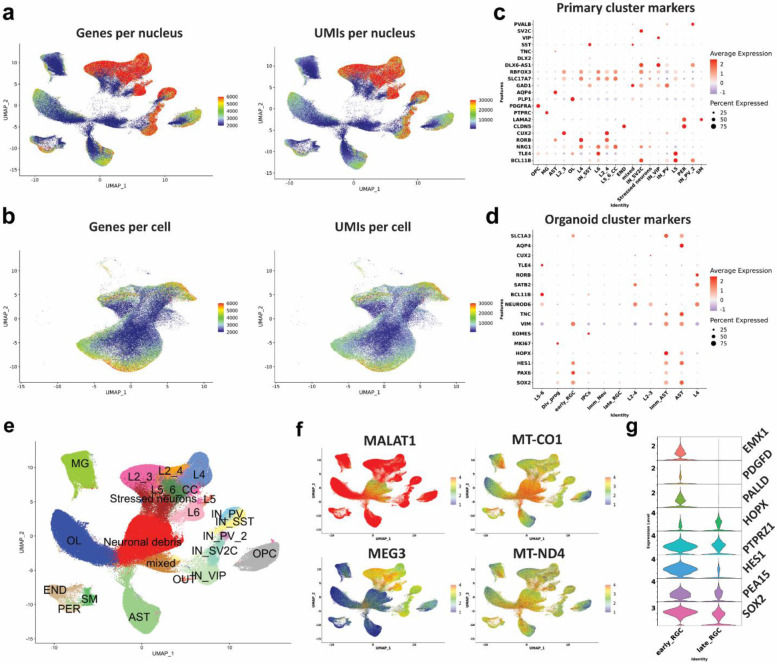
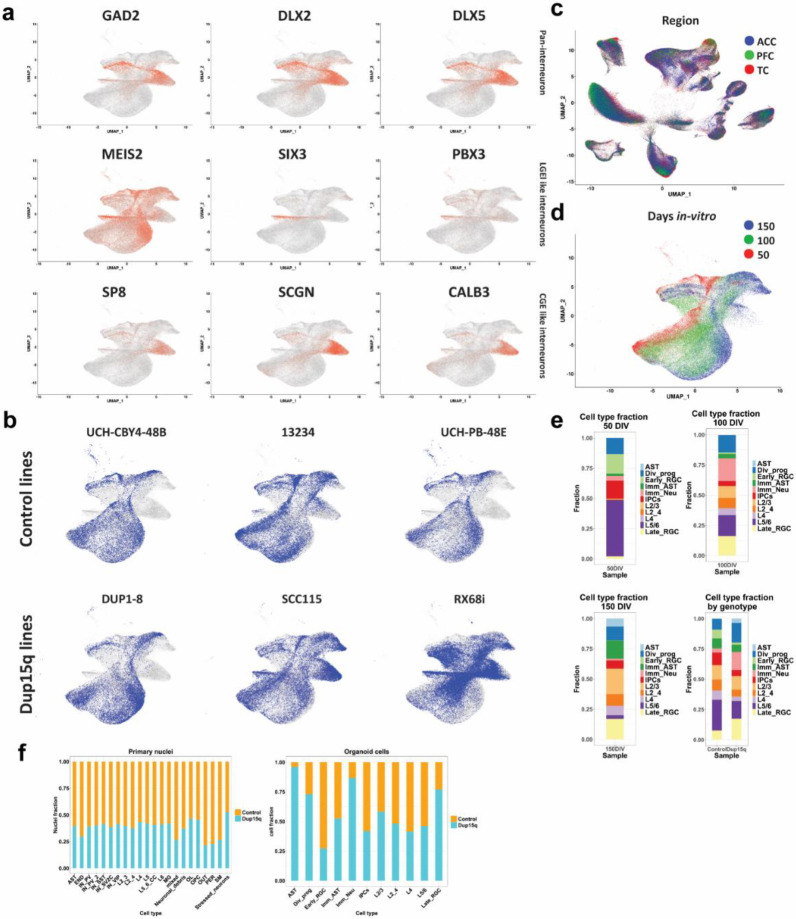
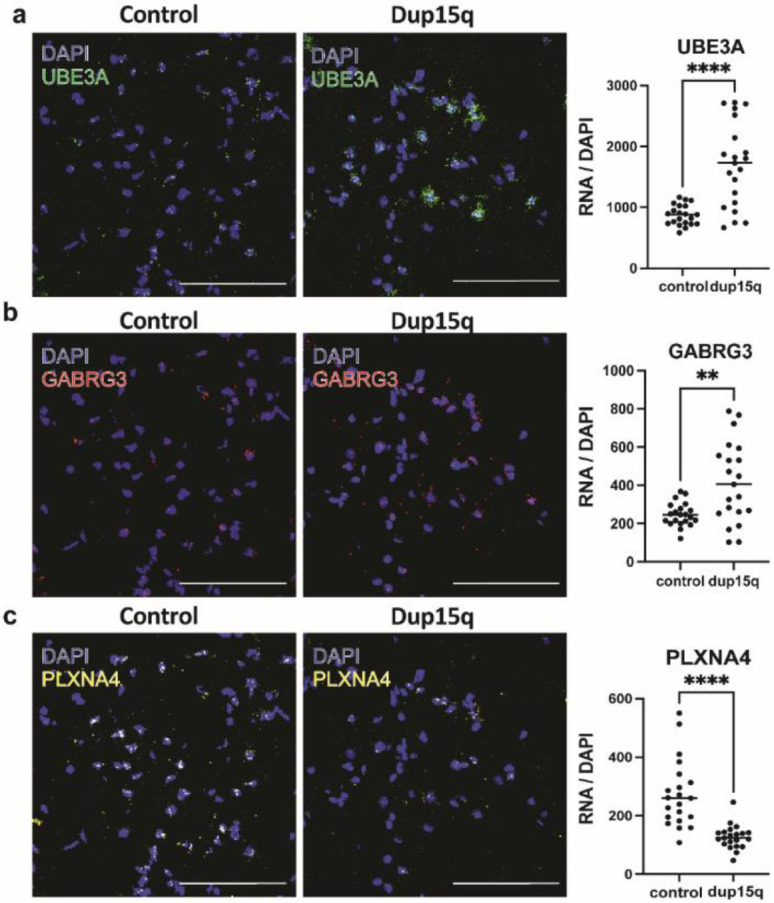
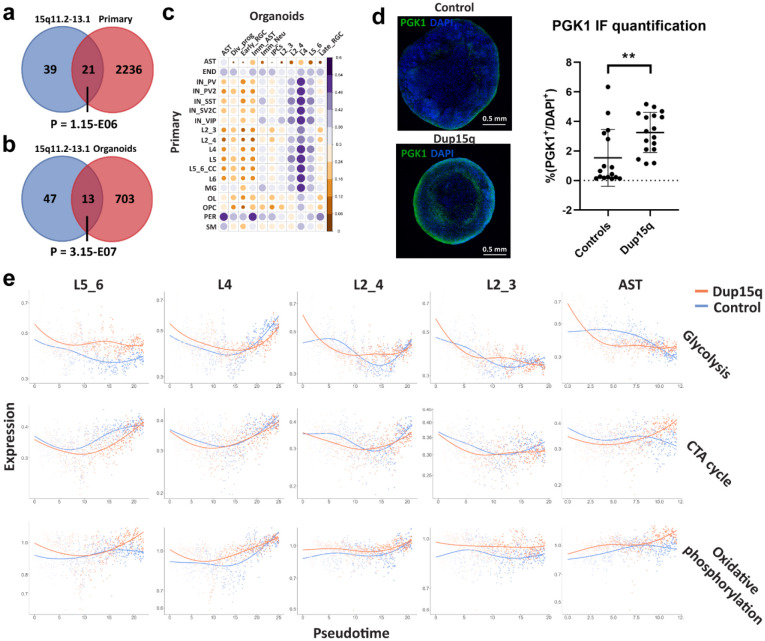
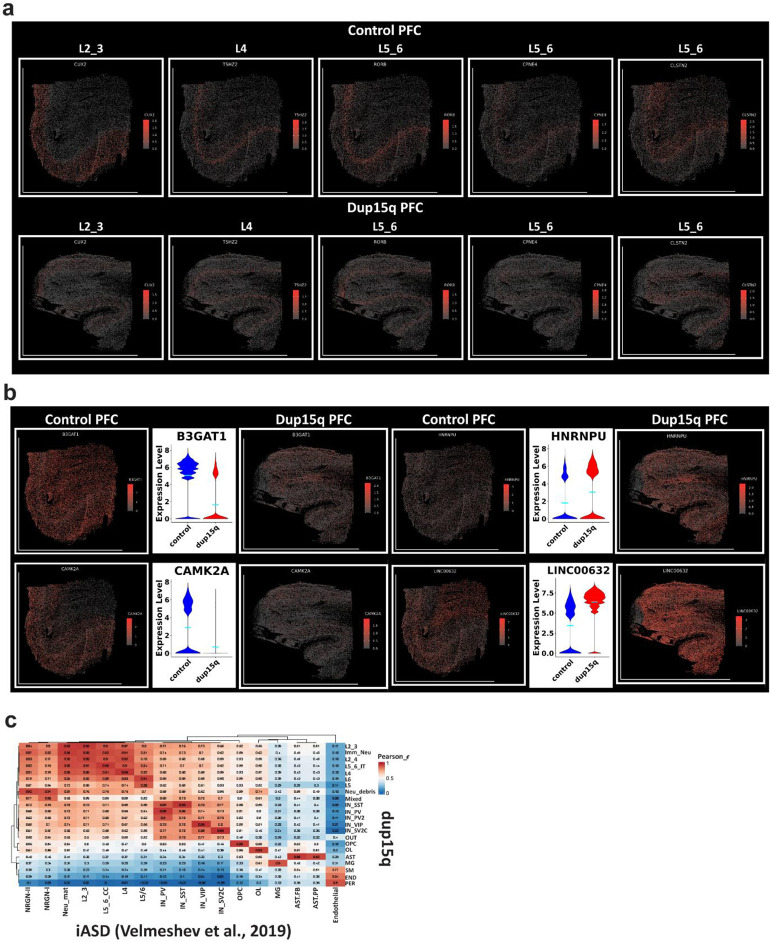
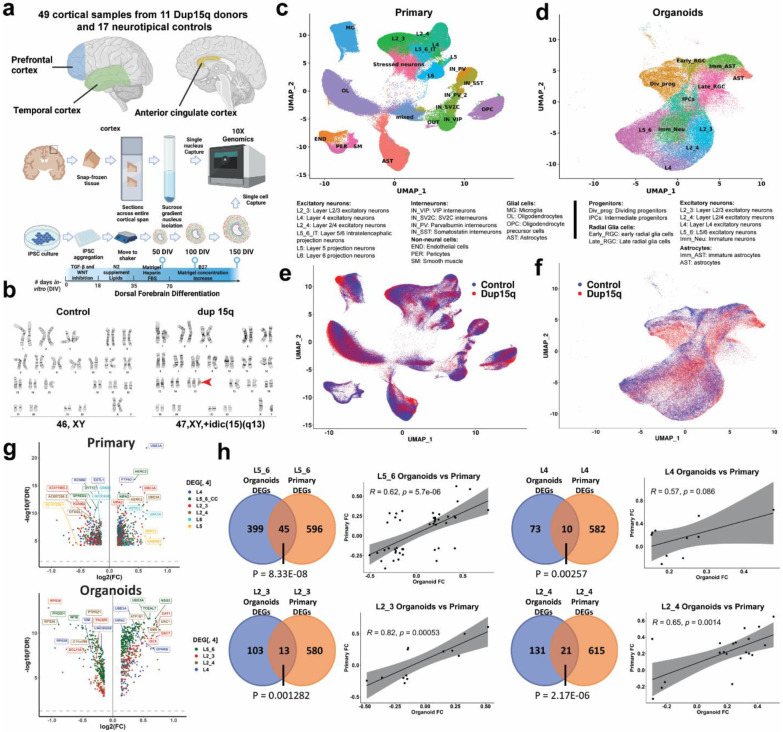
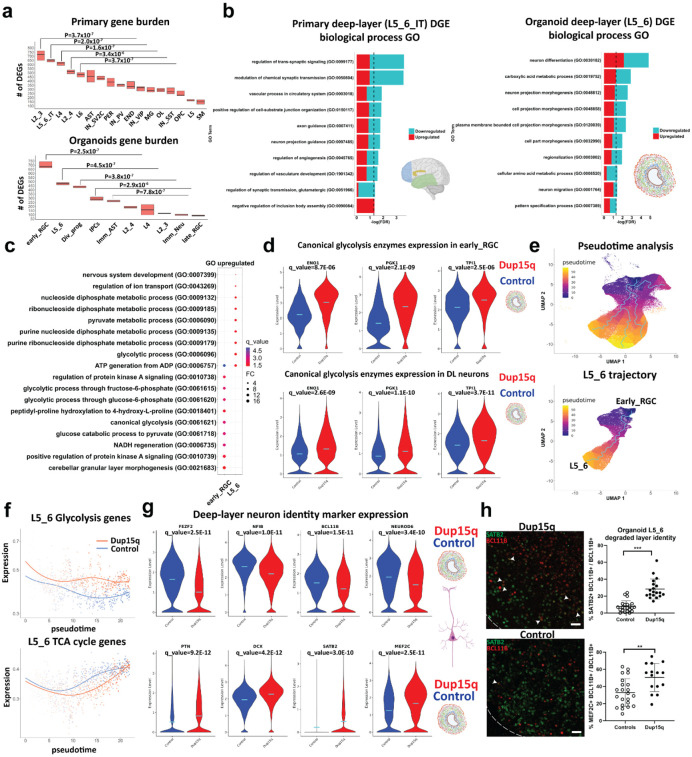
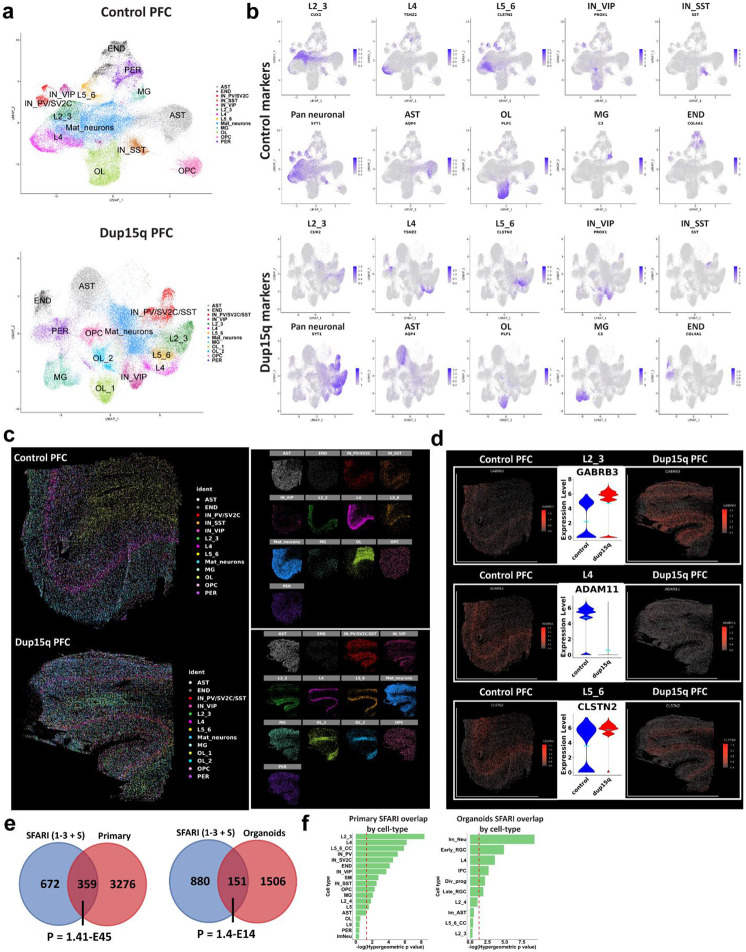
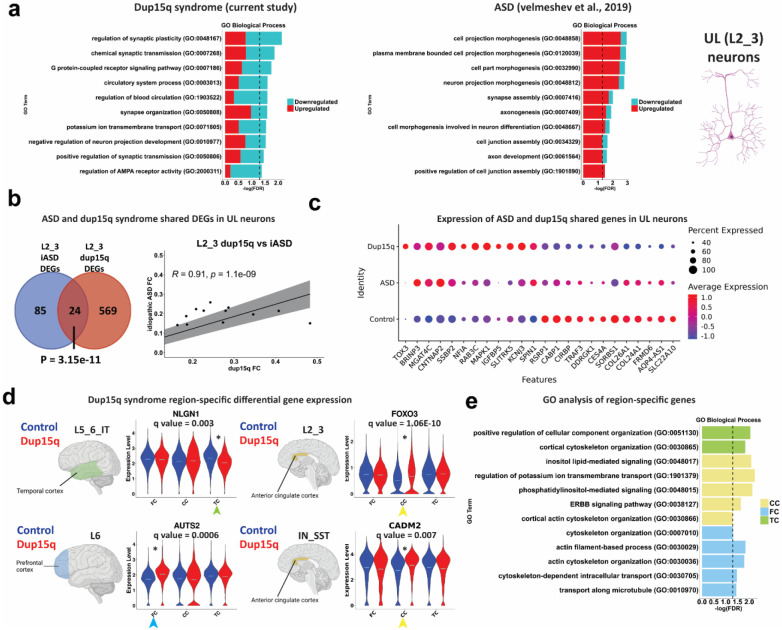
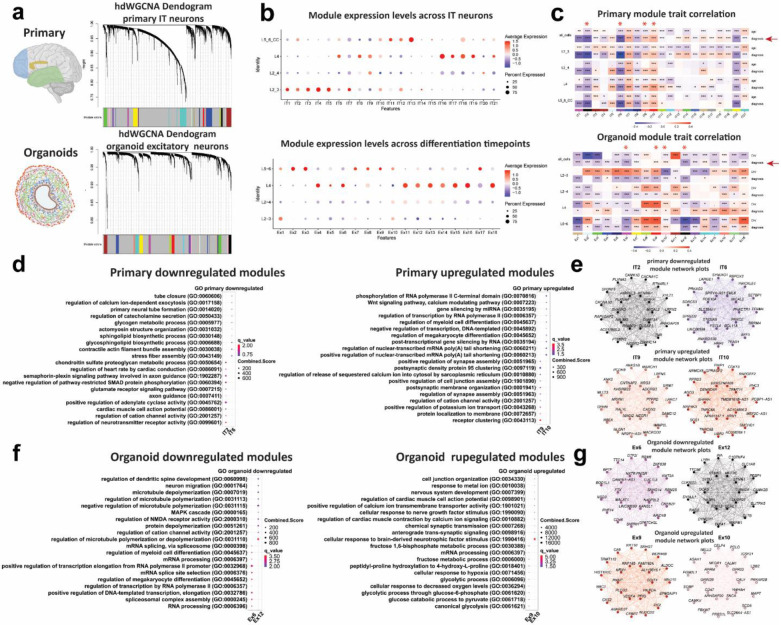
Duplication 15q (dup15q) syndrome is the most common genetic cause of autism spectrum disorder (ASD). Due to a higher genetic and phenotypic homogeneity compared to idiopathic autism, dup15q syndrome provides a well-defined setting to investigate ASD mechanisms. Previous bulk gene expression studies identified shared molecular changes in ASD. However, how cell type specific changes compare across different autism subtypes and how they change during development is largely unknown. In this study, we used single cell and single nucleus mRNA sequencing of dup15q cortical organoids from patient iPSCs, as well as post-mortem patient brain samples. We find cell-type specific dysregulated programs that underlie dup15q pathogenesis, which we validate by spatial resolved transcriptomics using brain tissue samples. We find degraded identity and vulnerability of deep-layer neurons in fetal stage organoids and highlight increased molecular burden of postmortem upper-layer neurons implicated in synaptic signaling, a finding shared between idiopathic ASD and dup15q syndrome. Gene co-expression network analysis of organoid and postmortem excitatory neurons uncovers modules enriched with autism risk genes. Organoid developmental modules were involved in transcription regulation via chromatin remodeling, while postmortem modules were associated with synaptic transmission and plasticity. The findings reveal a shifting landscape of ASD cellular vulnerability during brain development.


Figures

Extended Data Figure 1.
Extended Data Figure 1.. Sample statistics for experimental groups, iPSC karyotype and organoid development.
a-e) Comparison of age, RNA integrity number (RIN), post-mortem interval (PMI), sex, and brain regions between control and dup15q groups. f) G-banding karyotype analysis of all iPSC lines used in the study. g) Immunostainings of organoid sections at three sampling developmental timepoints (50, 100 and 150 days of in-vitro development, scale bar = 50μm).
Extended Data Figure 2.
Extended Data Figure 2.. Technical and biological characteristics of the primary and organoid datasets.
a) Primary gene and UMI counts per nucleus across all cell types. b) Organoid gene and UMI counts per cell across all cell types. c) Primary nuclei marker gene expression used to annotate specific cells. d) Organoid marker gene expression used to annotate specific cells. e-f) Identification of clusters containing neuronal debris, expression low nuclear-retention and high mitochondrial transcripts. g) Marker gene expression of early radial glia (early_RGC) vs late radial glia cells (late_RSC).
Extended Data Figure 3.
Extended Data Figure 3.. Organoid interneuron identification and cell-type proportions.
a) Organoid marker gene expression identifies interneuron subtypes. b) Contribution of each line to specific organoid cell types. c) UMAP of all primary cell-types grouped by cortical region. d) UMAP of cell-types grouped by differentiation timepoint. e) Organoid cell type contribution for each differentiation timepoint, and between genotypes for all timepoints combined. f) Cell-type fraction from all primary nuclei and organoid cells type by genotype.
Extended Data Figure 4.
Extended Data Figure 4.. Single-molecule RNA in situ hybridization validation of selected differentially expressed genes across all cell types of dup15q and control cortical samples.
a) Validation of enrichment of UBE3A transcript in neurons of the temporal cortex. b) Validation of enrichment of GABRG3 transcript in neurons of the temporal cortex. c) Validation of PLXNA4 transcript downregulation in neurons of the temporal cortex. (n=3 cortical samples from both dup15q and controls. Statistics represents counts from 7 field. Scale bar = 100μm).
Extended Data Figure 5.
Extended Data Figure 5.. Contribution of duplicated genes to DEGs, cell type gene expression correlation, and metabolic gene set expression of cell-specific trajectories along pseudotime
a) Venn diagram showing overlap between putative duplicated genes and primary nuclei overexpressed genes from all cell types (P denotes a hypergeometric p value). b) Venn diagram showing overlap between putative duplicated genes and organoid overexpressed genes from all cell types (P denotes a hypergeometric p value). c) Pearson’s correlation plot of top 100 expressed genes between organoid and primary cell types. d) Immunofluorescent staining of the glycolysis enzyme PGK1 in control and dup15q organoids. The plot on the right is showing quantification summary of PGK1 expression. e) Metabolic gene set expression levels of organoid cell-specific trajectories plotted along pseudotime (red line denotes dup15q while blue lines denote control expression).
Extended Data Figure 6.
Extended Data Figure 6.. Spatial transcriptomics validates differential gene expression in dup15q syndrome PFC.
a) Excitatory neuron layer-specific markers tissue expression. b) Examples of differentially expressed genes, validated through spatial resolved transcriptomics. c) Heatmap with Pearson’s correlation plot of highly expressed genes between dup15q and idiopathic ASD cell types.
Figure 1.
Figure 1.. Comprehensive single-cell molecular profiling of dup15q syndrome using postmortem cortical samples and cortical organoids.
a) Illustration of experimental design, sample collection and cell capture. b) G-banding karyotype of normal and idic(15q) iPSC lines. c) Unbiased clustering of single nuclei and annotated cell types of postmortem samples. d) Unbiased clustering of cortical organoid single cells and annotated cell types. e) Primary nuclei clustered by genotype, showing equal contribution of dup15q and control samples to all cell types. f) Organoid cells clustered by genotype, showing similar contributions from dup15q and control organoids to all cell types. g) Volcano plots for cell type–specific genes differentially expressed in both primary and organoid excitatory neurons. h) Overlap between DEGs of primary and organoid excitatory neurons as well as Pearson’s correlation coefficient of shared genes fold changes.
Figure 2.
Figure 2.. increased glycolysis in dup15q cortical organoids lead to degraded deep-layer neuronal identity.
a) Gene burden analysis of primary and cortical organoid cells-types. (Mann-Whitney U test). b) GO analysis of primary and cortical deep-layer (DL) excitatory neurons. c) GO analysis of organoid early RGC and DL neurons showing enrichment of glycolysis associated terms (q value = −log(FDR); FC = Fold change). d) Violin plots showing increased expression of canonical glycolytic enzymes in dup15q early RGCs and DL neurons. e) Pseudotime analysis identifies organoid trajectories comparable to in vivo cortical development (top panel). Identifying dynamic gene expression changes along the DL neuron trajectory (bottom panel). f) DL neurons of dup15q syndrome cortical organoids are expressing high levels of glycolysis genes and attenuated TCA cycle genes along pseudotime. g) Violin plots showing co-expression of DL markers, immature neuron markers, and UL neuron markers, indicating degraded identity of dup15q organoid DL neurons. (Control in blue and dup15q in red). f) IF and Co-expression analysis of organoid DL and UL neuron markers (scale bar = 100μm; white arrowheads indicating BLC11B and SATB2 co-expression).
Figure 3.
Figure 3.. Spatial resolved transcriptomics of dup15q syndrome prefrontal cortex.
a) Uniform Manifold Approximation and Projection (UMAP) embedding and cluster annotations of single cell spatial transcriptomic data. b) Cell subtype gene expression of markers used for cluster annotations. c) Annotated cell clusters overlaid on tissue images using cell coordinates. Image showing comparable cell type identification and spatial localization of dup15q patient and control clusters. d) Examples of cell type specific differential gene expression validated by spatial resolved transcriptomics. e) Overlap between primary and organoid DEGs and high-confidence ASD genetic risk factors (SFARI gene scores 1 to 3 and syndromic; Hypergeometric P-value). f) Overlap between SFARI genes and DEGs by cell-type; dashed red line indicates statistical significance (q < 0.05).
Figure 4.
Figure 4.. Converged molecular changes of UL neurons between dup15q syndrome and idiopathic ASD.
a) GO analysis of idiopathic autism (ASD) and dup15q syndrome UL neuron DEGs. b) Overlap between upper-layer DEGs of idiopathic ASD and dup15q as well as Pearson’s correlation coefficient of shared gene fold changes. c) Differential expression of ASD and dup15q syndrome shared genes in UL cortical neurons. d) Violin plots of selected dup15q region-specific gene expression. e) GO analysis of dup15q region-specific genes.
Figure 5.
Figure 5.. Weighted gene co-expression networks (WGCNA) of organoid and primary dup15q excitatory neurons.
a) WGCNA dendrogram of primary IT neurons and organoid excitatory neurons. Each leaf represents a single gene, colors on the bottom represent assignment of co-expression modules. b) Primary IT neurons and organoid excitatory module expression across different cell-types. c) Module trait correlation analysis. Red Asterix indicates down or upregulated modules that are associated with the dup15q genotype. d) primary IT neuron gene ontology (GO) of down and upregulated dup15q associated modules. e) Individual module network plots of primary IT neurons highlighting the top 25 hub genes for each network. f) Organoid excitatory neuron gene ontology (GO) of down and upregulated dup15q associated modules. g) Individual module network plots of organoid excitatory neurons highlighting the top 25 hub genes for each network.

References

    1. Sandin S. et al. The Heritability of Autism Spectrum Disorder. JAMA 318, 1182–1184 (2017). - PMC - PubMed
    1. Ben-david E. & Shifman S. Networks of Neuronal Genes Affected by Common and Rare Variants in Networks of Neuronal Genes Affected by Common and Rare Variants in Autism Spectrum Disorders. (2014) doi: 10.1371/journal.pgen.1002556. - DOI - PMC - PubMed
    1. Amiri A. et al. Research article summary. 6720, (2018).
    1. Ben-David E. & Shifman S. Combined analysis of exome sequencing points toward a major role for transcription regulation during brain development in autism. Mol. Psychiatry 18, 1054–1056 (2013). - PubMed
    1. Parikshak N. N. et al. XIntegrative functional genomic analyses implicate specific molecular pathways and circuits in autism. Cell 155, 1008 (2013). - PMC - PubMed

Publication types