[Preprint]. 2023 Sep 21:rs.3.rs-3356477.
doi: 10.21203/rs.3.rs-3356477/v1.

Deficiency of metabolic regulator PKM2 activates the pentose phosphate pathway and generates TCF1+ progenitor CD8+ T cells to improve checkpoint blockade

Affiliations

Deficiency of metabolic regulator PKM2 activates the pentose phosphate pathway and generates TCF1+ progenitor CD8+ T cells to improve checkpoint blockade

Geoffrey J Markowitz et al. Res Sq. .

Update in

Abstract

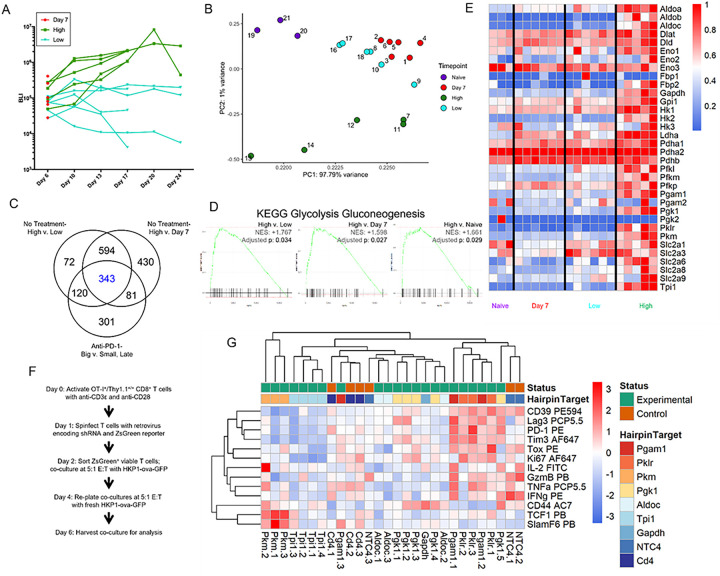
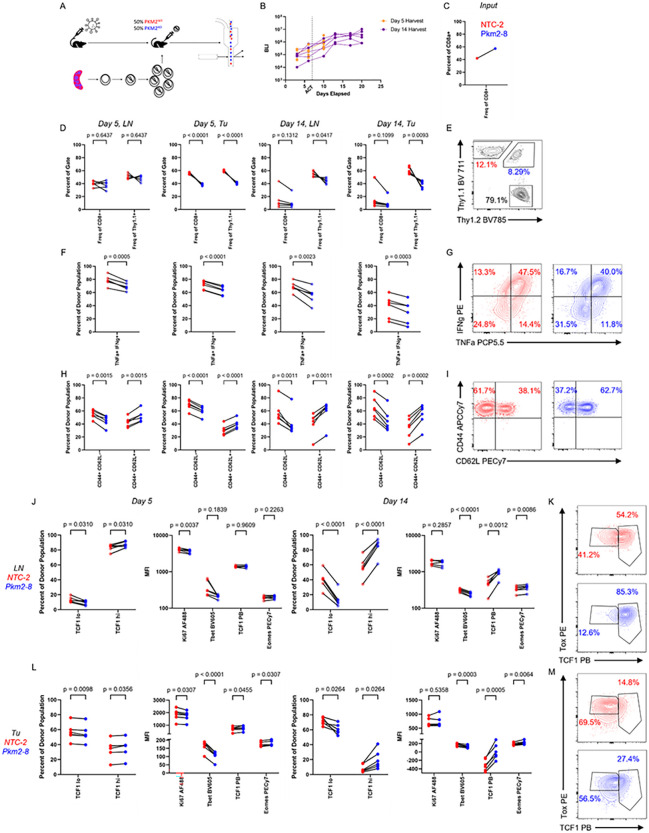
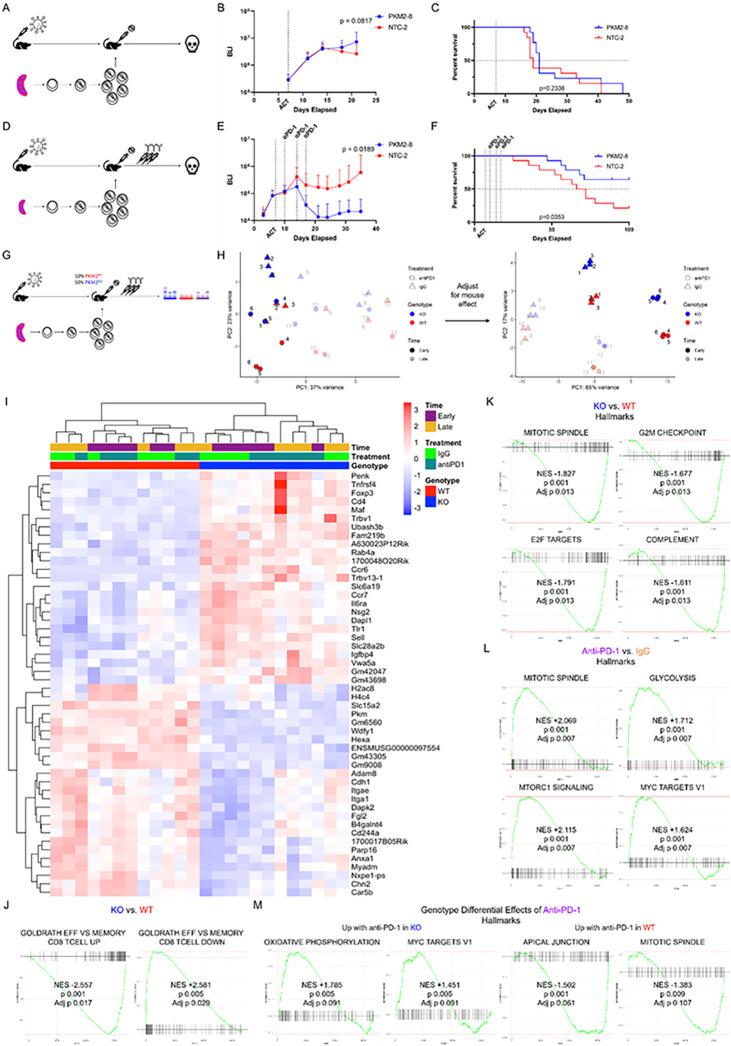
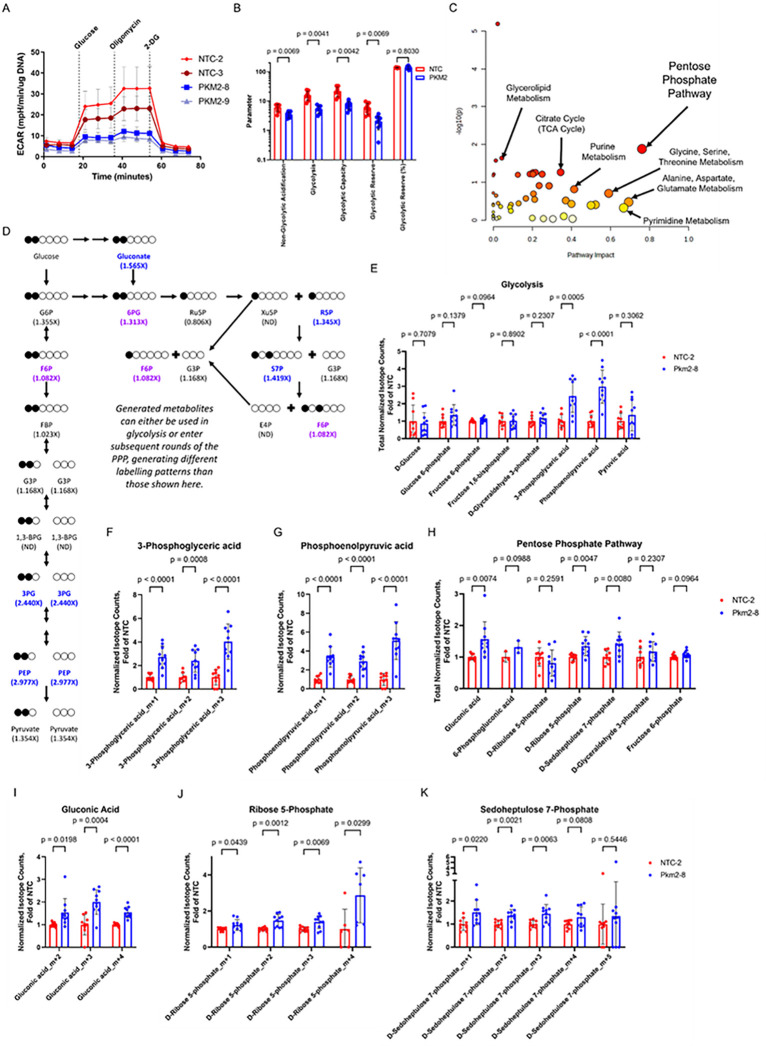
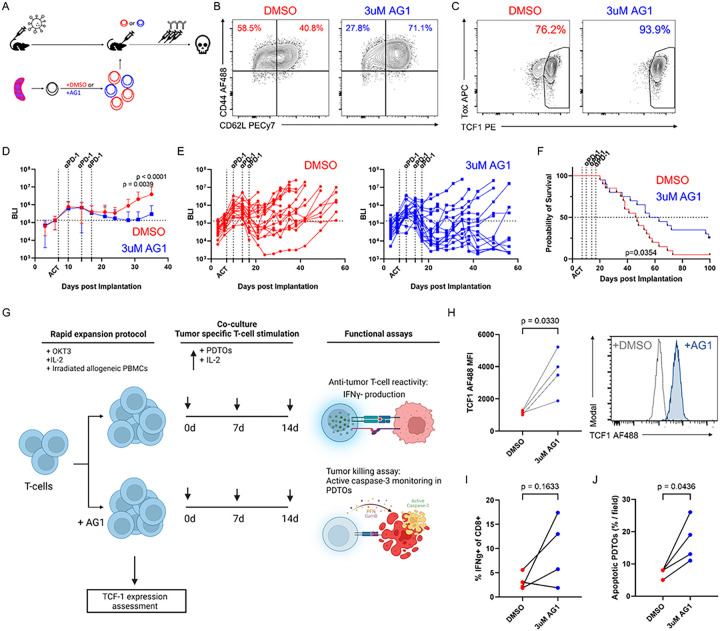
TCF1high progenitor CD8+ T cells mediate the efficacy of PD-1 blockade, however the mechanisms that govern their generation and maintenance are poorly understood. Here, we show that targeting glycolysis through deletion of pyruvate kinase muscle 2 (PKM2) results in elevated pentose phosphate pathway (PPP) activity, leading to enrichment of a TCF1high central memory-like phenotype and increased responsiveness to PD-1 blockade in vivo. PKM2KO CD8+ T cells showed reduced glycolytic flux, accumulation of glycolytic intermediates and PPP metabolites, and increased PPP cycling as determined by 1,2 13C glucose carbon tracing. Small molecule agonism of the PPP without acute glycolytic impairment skewed CD8+ T cells towards a TCF1high population, generated a unique transcriptional landscape, enhanced tumor control in mice in combination with PD-1 blockade, and promoted tumor killing in patient-derived tumor organoids. Our study demonstrates a new metabolic reprogramming that contributes to a progenitor-like T cell state amenable to checkpoint blockade.

Keywords: CD8+ T cell; Immunotherapy; Non-small cell lung cancer; PKM2; TCF1; metabolic reprograming; pentose phosphate pathway.


Figures

Figure 1:
Figure 1:. A genetic screen targeting glycolytic enzymes identifies Pyruvate kinase, muscle (PKM) as a potential regulator of T cell differentiation.
a, Bioluminescent imaging (BLI) plots of tumor growth kinetics in mice from which CD8+ T cells were isolated at different time points (Day 7 for Day 7 group, Days 17 and 24 for Low and High groups) for bulk RNA sequencing analysis. Cohorts of mice (Naïve, Day 7, Low, and High) are depicted b, Principal component analyses of sequencing data from (a). c, Venn diagram showing overlaps of differentially expressed genes (p<0.05, adjusted p<0.2, absolute log2 fold change ≥ 1) between tumor phenotypes from this dataset and from comparisons between big and small tumors at later timepoints in the previously published anti-PD-1 dataset. d, Gene set enrichment analysis using the KEGG Glycolysis/Gluconeogenesis dataset for differences in glycolytic gene signatures in tumor-infiltrating CD8+ T cells between the High tumor burden group and others. e, Heatmap showing normalized expression of selected genes from the KEGG Glycolysis / Gluconeogenesis dataset across groups. f, Schematic of an shRNA screen targeting differentially expressed glycolytic enzymes from (e). g, Heatmap of normalized protein expression of cytokines, effector proteins, transcription factors, and surface markers associated with T cell differentiation and effector function measured by mean fluorescence intensity (MFI). Numbers: (a-e) Naïve group n=3 biological replicates, Day 7 group n=6 biological replicates, Low group n=6 biological replicates, High group n=5 biological replicates. (g) Data from 3–5 hairpins for each target were collected, except Gapdh, where two of the hairpins used proved to be lethal to the T cells. Statistics: (b) PCA calculated using princomp in R and plotted with ggplot2; (c) DEGs calculated using the limma package in R; (d) GSEA by fgsea package in R. Abbreviations: PE594, PE-Dazzle 594; PCP5.5, Peridinin Chlorophyll-A Protein-Cyanine5.5; PE, Phycoerythrin; AF647, Alexa Fluor 647; FITC, Fluorescein isothiocyanate; PB, Pacific Blue; AC7, Allophycocyanin Cyanine7.
Figure 2:
Figure 2:. PKM2 is upregulated upon T cell activation in vitro and in vivo, and its deletion results in a less effector-differentiated phenotype.
a, Histograms of fluorescence of PKM2 (solid lines) and isotype control (dotted lines) of naïve antigen-specific OT-I+ Thy1.1+ T cells (blue) or OT-I+ Thy1.1+ T cells from co-culture with Ova257–264–expressing HKP1-ova-GFP tumor cells (red) as a function of time (days 3–14 post-initial-stimulation). b-c, MFI of PKM2 expression from T cells isolated from HKP1-ova-GFP tumor-bearing C57Bl/6 mice. Naïve OT-I+ Thy1.1+ T cells were adoptively transferred into mice one day prior to orthotopic tumor implantation (b), while in vitro activated OT-I+ Thy1.1+ T cells were adoptively transferred 7 days post orthotopic tumor implantation into mice which received a single lymphodepleting dose of 5Gy of radiation (c). Sample fluorescence intensity was scaled to naïve OT-I+ Thy1.1+ T cell PKM2 expression acquired at each timepoint in (b), and from host T cells isolated from the non-draining lymph node (NDLN) in (c). d-g, Flow cytometry analysis of OT-I+ Thy1.1+ T cells co-cultured with HKP1-ova-GFP tumor cells as described (Fig. 1F). Activated T cells were infected with shRNAs targeting PKM (shPKM) or control CD4 (shCD4), and co-cultured with HKP1-ova-GFP tumor cells until 6 days post-initial-stimulation. d, MFIs for PKM2, effector molecules, surface markers and transcription factors in shCD4 (red) and shPKM (blue) T cells. e, Representative contour plots for IFNγ and TNFα staining in T cells infected with two hairpins targeting CD4 (red, CD4–4E and CD4–5C) and two hairpins targeting PKM (blue, PKM-2B and PKM-2D) at 6 days post-initial-stimulation. f, Representative contour plots for Tox and TCF1 staining in T cells infected with two hairpins targeting CD4 (red, CD4–4E and CD4–5C) and two hairpins targeting PKM (blue, PKM-2B and PKM-2D) at 6 days post-initial-stimulation. g, Quantification of populations of T cells infected with shCD4 (red) and shPKM (blue) at 6 days post-initial-stimulation. h-k, Flow cytometry analysis of OT-I+ Thy1.1+ T cells co-cultured with HKP1-ova-GFP tumor cells. Activated T cells were electroporated with guides targeting PKM2 (sgPKM2) or non-targeting controls (sgNTC), and co-cultured with tumor cells until 6 days post-initial-stimulation. h, MFIs for PKM isoforms, effector molecules, cytokines, surface markers, and transcription factors in sgNTC (red) and sgPKM2 (blue) T cells. i, Representative contour plots for IFNγ and TNFα staining in T cells electroporated with two non-targeting control guides (red, sgNTC-2 and sgNTC-3) and two guides targeting PKM2 (blue, sgPKM2–8 and sgPKM2–9) at 6 days post-initial-stimulation. j, Representative contour plots for Tox and TCF1 staining in T cells electroporated with two non-targeting control guides (red, sgNTC-2 and sgNTC-3) and two guides targeting PKM2 (blue, sgPKM2–8 and sgPKM2–9) at 6 days post-initial-stimulation. k, Quantification of populations of T cells electroporated with sgNTC (red) and sgPKM2 (blue) at 6 days post-initial-stimulation. Numbers: (b) n=3–13 biological replicates per group, aggregate of two experiments; (c) n=3–8 biological replicates per group; (d-g) n=2–3 biological replicates per hairpin, 4–5 per group, experiment repeated three times; (h-k) n=3 biological replicates per guide, 6 biological replicates per group, experiment repeated five times. Statistcs: (b, c) One-way ANOVA, Dunnet multiple comparisons; (d, g, h, k) Multiple unpaired t-tests, Holm-Šídák multiple comparisons. Abbreviations: PE, Phycoerythrin; PB, Pacific Blue; AF647, Alexa Fluor 647; PE594, PE-Dazzle 594; PCP5.5, Peridinin Chlorophyll-A Protein-Cyanine5.5.
Figure 3:
Figure 3:. Loss of PKM2 results in a central memory-like phenotype in CD8+ T cells in NSCLC.
Adoptive co-transfers of activated OT-I+ Thy1.1+ PKM2WT (NTC-2, red) and PKM2KO (Pkm2–8, blue) CD8+ T cells distinguished by Thy1.1 zygosity were performed into lymphodepleted C57Bl/6 mice 7 days after implantation of HKP1-ova-GFP tumors. Tumor burden was measured by bioluminescence imaging, and mice harvested and T cells subsequently phenotyped 5 and 14 days later. a, Experimental schematic. b, Bioluminescence imaging to measure tumor burden in mice harvested at day 5 (orange lines) or day 14 (purple lines) post adoptive co-transfer. c, Input proportions of PKM2WT (NTC-2, red) and PKM2KO (Pkm2–8, blue) CD8+ T cells transferred into mice. d-i, Quantification of populations of PKM2WT (red) and PKM2KO (blue) CD8+ T cells isolated from draining lymph nodes (LN) and tumors (Tu) 5 and 14 days after adoptive co-transfers. Frequencies of PKM2WT (red) and PKM2KO (blue) cells as percentages of total CD8+ T cells and donor Thy1.1+ cells (d), TNFα+ IFNγ+ proportions of PKM2WT (red) and PKM2KO (blue) cells after restimulation (f), and CD44+ CD62L- and CD44+ CD62L+ proportions (h) of PKM2WT (red) and PKM2KO (blue) were quantified. Representative contour plots from day 14 tumor samples are shown for each analysis (e, g, i), with PKM2WT in red and PKM2KO in blue. Panel (e) additionally has host population percentage in black. j-m, Quantification of populations of cells with differential TCF1 expression and quantification of transcription factor mean fluorescence intensities (MFIs) from PKM2WT (red) and PKM2KO (blue) CD8+ T cells isolated from draining lymph nodes (j) and tumors (l) 5 and 14 days after adoptive co-transfers. Representative contour plots for Tox and TCF1 staining from day 14 draining lymph nodes (k) and day 14 tumor samples (m) are shown with PKM2WT in red and PKM2KO in blue. Numbers: (d-m) n=6 biological replicates per group, experiment repeated three times. Statistics: (d-m) Multiple paired t-tests, Holm-Šídák multiple comparisons. Abbreviations: BV711, Brilliant Violet 711; BV785, Brilliant Violet 785; PE, Phycoerythrin; PCP5.5, Peridinin Chlorophyll-A Protein-Cyanine5.5; APCCy7, Allophycocyanin-Cyanine7; PECy7, Phycoerythrin-Cyanine7; AF488, Alexa Fluor 488; BV605, Brilliant Violet 605; PB, Pacific Blue.
Figure 4:
Figure 4:. PKM2 deletion generates T cells with memory signatures which enhance the efficacy of PD-1 checkpoint blockade.
a-c, Activated OT-I+ Thy1.1+ PKM2WT (NTC-2, red) or PKM2KO (Pkm2–8, blue) CD8+ T cells were adoptively transferred into lymphodepleted C57Bl/6 mice 7 days after orthotopic implantation of HKP1-ova-GFP tumors. a, Experimental schematic. b, Bioluminescence imaging to measure tumor burden. c, Overall mouse survival monitoring. d-f Activated OT-I+ Thy1.1+ PKM2WT (NTC-2, red) or PKM2KO (PKM2–8, blue) CD8+ T cells were adoptively transferred into lymphodepleted C57Bl/6 mice 7 days after orthotopic implantation of HKP1-ova-GFP tumors. 3 doses of anti-PD-1 were administered on days 10, 14, and 17 after tumor implantation. d, Experimental schematic. e, Bioluminescence imaging to measure tumor burden. f, Overall mouse survival monitoring. g-m, Transcriptomic analysis of adoptively-transferred T cells. Adoptive co-transfers of activated OT-I+ Thy1.1+ PKM2WT (NTC-2, red) or PKM2KO (PKM2–8, blue) CD8+ T cells distinguished by Thy1.1 zygosity were performed into lymphodepleted C57Bl/6 mice 7 days after implantation of HKP1-ova-GFP tumors. 3 doses of either IgG control or anti-PD-1 were administered on days 10, 14, and 17 after orthotopic implantation. T cells were subsequently sorted back from tumors based on Thy1.1, phenotyped by flow cytometry, and underwent bulk RNA sequencing. g, Experimental schematic. h, Principal component analysis of bulk RNA sequencing data before (left) and after (right) removal of mouse effect. i, Heatmap showing normalized expression of the top 25 up- and downregulated genes based on donor T cell genotype. j-m, Gene set enrichment analyses examining: signatures for effector and memory cells in PKM2KO compared with PKM2WT (j); hallmark signatures in PKM2KO compared with PKM2WT (k); hallmark signatures in anti-PD-1 treated mice compared with IgG (l); and hallmark signatures for differential effects of anti-PD-1 based on donor T cell genotype (m). Numbers: (b-c) n=13 biological replicates per group, experiment repeated twice; (e-f) n=14 biological replicates per group, experiment repeated twice. (h-m) n=3 biological replicates per group. Statistics: (b) Two-way ANOVA, Šídák’s multiple comparisons with Grubbs’ outlier test with alpha = 0.0001; (c) Log-rank Mantel-Cox test; (e) Two-way ANOVA, Šídák’s multiple comparisons with Grubbs’ outlier test with alpha = 0.0001; (f) Log-rank Mantel-Cox test; (h) PCAs generated with plotPCA in the DESeq2 package and graphed with ggplot2 in R; mouse effect removed with the removeBatchEffect method in the limma package in R; (i) DEGs calculated by using the DESeq2 package in R; (j-m) GSEA by fgsea package in R.
Figure 5:
Figure 5:. PKM2 deletion in T cells results in decreased glycolytic flux and increased pentose phosphate pathway activity.
a-b, Activated OT-I+ Thy1.1+ CD8+ T cells were electroporated with guides targeting PKM2 (PKM2–8 and PKM2–9, blue) or non-targeting controls (NTC-2 and NTC-3, red), and co-cultured with HKP1-ova-GFP tumor cells. DAPI− CD8+ Thy1.1+ T cells were subsequently sorted from co-culture at day 6 post-initial-stimulation and underwent a glycolysis stress test by sequential treatment with glucose, oligomycin, and 2-deoxyglucose (2-DG). a, Extracellular acidification rate (ECAR) measured with a Seahorse bioanalyzer. b, Calculation of different glycolytic parameters from data in (a). c-k, Activated OT-I+ Thy1.1+ CD8+ T cells were electroporated with guides targeting PKM2 (PKM2–8, blue) or non-targeting control (NTC-2, red), and co-cultured with HKP1-ova-GFP tumor cells. On day 6 post-initial-stimulation, DAPI− CD8+ Thy1.1+ T cells were sorted and labelled with 1,2 13C glucose for 2 hours, and panel of 204 polar metabolites profiled by liquid chromatography/mass spectrometry for abundance and labeling (LC/MS). Metabolite abundance was normalized by total isotope counts, with resultant data calculated as fold of average NTC-2 abundance for the given batch. c, Metaboanalyst identification of the pentose phosphate pathway as the most impacted pathway. d, Labeling pattern and quantification for glycolysis and pentose phosphate pathway metabolites after one round, with statistically significantly enriched (p<0.05) labelled metabolites shown in dark blue and labelled metabolites with p<0.1 in purple in (d). Multiple rounds of the pentose phosphate pathway can occur, with F6P isomerizing with G6P or integration of glycolysis-derived G3P, leading to different labeling patterns and isotopes. e-k, Quantification for all 13C labelled metabolites in glycolysis (e) and the pentose phosphate pathway (h), and different labelled isotopes of metabolites with significant enrichment in PKM2 knockout T cells over control: 3-phosphoglyceric acid (f), phosphoenolpyruvic acid (g), gluconic acid (i), ribose 5-phosphate (j), and sedoheptulose 7 phosphate (k). Numbers: (a-b) n=4 biological replicates per guide, experiment repeated three times; (c-k) n=9–10 biological replicates per group, aggregate of three experiments. Statistics: (b) Two-way ANOVA, Dunnett’s multiple comparisons; (e-k) Multiple unpaired t-tests. Abbreviations: G6P, glucose-6-phosphate; 6PG, 6-phosphogluconate; Ru5P, ribulose-5-phosphate; Xu5P, xylulose-5-phosphate; R5P, ribose-5-phosphate; F6P, fructose-6-phosphate; G3P, glyceraldehyde-3-phosphate; S7P, sedoheptulose-7-phosphate; FBP, fructose 1,6-bisphosphate; E4P, erythrose-4-phosphate; 1,3-BPG, 1,3-bisphosphglycerate; 3PG, 3-phosphoglycerate; PEP, phosphoenolpyruvate.
Figure 6:
Figure 6:. Pentose phosphate pathway agonism in T cells generates a memory-like phenotype distinct from that induced by blockade of glucose utilization.
a-d, Flow cytometry analysis of activated OT-I+ Thy1.1+ T cells treated with either DMSO control (red) or 3μM glucose-6-phosphate dehydrogenase agonist AG1 (blue) and co-cultured with HKP1-ova-GFP tumor cells. T cells were activated for 24 hours, treated with DMSO or AG1 for another 24 hours, then co-cultured with HKP1-ova-GFP tumor cells at a 5:1 effector:target ratio until 6 days post-initial-stimulation with continuing DMSO or AG1 treatment. a, Representative contour plots for Tox and TCF1 staining in T cells treated with DMSO (left) or AG1 (right), with gates for populations with differential TCF1 expression. b, Quantification of populations from (a) as percent of cultured CD8+ Thy1.1+ T cells in DMSO (red) and AG1 (blue) treated co-cultures. c,d, Mean fluorescence intensities (MFIs) for transcription factors (c) and effector proteins, cytokines, and PD-1 (d) in co-cultured T cells treated with DMSO (red) or AG1 (blue). e, OT-I+ Thy1.1+ CD8+ T cells were activated for 48 hours, then co-cultured with HKP1-ova-GFP tumor cells. At 6 days post-initial-stimulation, DAPI− CD8+ Thy1.1+ T cells were sorted from co-culture, pre-treated for 2 hours with either DMSO (red), 3μM AG1 (blue) or 2mM hexokinase inhibitor 2-deoxyglucose (2-DG, periwinkle), then underwent a glycolysis stress test by sequential treatment with glucose, oligomycin, and 2-DG. Plotted is the extracellular acidification rate (ECAR) measured with a Seahorse bioanalyzer. f-m, Sequencing analysis of activated OT-I+ Tcf7GFP+ T cells treated with either DMSO control (red), 3μM AG1 (blue), or 2mM 2-DG (periwinkle) and co-cultured with HKP1-ova-GFP tumor cells. T cells were activated for 24 hours, treated with DMSO, AG1, or 2-DG for another 24 hours, then co-cultured with HKP1-ova-GFP tumor cells at a 5:1 effector:target ratio with continuing drug treatment. At 6 days post-initial-stimulation, DAPI− CD8b+ Thy1.2+ T cells were sorted on eGFP for TCF1 reporter expression, and subjected to RNA sequencing. f, Representative contour plots for CD8b and eGFP expression in T cells treated with DMSO (red), AG1 (blue), or 2-DG (periwinkle), with gates for populations with differential TCF1 eGFP reporter expression based on fluorescence in activated CD8+ T cells from an OT-I+ Tcf7GFP-strain cells (far right, black). g, Quantification of populations from (f) as percent of CD8+ Thy1.2+ T cells. h, Principal component analysis of bulk RNA sequencing data from sorted T cell populations from (f). Insufficient eGFP− cells were present to be included in the sequencing analysis. i, Heatmap showing normalized expression of the top 1000 variable genes based on TCF1 eGFP reporter status. j, Volcano plot showing differential gene expression (thresholds: absolute log2 Fold Change > 1, adj. p value <0.05) based on TCF1 eGFP reporter status, with genes up in eGFP+ cells on the right. k, Venn diagrams showing overlap of genes significantly differentially expressed (absolute Fold Change > 1.5, adj. p value <0.05) in the given conditions. l, Volcano plot showing differential gene expression (thresholds: absolute log2 Fold Change > 1, adj. p value <0.05) between eGFP+ samples generated by AG1 treatment or 2-DG treatment, with genes from AG1 treated samples on the right. m, Gene set enrichment analyses examining hallmark signatures in AG1-treated eGFP+ samples compared with 2-DG-treated eGFP+ samples. Pathways up in AG1-treated samples are on the top; pathways up in 2-DG-treated samples are on the bottom. n, IPA analysis for conserved upstream regulators between AG1 vs. DMSO treated T cells from in vitro co-culture from Fig. 6F–6N, and PKM2KO vs. PKM2WT T cells from in vivo adoptive co-transfers from Fig. 4G–4M; absolute activation z-score > 2. o, Flow cytometry analysis of activated OT-I+ Thy1.1+ T cells with PKM2 knockout or control, or AG1 treatment or vehicle and co-cultured with HKP1-ova-GFP tumor cells. T cells were activated for 24 hours, either electroporated with sgRNAs or treated with DMSO or AG1 and expanded for another 24 hours, then co-cultured with HKP1-ova-GFP tumor cells at a 5:1 effector:target ratio with continuing DMSO or AG1 treatment where relevant. Mean fluorescence intensities (MFIs) for Foxo1 and Bach2 were evaluated at day 2 and day 4 post initial stimulation. Numbers: (b-d) n=4 biological replicates per group, experiment repeated four times; (e-m) n=2 biological replicates per group; (n) n=4 biological replicates per group for AG1 vs. DMSO, n=12 replicates per group for PKM2KO vs. PKM2WT; (o) n=2 biological replicates per group for day 2 and n=4 biological replicates per group for day 4, experiment repeated twice. Statistics: (b-d) Multiple unpaired t-tests, Holm-Šídák multiple comparisons; (g) One-way ANOVA, Dunnett’s multiple comparisons; (h) PCAs calculated using generated with plotPCA in the DESeq2 package in R (i,j,l) DEGs calculated using the DESeq2 package in R; (m) GSEA by fgsea package in R; (n) IPA Upstream Regulator Analysis, absolute Activation Score ≥ 2; (o) multiple unpaired t-tests, Holm-Šídák multiple comparisons. Abbreviations: APC, Allophycocyanin; PE, Phycoerythrin; PCP5.5, Peridinin Chlorophyll-A Protein-Cyanine5.5; BV605, Brilliant Violet 605; AF488, Alexa Fluor 488; PECy7, Phycoerythrin-Cyanine7; PB, Pacific Blue; FITC, Fluorescein isothiocyanate; PE594, PE-Dazzle 594; eGFP, enhanced Green Fluorescent Protein.
Figure 7:
Figure 7:. Pentose phosphate pathway agonism results in tumor control in murine and human model systems.
a-f, OT-I+ Thy1.1+ CD8+ T cells were activated for 1 day, treated with either DMSO or 3 μM AG1 for 3 days, then adoptively transferred into lymphodepleted C57Bl/6 mice 7 days after orthotopic implantation of HKP1-ova-GFP tumors. 3 doses of anti-PD-1 were administered on days 10, 14, and 17 after tumor implantation. Phenotype of treated adoptively transferred T cells was evaluated, and tumor burden and overall survival monitored. a, Experimental schematic. b-c, Flow cytometric analyses of transferred T cells for CD44 and CD62L expression (b) and Tox and TCF1 expression (c). d-e, Bioluminescence imaging to measure average tumor burden (d) or tumor burden in individual mice (e) in mice which received DMSO-pretreated T cells (red) or AG1-pretreated T cells (blue). f, Overall mouse survival monitoring in mice which received DMSO-pretreated T cells (red) or AG1-pretreated T cells (blue). g-j, Patient derived tumor organoids (PDTOs) were generated from NSCLC samples from patients. Autologous T cells were expanded from matched peripheral blood mononuclear cells (PBMCs) by rapid expansion over two weeks with anti-human CD3 (OKT3), human IL-2, and irradiated allogenic PBMC feeder cells. During rapid expansion, T cells were treated with either DMSO control or 3μM glucose-6-phosphate dehydrogenase agonist AG1. After expansion, T cells were co-cultured with PDTOs and IL-2 to provide tumor-specific T cell stimulation in the presence. After two weeks, T cells were restimulated with fresh PDTOs, and T cell cytotoxic capacity tested by IFNγ production upon restimulation or tumor killing by PDTO cleaved caspase-3 activation. g, Experimental schematic. h, Quantification of TCF1 expression after rapid expansion as mean fluorescence intensity fold change over DMSO control, with representative histogram on the right. i, Quantification of IFNγ+ CD8+ T cells upon restimulation. j, Quantification of apoptotic PDTOs (CellTrace Far Red+ NucView488+ events) monitored over 12 hours. Numbers: (d-f) n=20 biological replicates per group, experiment repeated twice; (g-j) n=4 patients, 3 wells per patient. Statistics: (d) Two-way ANOVA, Šídák’s multiple comparisons with Grubbs’ outlier test with alpha = 0.0001; (f) Log-rank Mantel-Cox test; (h-j) paired t-test. Abbreviations: AF488, Alexa Fluor 488; PECy7, Phycoerythrin-Cyanine7; APC, Allophycocyanin; PE, Phycoerythrin.

References

    1. Pardoll D. M. The blockade of immune checkpoints in cancer immunotherapy. Nat Rev Cancer 12, 252–264 (2012). 10.1038/nrc3239 - DOI - PMC - PubMed
    1. Sharma P. & Allison J. P. Dissecting the mechanisms of immune checkpoint therapy. Nat Rev Immunol 20, 75–76 (2020). 10.1038/s41577-020-0275-8 - DOI - PubMed
    1. Ribas A. & Wolchok J. D. Cancer immunotherapy using checkpoint blockade. Science 359, 1350–1355 (2018). 10.1126/science.aar4060 - DOI - PMC - PubMed
    1. Markowitz G. J. et al. Immune reprogramming via PD-1 inhibition enhances early-stage lung cancer survival. JCI Insight 3 (2018). 10.1172/jci.insight.96836 - DOI - PMC - PubMed
    1. Philip M. & Schietinger A. CD8(+) T cell differentiation and dysfunction in cancer. Nat Rev Immunol 22, 209–223 (2022). 10.1038/s41577-021-00574-3 - DOI - PMC - PubMed

Publication types