[Preprint]. 2023 Sep 22:2023.09.21.558869.
doi: 10.1101/2023.09.21.558869.

Bypassing spike sorting: Density-based decoding using spike localization from dense multielectrode probes

Affiliations

Bypassing spike sorting: Density-based decoding using spike localization from dense multielectrode probes

Yizi Zhang et al. bioRxiv. .

Update in

Abstract

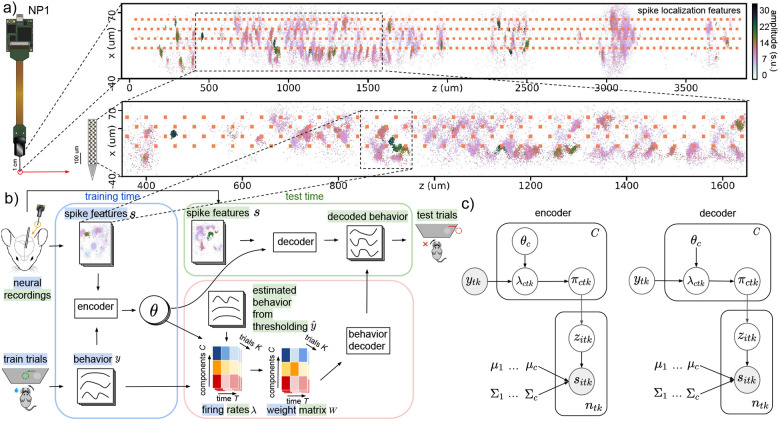
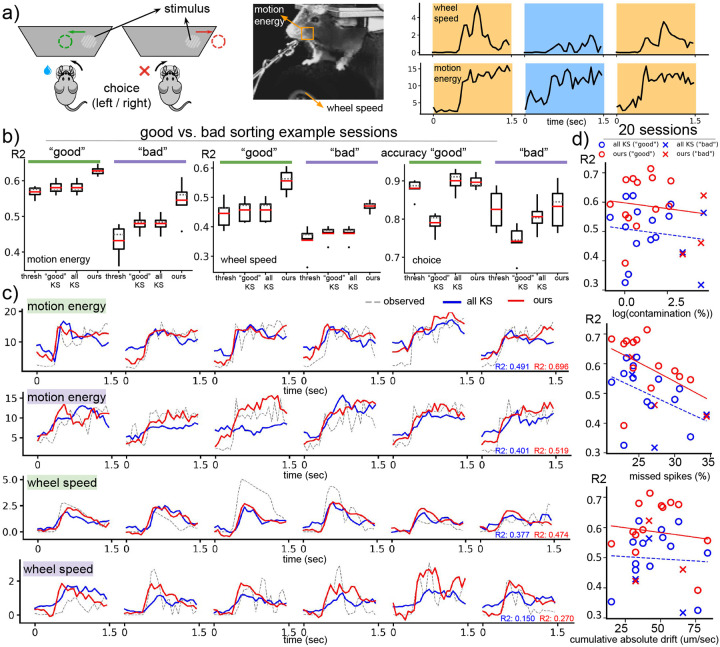
Neural decoding and its applications to brain computer interfaces (BCI) are essential for understanding the association between neural activity and behavior. A prerequisite for many decoding approaches is spike sorting, the assignment of action potentials (spikes) to individual neurons. Current spike sorting algorithms, however, can be inaccurate and do not properly model uncertainty of spike assignments, therefore discarding information that could potentially improve decoding performance. Recent advances in high-density probes (e.g., Neuropixels) and computational methods now allow for extracting a rich set of spike features from unsorted data; these features can in turn be used to directly decode behavioral correlates. To this end, we propose a spike sorting-free decoding method that directly models the distribution of extracted spike features using a mixture of Gaussians (MoG) encoding the uncertainty of spike assignments, without aiming to solve the spike clustering problem explicitly. We allow the mixing proportion of the MoG to change over time in response to the behavior and develop variational inference methods to fit the resulting model and to perform decoding. We benchmark our method with an extensive suite of recordings from different animals and probe geometries, demonstrating that our proposed decoder can consistently outperform current methods based on thresholding (i.e. multi-unit activity) and spike sorting. Open source code is available at https://github.com/yzhang511/density_decoding.


Figures

Figure 1:
Figure 1:. Decoding paradigm and graphical model.
(a) Spike localization features, (x, z), the locations of spikes along the width and depth of the NP1 probe, and waveform features, a, the maximum peak-to-peak (max ptp) amplitudes of spikes. Amplitude is measured in standard units (s.u.). Spike features from the entire probe are shown, and we focus on a specific segment of the probe. (b) During the training phase, the encoder takes the observed spike features s and behavior y from the train trials as inputs and then outputs the variational parameters θ which control the dependence of the firing rate λ on the behavior y. At test time, the decoder utilizes the learned model parameters θ obtained from the encoder and the observed spike features s from the test trials to predict the corresponding behavior in the test trials. To ensure reliable decoding of behaviors, we initially calculate the λ during training using the learned θ and observed behaviors y from the train trials. Then, we compute the λ during test time using the learned θ and the estimated behavior y^ obtained through multi-unit thresholding from the test trials. Finally, we generate the weight matrix W for both the train and test trials as input to the final behavior decoder, e.g., linear regression or neural networks (Glaser et al. 2020; Livezey et al. 2021). (c) In the encoder, the firing rates of each MoG component λctk are modulated by the observed behavior ytk in the train trials. This modulation affects the MoG mixing proportion πctk, which in turn determines the spike assignment zitk that generates the observed spike features sitk in the train trials. In the decoder, the behavior ytk in the test trials is unknown and considered as a latent variable to be inferred. The decoder uses the observed spike features sitk from the test trials along with the fixed model parameters θc learned by the encoder to infer the latent behavior ytk.
Figure 2:
Figure 2:. Density-based decoding is robust to varying levels of spike sorting quality.
(a) We decode various behaviors including choice, motion energy and wheel speed. In the experimental setup, the mouse detects the presence of a visual stimulus to their left or right and indicates the perceived location (choice) by turning a steering wheel in the corresponding direction. Motion energy is calculated within a square region centered around the mouse’s whiskers. The example behavior traces are distinguished by different colors for each trial. (b) We compare decoders using two experimental sessions with “good” sorting quality (represented by the color green) and two sessions with “bad” sorting quality (represented by the color purple) based on IBL’s quality metrics. The box plots display various statistical measures including the minimum, maximum, first and third quartiles, median (indicated by a gray dashed line), mean (indicated by a red solid line), and outliers (represented by dots). These decoding metrics are obtained from a 5-fold CV and are averaged across both “good” and “bad” sorting example sessions. (c) We compare the traces decoded by spike-sorted decoders and our method on example sessions with “good” sorting quality (indicated by green) and “bad” sorting quality (indicated by purple). (d) The scatter plots depict the decoding quality of motion energy, measured by R2, with respect to various spike-sorting quality metrics. Each point represents one of the 20 IBL sessions, and different colors and shapes are used to distinguish between the type of decoder and sorting quality. The sorting quality metrics include “contamination,” which estimates the fraction of unit contamination (Hill et al. 2011), “drift,” which measures the absolute value of the cumulative position change in micrometers per second (um/sec) of a given KS unit, and “missed spikes,” which approximates the fraction of missing spikes from a given KS unit (Hill et al. 2011). These metrics are averaged across all KS units in a session. The scatter plots demonstrate that decoding quality tends to decrease when sorting quality is compromised. However, our method outperforms spike-sorted decoders even in the presence of these sorting issues.
Figure 3:
Figure 3:. Decoding comparisons broken down by brain regions.
(a) We decoded 20 IBL datasets acquired using NP1 probes which were inserted into mice performing a behavioral task. The locations of the probe insertions in the mouse brain and the corresponding brain parcellations along the NP1 probe are shown. We compared the performance of all decoders across different recorded brain regions. For the “All” region, spikes from all brain regions were utilized for decoding. In contrast, for the “PO,” “LP,” “DG,” “CA1,” and “VISa” regions, only spikes from the respective regions were used for decoding. The decoding performance were summarized using box plots showing metrics obtained through a 5-fold CV and averaged across 20 IBL sessions. We observe a higher accuracy from PO, LP, and VISa regions when decoding choice; decoding results are more comparable across regions for the continuous behavioral variables. Our proposed decoder consistently achieves higher accuracy in decoding the continuous variables. (b) We use scatter plots to quantify the relationship between decoding quality, measured by R2 from decoding motion energy, and the number of components used for decoding. In the case of “all KS” and “good KS”, the number of components corresponds to the number of KS units. For our method, the number of components refers to the number of MoG components used. For all methods, the decoding performance is higher when using more components (in the regime of a small number of components). Our decoding method consistently outperforms spike-sorted decoders based on KS 2.5 while tending to need fewer components.
Figure 4:
Figure 4:. Decoding performance generalizes across different animals and probe geometry.
(a) We compare all decoders on a NP2.4 dataset using box plots showing performance metrics obtained from a 5-fold CV. Our method achieves much higher performance than all other decoders on continuous behavior decoding with slightly worse choice decoding than the spike-sorted decoder. (b) We utilize data from a single NP1-NHP recording session to decode the reaching force of a monkey engaged in a path-tracking (pacman) behavioral task. The decoders are evaluated through both quantitative analysis (box plots) and qualitative examination of the decoded traces. Each trial within the NP1-NHP recording has a duration of 9.85 seconds. Our method outperforms all other decoders on predicting the arm force.
Figure 5:
Figure 5:. Computation time measured relative to real-time.
“Preprocessing” includes destriping, required by all decoders (IBL et al. 2022). “Total after preprocess” includes spike subtraction, denoising, localization, registration and density-decoding. The computation time of the clusterless point process decoder (Denovellis et al. 2021) is also provided.

References

    1. Blei D. M., Kucukelbir A., and McAuliffe J. D. (2017). “Variational inference: A review for statisticians”. In: Journal of the American statistical Association 112.518, pp. 859–877.
    1. Boussard J. et al. (2021). “Three-dimensional spike localization and improved motion correction for Neuropixels recordings”. In: Advances in Neural Information Processing Systems 34, pp. 22095–22105.
    1. Boussard J. et al. (2023). “DARTsort: A modular drift tracking spike sorter for high-density multi-electrode probes”. In: bioRxiv, p. 553023.
    1. Buccino A. P. et al. (2020). “SpikeInterface, a unified framework for spike sorting”. In: Elife 9, e61834. - PMC - PubMed
    1. Buccino A. P., Garcia S., and Yger P. (2022). “Spike sorting: new trends and challenges of the era of high-density probes”. In: Progress in Biomedical Engineering.

Publication types