[Preprint]. 2023 Sep 15:rs.3.rs-3263501.
doi: 10.21203/rs.3.rs-3263501/v1.

Fibrinolytic-deficiencies predispose hosts to septicemia from a catheter-associated UTI

Affiliations

Fibrinolytic-deficiencies predispose hosts to septicemia from a catheter-associated UTI

Jonathan J Molina et al. Res Sq. .

Update in

Abstract

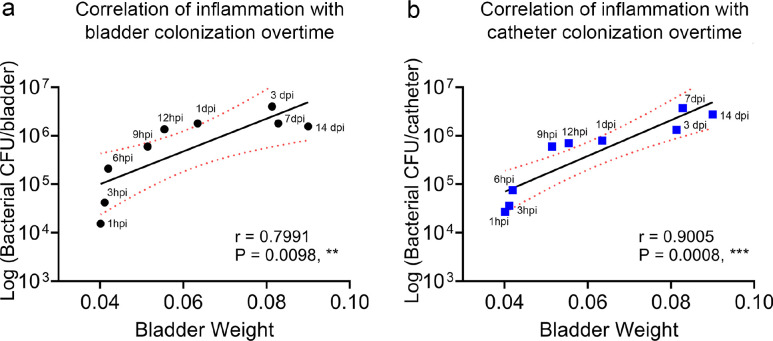
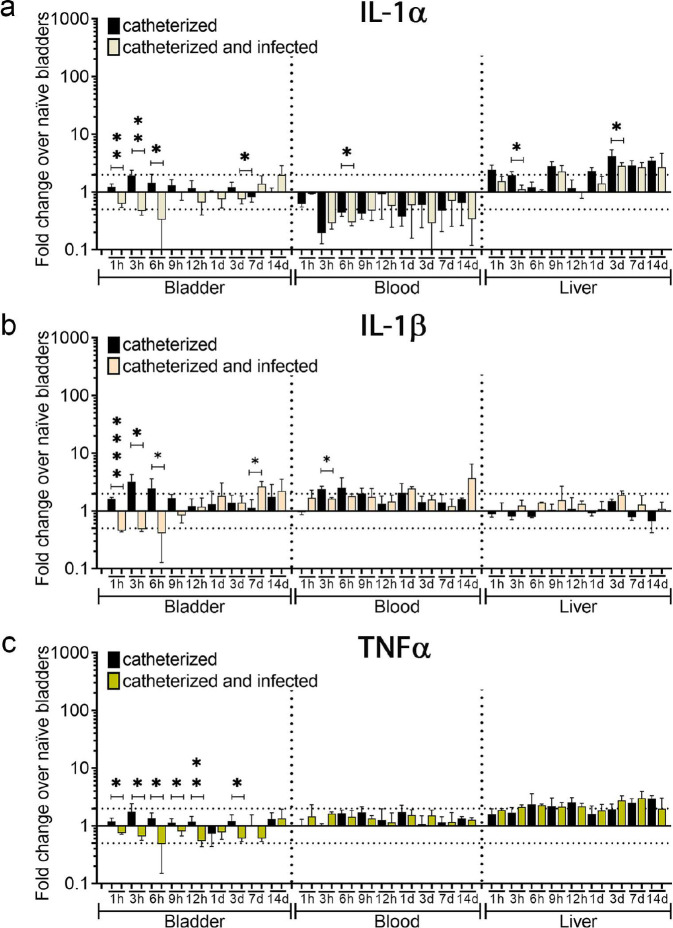
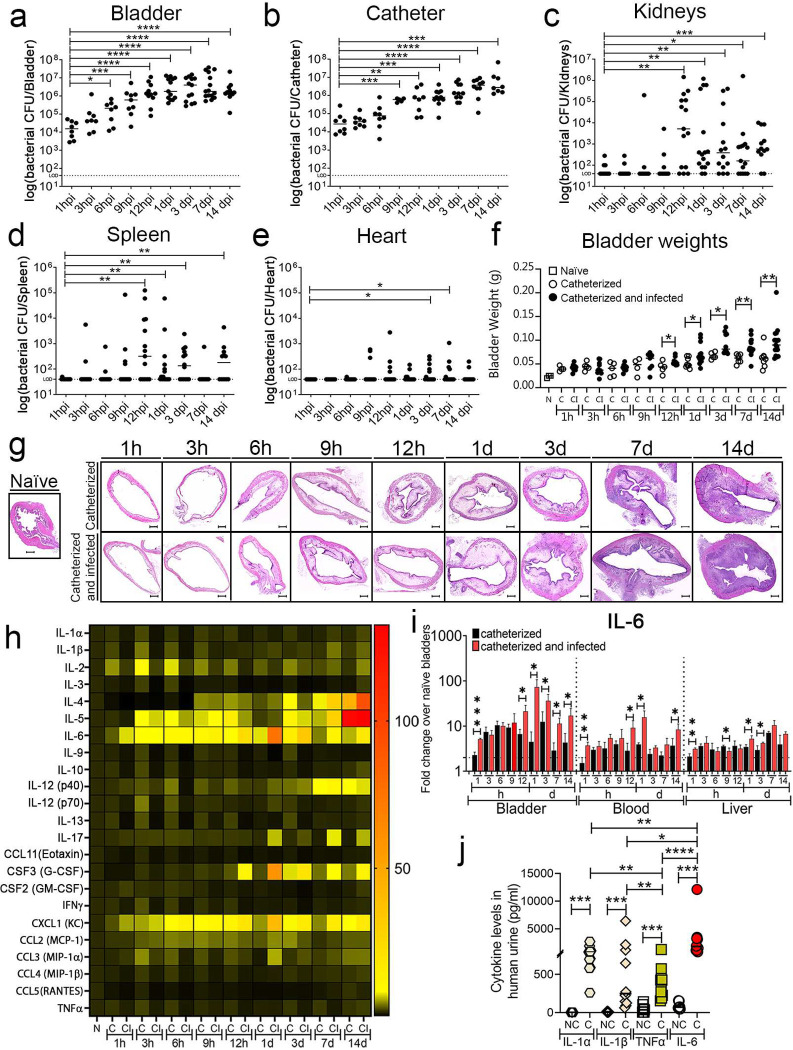
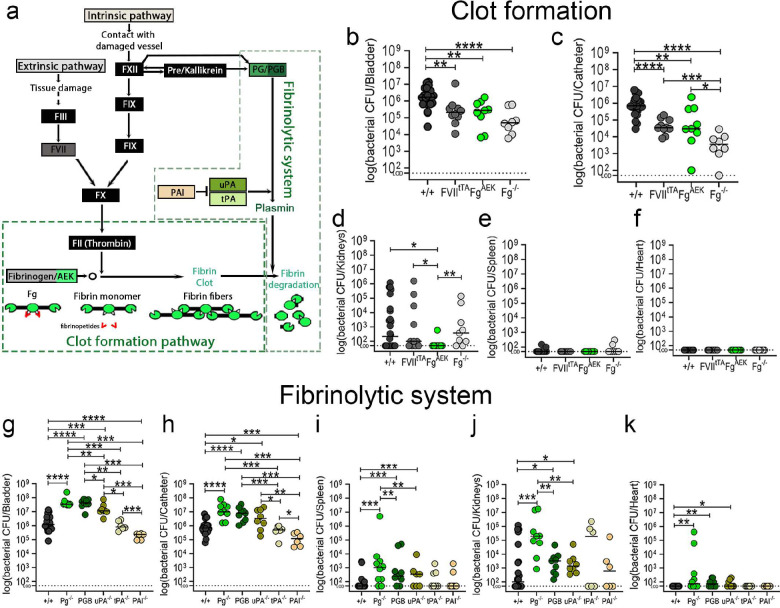
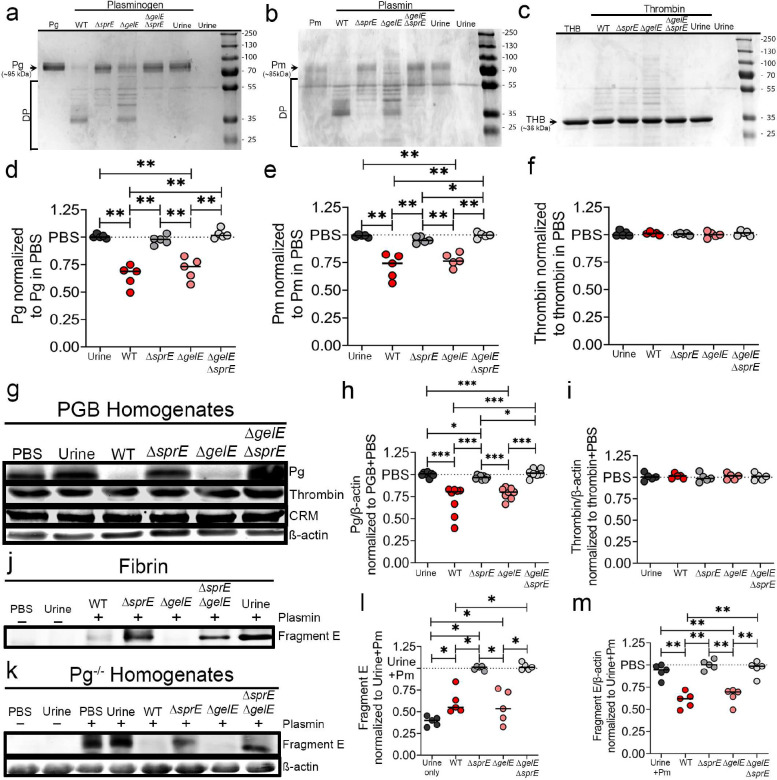
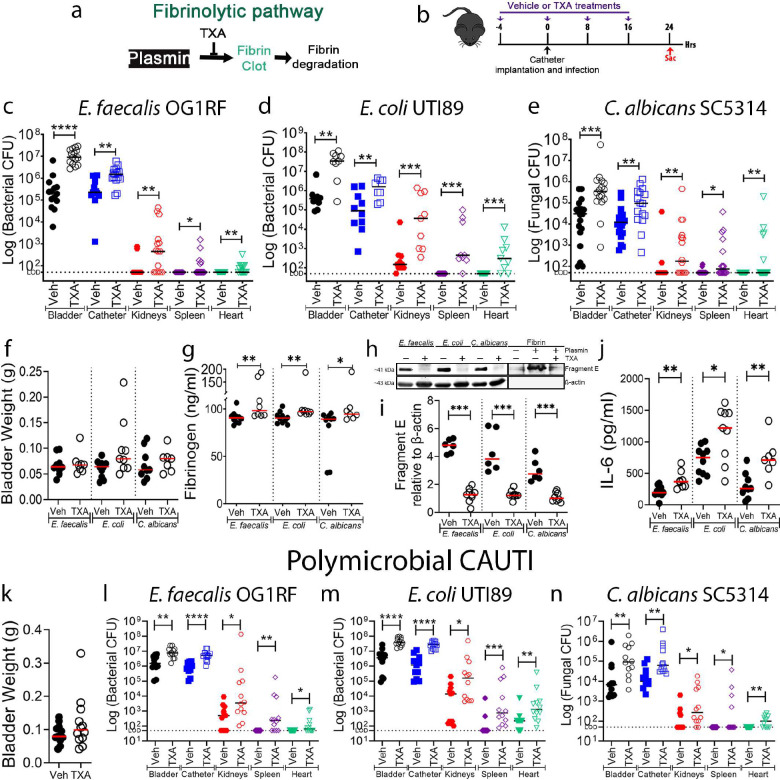
Catheter-associated urinary tract infections (CAUTIs) are amongst the most common nosocomial infections worldwide and are difficult to treat due to multi-drug resistance development among the CAUTI-related pathogens. Importantly, CAUTI often leads to secondary bloodstream infections and death. A major challenge is to predict when patients will develop CAUTIs and which populations are at-risk for bloodstream infections. Catheter-induced inflammation promotes fibrinogen (Fg) and fibrin accumulation in the bladder which are exploited as a biofilm formation platform by CAUTI pathogens. Using our established mouse model of CAUTI, we identified that host populations exhibiting either genetic or acquired fibrinolytic-deficiencies, inducing fibrin deposition in the catheterized bladder, are predisposed to severe CAUTI and septicemia by diverse uropathogens in mono- and poly-microbial infections. Furthermore, we found that E. faecalis, a prevalent CAUTI pathogen, uses the secreted protease, SprE, to induce fibrin accumulation and create a niche ideal for growth, biofilm formation, and persistence during CAUTI.

Keywords: C. albicans; CAUTI; E. coli; E. faecalis; bacterial proteases; dissemination; fibrin(ogen); fibrinolysis; inflammation; polymicrobial.


Conflict of interest statement

Declaration of interests: The authors declare no competing financial interests.

Figures

Extended Data Figure 1.
Extended Data Figure 1.. Catheter-induced inflammation correlates with pathogen colonization overtime.
Pearson’s correlation statistical analysis was used to quantify the association between the catheter-induced bladder inflammation and pathogen colonization in the bladder (a) or catheter (b) overtime. For this test, median bladder weights values from catheterized and infected mice and the median values of the CFUs of bladders or catheters were used to perform this test. r, Pearson’s correlation coefficient. *, P < 0.05 was considered statistically significant. **, P < 0.005; ***, P < 0.0005.
Extended Data Figure 2.
Extended Data Figure 2.. Inflammatory cytokines of the catheterized bladder.
Analysis of individual cytokine levels in the catheterized bladder (with or without E. faecalis infection) that increased, decreased then decreased, were repressed, or had no change. The horizontal broken line represents 2-fold change cytokine levels compared with naïve control mice. Values represent means ± SEM. The Mann-Whitney U test was used; *, P < 0.05 was considered statistically significant. **, P < 0.005; ***, P < 0.0005; ****, P<0.0001. Animals that lost the catheter were not included in this work.
Extended Data Figure 3.
Extended Data Figure 3.. Comparative analysis of 1L-1α, IL-1β, and TNFα levels.
1L-1α (a), IL-1β (b), and TNFα (c) levels in the catheterized bladder (with or without infection), bloodstream, and liver. The horizontal broken line represents twofold change cytokine levels compared with naïve control mice over a 2-fold change. Values represent means ± SEM. Values represent median. The Mann-Whitney U test was used; *, P < 0.05 was considered statistically significant. **, P < 0.005; ****, P<0.0001.
Extended Data Figure 4.
Extended Data Figure 4.. Protein-protein interactions and summary of transcriptional regulatory analysis.
76 shared mouse and human catheter proteins from Fig. 2 were analyzed on metascape.org. (a) Molecular Complex Detection (MCODE) components identified from protein-protein interaction enrichment analysis. Generated networks were modified using Cytoscape network analysis and clusters of interactions were labelled by the top descriptive gene ontology for each protein-protein interaction. (b) Summary of enrichment analysis of transcriptional regulatory relationships unraveled by sentence base text mining (TRRUST). Top Predicted transcriptional regulators were plotted based on −log10(P) values.
Extended Data Figure 5.
Extended Data Figure 5.. Fibrinolytic-deficiencies predispose hosts to severe CAUTI and septicemia by diverse uropathogens in mono- and poly-microbial infections.
Defective fibrinolysis drives extravascular fibrin formation predisposing hosts to severe catheter associated urinary tract infections and systemic dissemination by prevalent CAUTI pathogens. E. coli, E. faecalis, and C. albicans each utilize fibrin for biofilm formation and virulence. Defective fibrinolysis results from congenital deficiencies, pharmacological inhibition through tranexamic acid, or by pathogen-secreted proteases such as E. faecalis’ serine protease SprE.
Figure 1.
Figure 1.. E. faecalis infection and inflammation progression during urinary catheterization.
(a-e) E. faecalis establishes persistent colonization overtime. Mice were catheterized and infected with 2×10⁷ CFU of E. faecalis OG1RF. Enterococcal colonization of organs and catheters were assessed by quantifying bacterial burden. (f) Bladder weights of naïve (non-implanted control) mice and implanted mice in the presence or absence of the E. faecalis at the indicated times. (g) Bladder sections were stained with H&E to compare inflammation from catheterization in the presence or absence of the pathogen overtime (scale bars: 500 μm). (h) Heatmap represents catheterized bladder cytokines fold changes over naïve bladder in the presence or absence of the E. faecalis OG1RF infection at the indicated times. (i) IL-6 analysis levels in the catheterized bladder (with or without infection), bloodstream, and liver. The horizontal broken line represents twofold change cytokine levels compared with naïve control mice over a 2-fold change. (j) Comparison of the IL-1α, IL-1β, IL-6, and TNFα levels in urine from patients catheterized for 24h and healthy donors (NC; non-catheterized). Values represent means ± SEM. Values represent median. The Mann-Whitney U test was used; *, P < 0.05 was considered statistically significant. **, P < 0.005; ***, P < 0.0005; ****, P<0.0001. The horizontal bar represents the median value. The horizontal broken line represents the limit of detection of viable bacteria. LOD; limit of detection. Infections were done in three independent experiments with n = 6 mice for each one, and data are shown as the log (bacterial CFU/organ or catheter). Animals that lost the catheter were not included in this work.
Figure 2.
Figure 2.. Proteomic analysis of the proteins deposited on urinary catheters retrieved from patients and mice.
(a) Venn diagram comparing deposited proteins on urinary catheters retrieved from patients and mice catheterized with a dwell time of 1 day using E Venn online software. Red rectangles represent inflammatory and immune proteins, green circles represent coagulation cascade proteins, purple ovals represent complement cascade proteins, while black dots represent other proteins. (b) Fg levels in acute and prolonged catheterized bladder in the absence or presence of E. faecalis OG1RF infection. (c) Metascape analysis showing the top significant pathways shared proteins found on mice and human catheters. Metascape network analysis and clusters of interactions of the top significant pathways were visualized with Cytoscape.
Figure 3.
Figure 3.. Impairment of the fibrinolysis enhances enterococcal colonization and systemic dissemination.
(a) Coagulation cascade diagram (color boxes correlates with mouse strains used in this study). C57BL/6 wild type (WT) mice and transgenic coagulation mutants in C57BL/6-background looking at cloth formation pathway (b-f) or fibrinolytic system (g-k) were catheterized and infected with ~2×10⁷ CFU of E. faecalis OG1RF. After 24 hpi, bacterial burdens in bladder tissues (a,g), catheters (b,h), kidneys (c,i), spleen (d,j), and hearts (f,k). Values represent means ± SEM. The Mann-Whitney U test was used; *, P < 0.05 was considered statistically significant. **, P < 0.005; ***, P < 0.0005; ****, P<0.0001. The horizontal bar represents the median value. The horizontal broken line represents the limit of detection of viable bacteria. LOD; limit of detection. For CFU enumeration, infections were done in at least three independent experiments with n = 3–6 mice depending on the genotype, and data are shown as the log (bacterial CFU/organ or catheter). Animals that lost the catheter were not included in this work.
Figure 4.
Figure 4.. SprE, an E. faecalis secreted protease, selectively degrades plasminogen and plasmin, inactivating plasmin proteolytic activity against fibrin.
(a-c) SDS-PAGE analysis of the proteolytic activity of E. faecalis WT and protease mutants’ cell-free supernatants against purified (a) plasminogen, (b) plasmin, or (c) thrombin and their corresponding degradation quantification by densitometry (d-f). (g) 24 hrs catheterized PGB bladder homogenates were incubated with E. faecalis WT and protease mutants’ cell-free supernatants and proteolytic activity against plasminogen and thrombin was monitored by Western blots. (h-i) Densitometry analysis of the Pg and thrombin degradation by bacterial supernatants performed in (g). (j-m) SprE degradation of plasmin results in inhibition of fibrinolysis. To test this, supernatants E. faecalis grown in urine were filtered and concentrated, then incubated plasmin was for 4 hrs at 37°C; then each mixture was incubated with purified (j) fibrin or (k) Pg−/− mouse bladder homogenates from 24 hrs catheterized non-infected mice. Degradation of fibrin was monitored by detection of Fragment E in incubation with fibrin or bladder homogenates by SDS-PAGE or western blot analysis, respectively (j, k). Fragment E quantification by densitometry obtained in (l, m). CRM, cross reactive material. β-actin was used as loading and normalization control. Values represent means ± SEM. The Mann-Whitney U test was used; *, P < 0.05 was considered statistically significant. **, P < 0.005; ***, P < 0.0005. The horizontal bar represents the median value.
Figure 5.
Figure 5.. Host fibrinolytic deficiency rescued E. faecalis ΔgelsprE colonization deficiency, enhance colonization of uropathogen E. coli UTI89, promoting systemic dissemination.
(a-e) C57BL/6 WT and coagulation deficient mice were infected with ~2×10⁷ CFU of E. faecalis OG1RFΔgelEΔsprE or (f-j) uropathogenic E. coli UTI89. After 24 hpi, bacterial burdens in bladder tissues (a,f), catheters (b,g), kidneys (c,h), spleen (d,i), and hearts (e,j). Values represent means ± SEM. The Mann-Whitney U test was used; *, P < 0.05 was considered statistically significant. **, P < 0.005; ***, P < 0.0005; ****, P<0.0001. The horizontal bar represents the median value. The horizontal broken line represents the limit of detection of viable bacteria. LOD; limit of detection. For CFU enumeration, infections were done at least in 3 independent experiments with n = 3–6 mice depending on the mouse genotype, and data are shown as the log(bacterial CFU/organ or catheter). Animals that lost the catheter were not included in this work.
Figure 6.
Figure 6.. Pharmacological inhibition of plasmin proteolytic activity inhibits fibrin degradation and further enhances pathogen burden and dissemination of the top three CAUTI pathogens, E. faecalis, E. coli, and C. albicans, during mono- or polymicrobial infections.
(a) Tranexamic acid (TXA) targets plasmin, thus inhibiting the fibrinolytic cascade. (b) Treatment timeline. (c-e) C57BL/6 WT mice were infected with ~2×10⁷ CFU of E. faecalis OG1RF (c), ~2×10⁷ CFU of E. coli UTI89 (d), or ~1×10⁶ CFU of C. albicans SC5314 (e) and dosed with either TXA (100 mg/mL i.p.) or vehicle (PBS). After 24 hpi, pathogen burdens were enumerated in bladder tissues, catheters, kidney pairs, spleens, and hearts. (f) Bladder edema was assessed after tissue harvest by weighing bladders. (g-i) Bladder homogenates were diluted (1:10) and analyzed for (g) fibrinogen, (h-i) fibrin degradation, and (j) IL-6. Fibrinogen and IL-6 levels were analyzed via ELISA. Fibrin degradation in the bladder homogenates was analyzed by measuring fragment E production via western blot and β-actin was used as loading and normalization control (h) and quantified by densitometry (i). (k-n) Polymicrobial CAUTI with E. faecalis, E. coli, and C. albicans. (k) Bladder edema of mice treated with TXA or vehicle during polymicrobial CAUTI. (l-n) C57BL/6 WT mice were infected with ~2×10⁷ CFU of E. faecalis OG1RF (l), ~2×10⁷ CFU of E. coli UTI89 (m), and ~1×10⁶ CFU of C. albicans SC5314 (n) and dosed with either TXA (100 mg/mL i.p.) or vehicle (PBS). Pathogen burden was assessed after 24 hpi in bladder tissues, catheters, kidney pairs, spleens, and hearts. Values represent means ± SEM. The Mann-Whitney U test was used; *, P < 0.05 was considered statistically significant. **, P < 0.005; ***, P < 0.0005; ****, P<0.0001. The horizontal bar represents the median value. The horizontal broken line represents the limit of detection of viable pathogen. LOD; limit of detection. For CFU enumeration, infections were done at least in 3 independent experiments with n = 3–6 mice each one, and data are shown as the log(microbial CFU/organ or catheter). Animals that lost the catheter were not included in this work.

References

    1. Haider M. Z. & Annamaraju P. in StatPearls (2022).
    1. Armbruster C. E., Brauer A. L., Humby M. S., Shao J. & Chakraborty S. Prospective assessment of catheter-associated bacteriuria clinical presentation, epidemiology, and colonization dynamics in nursing home residents. Jci Insight 6, doi:10.1172/jci.insight.144775 (2021). - DOI - PMC - PubMed
    1. Andersen M. J. & Flores-Mireles A. L. Urinary Catheter Coating Modifications: The Race against Catheter-Associated Infections. Coatings 10, doi:ARTN 2310.3390/coatings10010023 (2020).
    1. Nicolle L. E. Catheter associated urinary tract infections. Antimicrob Resist Infect Control 3, 23, doi:10.1186/2047-2994-3-23 (2014). - DOI - PMC - PubMed
    1. Manohar J. et al. Profiles of the bacterial community in short-term indwelling urinary catheters by duration of catheterization and subsequent urinary tract infection. Am J Infect Control 48, 178–183, doi:10.1016/j.ajic.2019.08.005 (2020). - DOI - PMC - PubMed

METHODS REFERENCES

    1. Conover M. S., Flores-Mireles A. L., Hibbing M. E., Dodson K. & Hultgren S. J. Establishment and Characterization of UTI and CAUTI in a Mouse Model. J Vis Exp, e52892, doi:10.3791/52892 (2015). - DOI - PMC - PubMed
    1. Walker J. N. et al. High-resolution imaging reveals microbial biofilms on patient urinary catheters despite antibiotic administration. World J Urol 38, 2237–2245, doi:10.1007/s00345-019-03027-8 (2020). - DOI - PMC - PubMed
    1. Walker J. N. et al. Catheterization alters bladder ecology to potentiate Staphylococcus aureus infection of the urinary tract. P Natl Acad Sci USA 114, E8721–E8730, doi:10.1073/pnas.1707572114 (2017). - DOI - PMC - PubMed
    1. Chen T., Zhang H., Liu Y., Liu Y. X. & Huang L. EVenn: Easy to create repeatable and editable Venn diagrams and Venn networks online. J Genet Genomics 48, 863–866, doi:10.1016/j.jgg.2021.07.007 (2021). - DOI - PubMed
    1. Shannon P. et al. Cytoscape: a software environment for integrated models of biomolecular interaction networks. Genome Res 13, 2498–2504, doi:10.1101/gr.1239303 (2003). - DOI - PMC - PubMed

Publication types