[Preprint]. 2023 Sep 20:rs.3.rs-3311459.
doi: 10.21203/rs.3.rs-3311459/v1.

Caloric restriction promotes beta cell longevity and delays aging and senescence by enhancing cell identity and homeostasis mechanisms

Affiliations

Caloric restriction promotes beta cell longevity and delays aging and senescence by enhancing cell identity and homeostasis mechanisms

Cristiane Dos Santos et al. Res Sq. .

Update in

Abstract

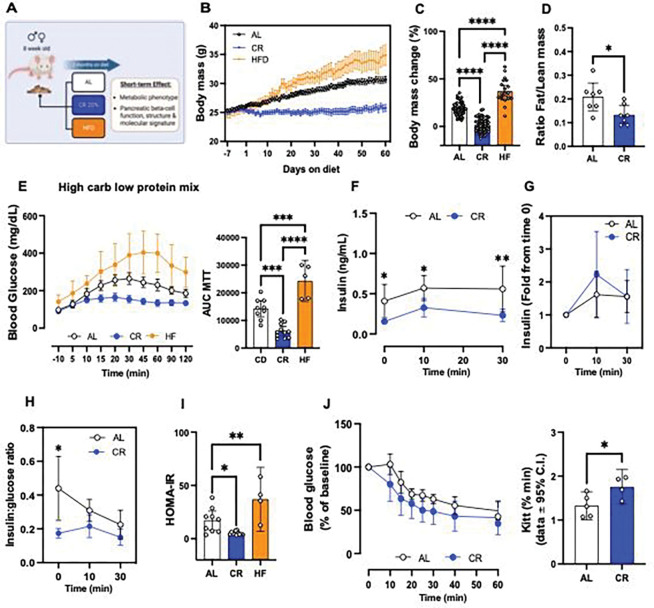
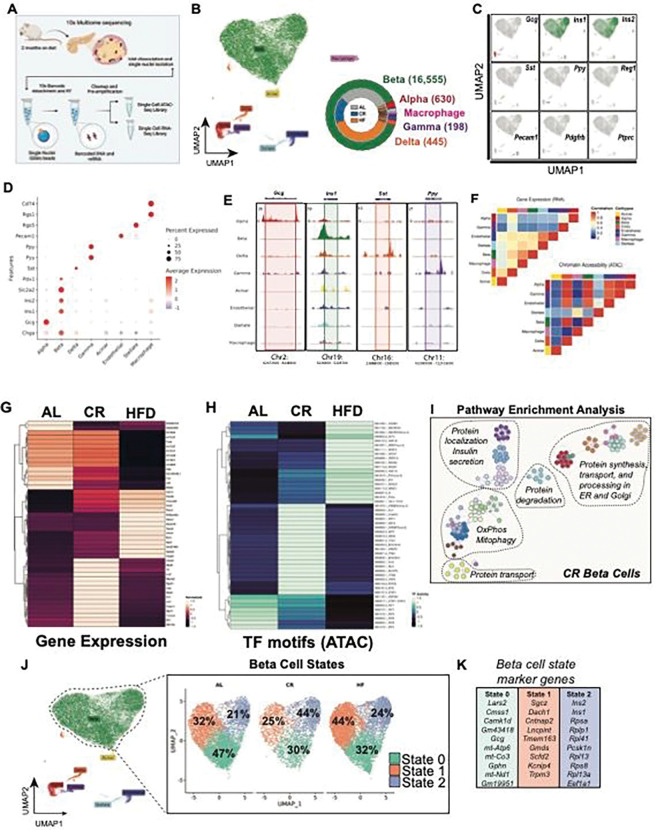
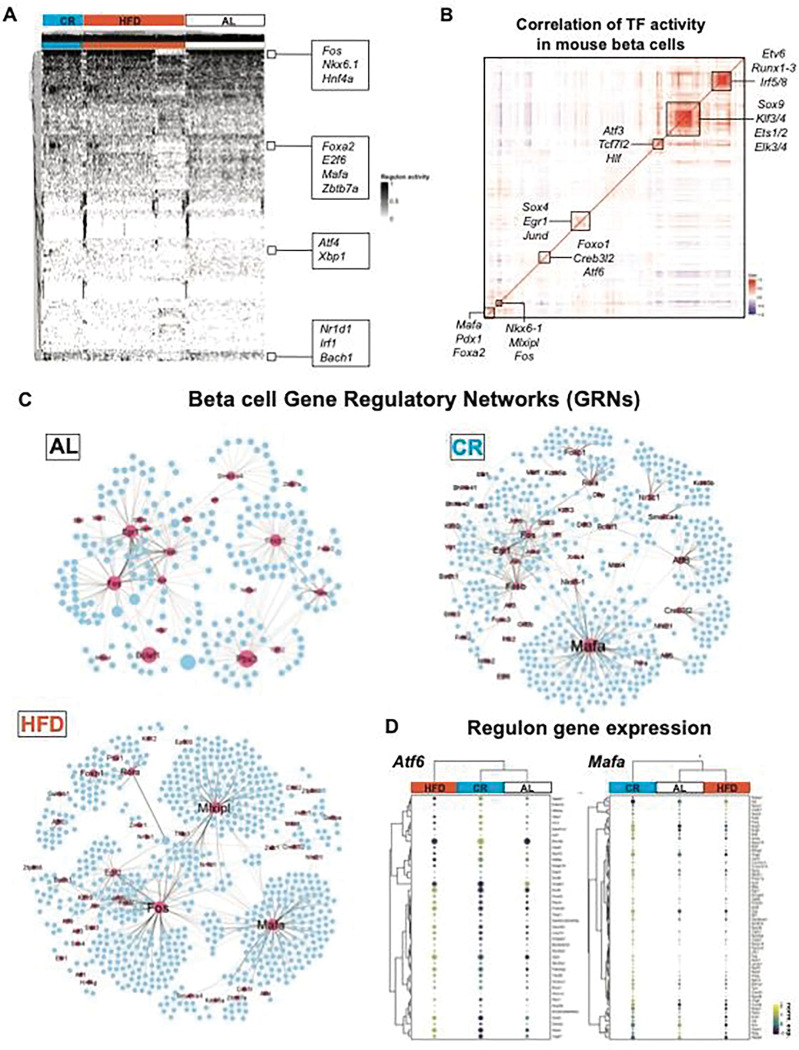
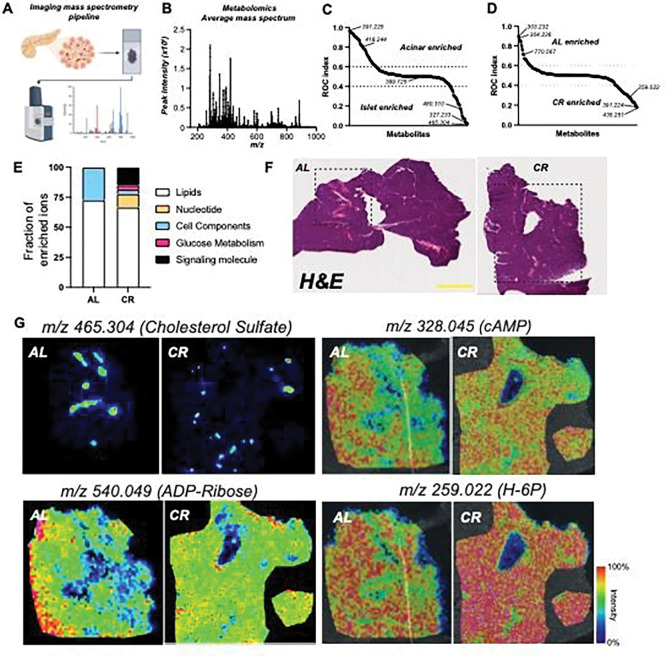
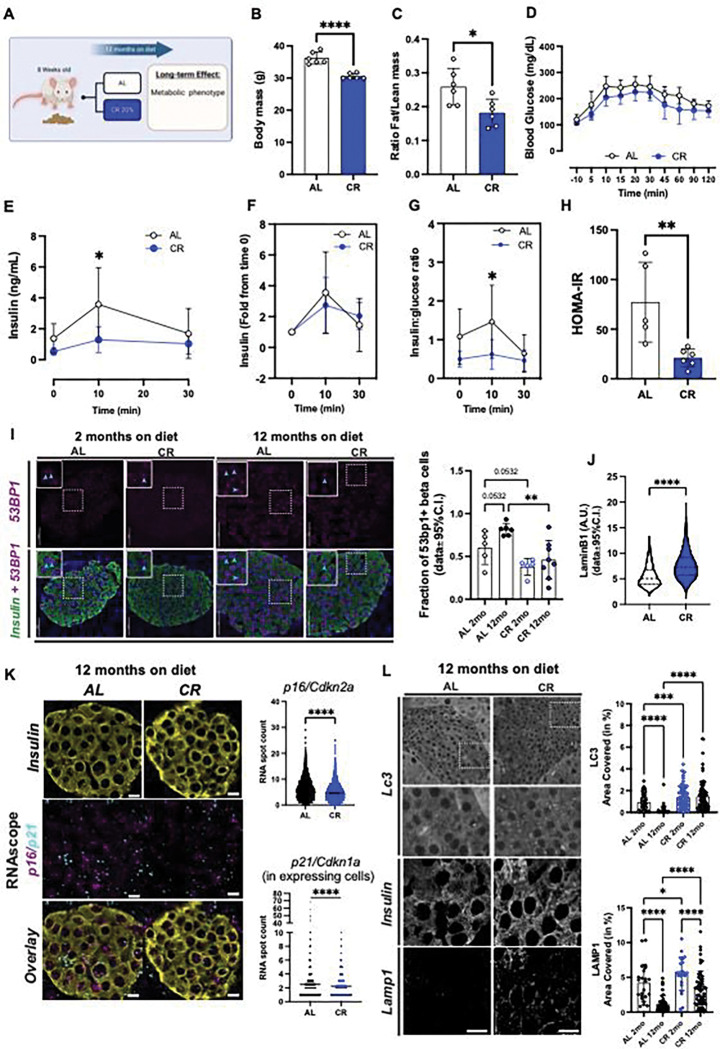
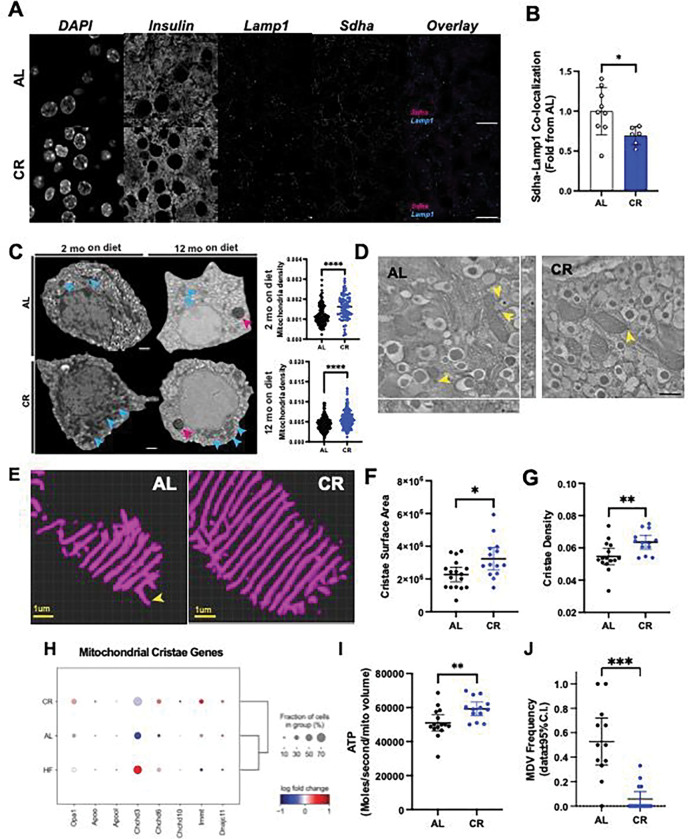
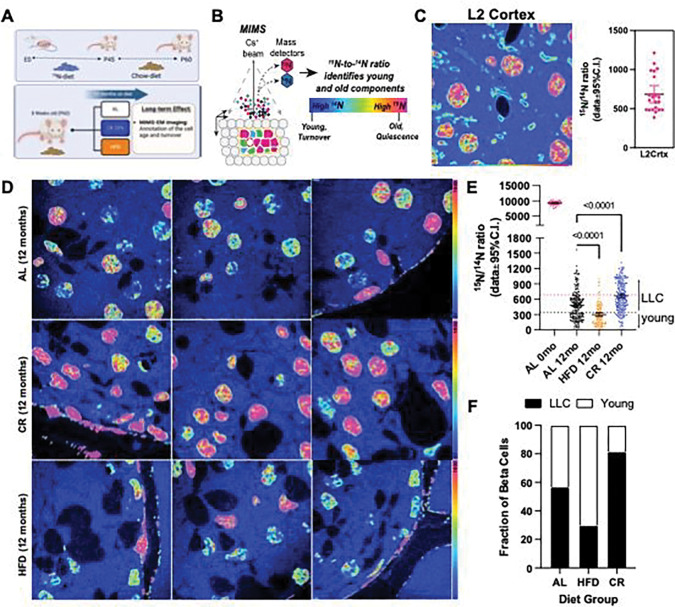
Caloric restriction (CR) extends organismal lifespan and health span by improving glucose homeostasis mechanisms. How CR affects organellar structure and function of pancreatic beta cells over the lifetime of the animal remains unknown. Here, we used single nucleus transcriptomics to show that CR increases the expression of genes for beta cell identity, protein processing, and organelle homeostasis. Gene regulatory network analysis link this transcriptional phenotype to transcription factors involved in beta cell identity (Mafa) and homeostasis (Atf6). Imaging metabolomics further demonstrates that CR beta cells are more energetically competent. In fact, high-resolution light and electron microscopy indicates that CR reduces beta cell mitophagy and increases mitochondria mass, increasing mitochondrial ATP generation. Finally, we show that long-term CR delays the onset of beta cell aging and senescence to promote longevity by reducing beta cell turnover. Therefore, CR could be a feasible approach to preserve compromised beta cells during aging and diabetes.


Conflict of interest statement

Declaration of Interest. The authors declare no competing interests.

Figures

Figure 1.
Figure 1.. Short-term of caloric restriction (CR) improves glucose homeostasis in mice.
(A) Schematic diagram of mice subjected to ad-libitum (AL), 20% CR, or HFD for 2 months starting at 8 weeks of age. (B) Mouse body mass over 2 months on diet. (C) Body mass change after 2 months on diet. (D) Ratio between fat mass and lean mass after 2 months on diet. (E) Blood glucose levels during the meal tolerance test (MTT) after 2 months on diet and respective area-under-curve (AUC) measurements. (F) Insulin levels during the MTT and (G) the respective fold change from baseline values. (H) Ratio between the insulin and glucose values obtained during the MTT. (I) HOMA-IR calculated from fasting glucose and insulin values after 2 months on diet. (J) Blood glucose values obtained during an intra-peritoneal insulin tolerance test (ipITT) and the respective decay of the glucose rate per minute (kITT). All data are presented as mean ± 95% confidence intervals (C.l.) The asterisks mean * p< 0.05, ** p< 0.01, *** p< 0.001 and **** p< 0.0001 using one or two-way ANOVA with Tukey’s post hoc test or Sídák’s multiple comparisons test. Unpaired Student t-test was applied for two groups comparation in (D, J). In (B-C), n=20–75 male mice per diet group; (D) n=7 male mice per diet group; (E) n=5–11 male mice per diet group; (F-I) n=9–11 male mice per diet group; (J) n=5 male mice per diet group.
Figure 2.
Figure 2.. Single cell multiome sequencing of islets reveals diet-specific changes to beta-cell heterogeneity.
(A) Schematic representation of the workflow used for single nuclei multiome sequencing (ATAC + RNA) of pancreatic islets isolated from AL, CR and HFD mice after 2 months on diet. (B) Uniform Manifold Approximation and Projection (UMAP) of the integrated transcriptome and chromatin dataset. Data from a total of n=18,741 islet cells from n=2 mice per diet group. Different cell types are indicated by various colors and labels. Inset, donut plot with the total number of cells in each cell cluster. (C) UMAPs showing the expression of cell marker genes. (D) Dot plot with relative expression of marker genes in alpha, beta, delta, gamma, acinar, endothelial, stellate and macrophage cell clusters. (E) Genome tracks showing ATAC peaks for hormone markers: Gcg (alpha cell), Ins1 (beta cell), Sst (delta cell) and Ppy (gamma cell). (F) Heatmap showing the correlation between gene expression (RNA-seq) and chromatin accessibility (ATAC-seq) across the identified cell types. (G) Heatmap with the top differentially expressed genes (RNA-seq) and (H) top ATAC-seq peaks in transcriptional factors (TF) motifs in beta-cells from AL, CR, and HFD mice. (I) Annotated node map with pathway enrichment analysis of differentially expressed genes and TF motifs in beta-cells from CR mice. Analysis was performed using Metascape with an FDR < 0.05. (J) UMAP projection of beta-cells and identified subclusters from AL, CR and HFD mice. Beta-cell populations were defined according to distinct transcriptional states. (K) Top marker genes from each beta-cell state.
Figure 3.
Figure 3.. CR reprograms beta-cell gene regulatory networks (GRNs).
(A) SCENIC heatmap with hierarchical clustering analysis of TF activity in beta-cells from AL, CR and HFD mice after 2 months on diet. TFs identified as “ON” are shown in black, while TFs identified as “OFF” are in white. (B) Pearson correlation matrix of n=272 TF identified in all mouse beta cells (all diet groups together). Boxes highlight clusters of TFs with high degree of correlation. (C) Gene regulatory networks (GRNs) formed by TFs identified using SCENIC in beta-cells from AL, CR and HFD mice. TFs are shown as pink nodes, while target protein-coding genes are shown in blue. Node size represents the “betweenness centrality” measurements that report in the influence of a given TF within a network. (D) Dot plot and hierarchical clustering showing the gene expression levels of target genes associated to Atf6 and Mafa GRNs from AL, CR and HFD beta cells. Dot plot scale shows the relative expression level and percentage of cells expressing a target gene.
Figure 4.
Figure 4.. CR beta cells are metabolically fit.
(A) Schematic diagram of imaging mass spectrometry (MALDI-MS) approach used to measure metabolite abundance in AL and CR pancreases after 2 months on diet. (B) Average mass to power (m/z) spectra of all samples combined. (C) Receiver Operating Characteristic (ROC) analysis of ions enriched in acinar versus islet regions. (D) ROC analysis of ions enriched in AL versus CR islet regions. (E) Fraction of MALDI-MS metabolites identified using the HMDB and their respective molecular class and distribution in AL or CR datasets. (F) Representative hematoxylin and eosin (H&E) staining of AL/CR pancreases prepared for MALDI-MS imaging. (G) Representative m/z images for select metabolites identified in our ROC analyzes. In (F), scale bar = 3mm.
Figure 5.
Figure 5.. Long-term CR delays beta cell aging signatures.
(A) Schematic diagram of mice subjected to AL or 20% CR for 12 months starting at the age of 8 weeks. (B) Body mass after 12 months on diet. (C) Ratio between fat mass and lean mass after 12 months on diet. (D) Blood glucose levels during the meal tolerance test (MTT) after 12 months on diet. (E) Blood insulin levels during the MTT and (F) the respective fold change from baseline values. (G) Ratio between the insulin and glucose values obtained during the MTT. (H) HOMA-IR calculated from fasting glucose and insulin values after 12 months on diet. (I) Representative images of pancreatic sections from AL and CR male mice after 2 months or 12 months on diet stained with 53BP1 and insulin. Right, quantification of DNA damage by 53BP1+ beta-cells. Each dot represents the average from each mouse. A total of 127–200 islets per experimental group were analyzed. Data are normalized by percentage of 53BP1 positive beta-cells per total beta-cell number. (J) Quantification of beta cell nuclear levels of Lamin B1 in pancreatic islets from AL and CR mice after 12 months on diet. (K) Representative images of pancreatic sections from AL and CR male mice after 12 months on diet stained with Cdkn2a and Cdkn1a mRNA probes, and insulin. Right, the quantification of incidence of these markers per beta-cell. (L) Representative images of pancreatic sections from AL and CR mice after 12 months on diet stained with Lc3I-II or Lamp1. Right, quantification of beta cell area occupied by Lc3I-II or Lamp1. For all panels, data are presented as mean ± 95% confidence intervals (C.l.). The asterisks mean * p< 0.05, ** p< 0.01, *** p< 0.001 and **** p< 0.0001 using two-way ANOVA with Sídák’s multiple comparisons test or unpaired Student t-test (B, C, H, J, K). In (B-I), n=6 male mice per diet group.
Figure 6.
Figure 6.. CR increases beta cell mitochondria density and modifies cristae structure.
(A) Representative imagens of pancreatic sections from AL and CR male mice after 2 months on diet. Slides were stained with Insulin, Lamp1 and Sdha. (B) Co-localization between Sdha and Lamp1 was measured. Each dot represents the average co-localization index in each animal calculated from approximately 100 beta cells per animal. (C) Representative images of pancreatic beta-cells from AL and CR male mice using electronic microscopy. Blue arrows point to mitochondria density, while pink arrows point to lipofuscin granules in aged beta cells. Mitochondrial density measured by the total mitochondrial number per beta cell area. Each dot represents a single beta cell analyzed from three different islets per mouse (n=3 mice per diet group). (D) Representative images of pancreatic beta cells from AL and CR male mice using high resolution electron tomography (eTomo). (E) Representative 3D reconstructions of beta cell crista segmentation generated using deep learning image analysis tools. (F-G) Cristae surface area and cristae density in AL or CR beta cells. (H) Dot plot showing the relative expression levels of genes involved in cristae formation and morphology. (I) Calculation of ATP generation for an average beta cell mitochondrion. Each dot represents data from one eTomo image stack. (J) Relative frequency of mitochondrial-derived vesicles observed in eTomo images. In (F-H and I-J), each dot represents an individual field of view with an average of 5 mitochondria per field. eTomo data acquired from n=3 mice per diet group, 5 fields of view per animal. Total of 69–70 mitochondria analyzed per diet group. The asterisks indicate * p< 0.05, ** p< 0.01, *** p< 0.001 and **** p< 0.0001 using unpaired Student t-test. In (D), scale bar = 500nm, and yellow arrowheads indicating the location of MDVs, whereas the asterisk in each image marks the location of a lysosome.
Figure 7.
Figure 7.. CR promotes beta-cell longevity by slowing-down beta-cell turnover rates.
(A) Study design. After 2 months of age, 15N-labelled mice were kept on AL, 20% CR or HFD for 12 months. (B) Multi-isotope imaging mass spectroscopy (MIMS) representation technique. (C) MIMS imaging and data quantification of layer 2 cortical neurons from 15N labelled mouse after chase with 14N diet. Each dot represents a single neuronal nucleus. (D) MIMS of pancreatic islets from AL, CR or HFD mice. (E) Scatter plot with 15N/14N ratios for beta cells at day 0 (no chase) and after 12 months (mo) on AL, HFD, or CR diet. Each dot represents individual beta cells. The dotted horizontal pink and black lines represent the mean and the lowest 15N/14N levels found in cortical neurons shown in (C). (F) Estimation of beta cells that are estimated to be LLC or young after 12 months on AL, CR or HFD.

References

    1. López-Otín C., Blasco M.A., Partridge L., Serrano M., and Kroemer G. (2013). The Hallmarks of Aging. Cell 153, 1194–1217. 10.1016/j.cell.2013.05.039. - DOI - PMC - PubMed
    1. Spalding K.L., Bhardwaj R.D., Buchholz B.A., Druid H., and Frisén J. (2005). Retrospective Birth Dating of Cells in Humans. Cell 122, 133–143. 10.1016/j.cell.2005.04.028. - DOI - PubMed
    1. Bhardwaj R.D., Curtis M.A., Spalding K.L., Buchholz B.A., Fink D., Björk-Eriksson T., Nordborg C., Gage F.H., Druid H., Eriksson P.S., and Frisén J. (2006). Neocortical neurogenesis in humans is restricted to development. Proceedings of the National Academy of Sciences 103, 12564–12568. 10.1073/pnas.0605177103. - DOI - PMC - PubMed
    1. Drigo R.A.E., Lev-Ram V., Tyagi S., Ramachandra R., Deerinck T., Bushong E., Phan S., Orphan V., Lechene C., Ellisman M.H., and Hetzer M.W. (2019). Age Mosaicism across Multiple Scales in Adult Tissues. Cell Metabolism 30, 343–+. 10.1016/j.cmet.2019.05.010. - DOI - PMC - PubMed
    1. D’Angelo M.A., Raices M., Panowski S.H., and Hetzer M.W. (2009). Age-Dependent Deterioration of Nuclear Pore Complexes Causes a Loss of Nuclear Integrity in Postmitotic Cells. Cell 136, 284–295. 10.1016/j.cell.2008.11.037. - DOI - PMC - PubMed

Publication types

LinkOut - more resources