[Preprint]. 2023 Nov 29:2023.09.15.557794.
doi: 10.1101/2023.09.15.557794.

Immune Responses in Checkpoint Myocarditis Across Heart, Blood, and Tumor

Affiliations

Immune Responses in Checkpoint Myocarditis Across Heart, Blood, and Tumor

Steven M Blum et al. bioRxiv. .

Update in

  • Immune responses in checkpoint myocarditis across heart, blood and tumour.
    Blum SM, Zlotoff DA, Smith NP, Kernin IJ, Ramesh S, Zubiri L, Caplin J, Samanta N, Martin S, Wang M, Tirard A, Song Y, Xu KH, Barth J, Sen P, Slowikowski K, Tantivit J, Manakongtreecheep K, Arnold BY, Nasrallah M, Pinto CJ, McLoughlin D, Jackson M, Chan P, Lawless A, Michaud WA, Sharova T, Nieman LT, Gainor JF, Wu CJ, Juric D, Mino-Kenudson M, Oliveira G, Sullivan RJ, Boland GM, Stone JR, Thomas MF, Neilan TG, Reynolds KL, Villani AC. Blum SM, et al. Nature. 2024 Dec;636(8041):215-223. doi: 10.1038/s41586-024-08105-5. Epub 2024 Nov 6. Nature. 2024. PMID: 39506125

Abstract

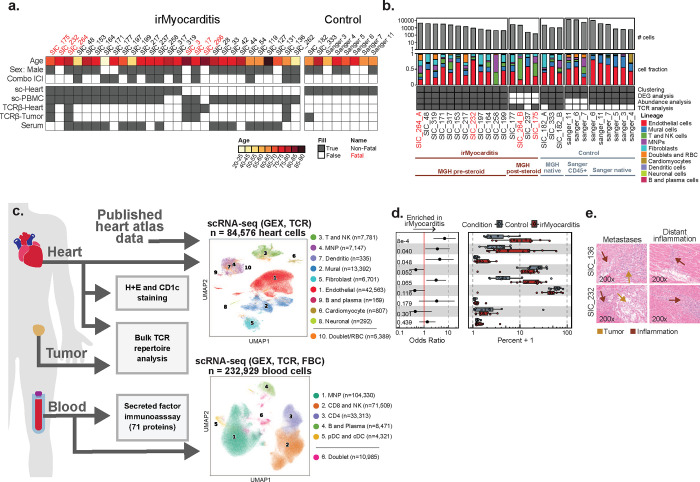
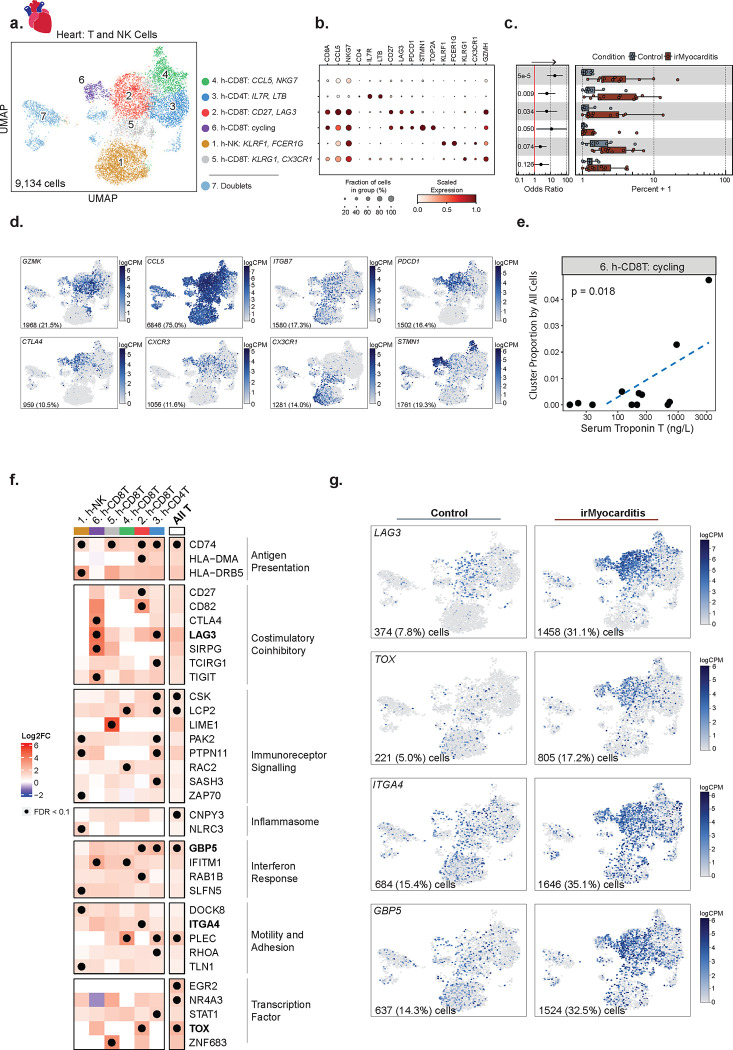
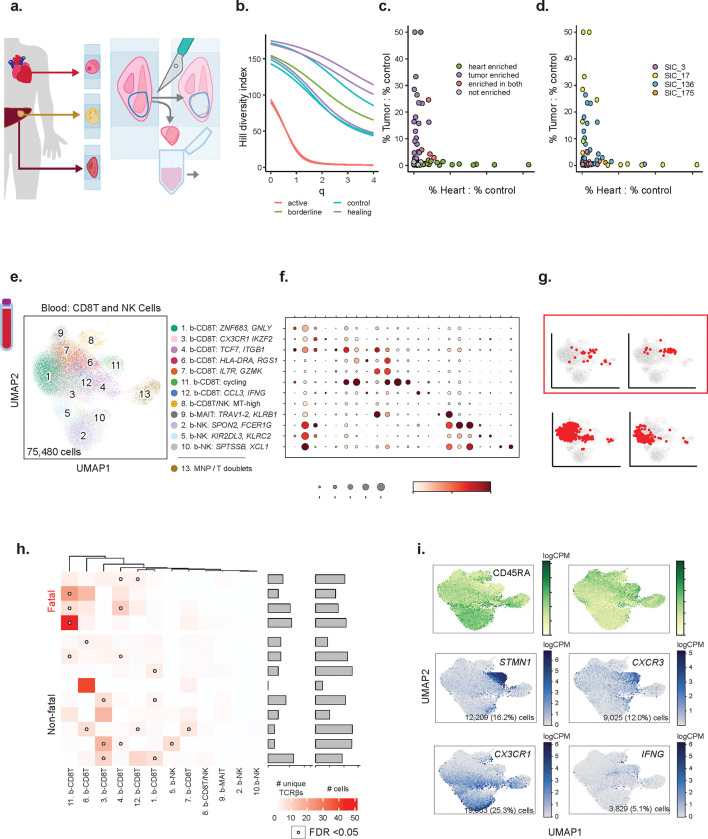
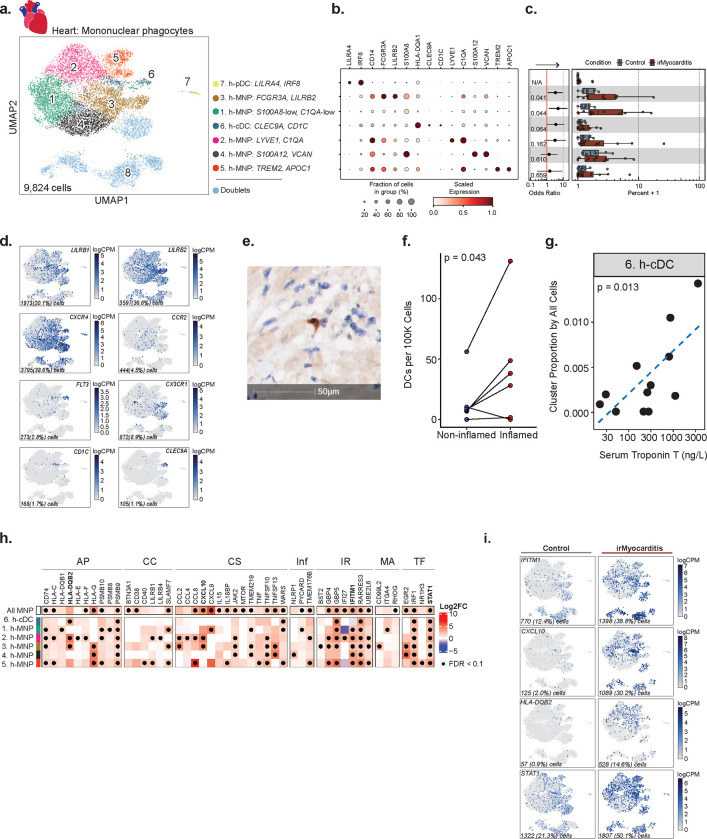
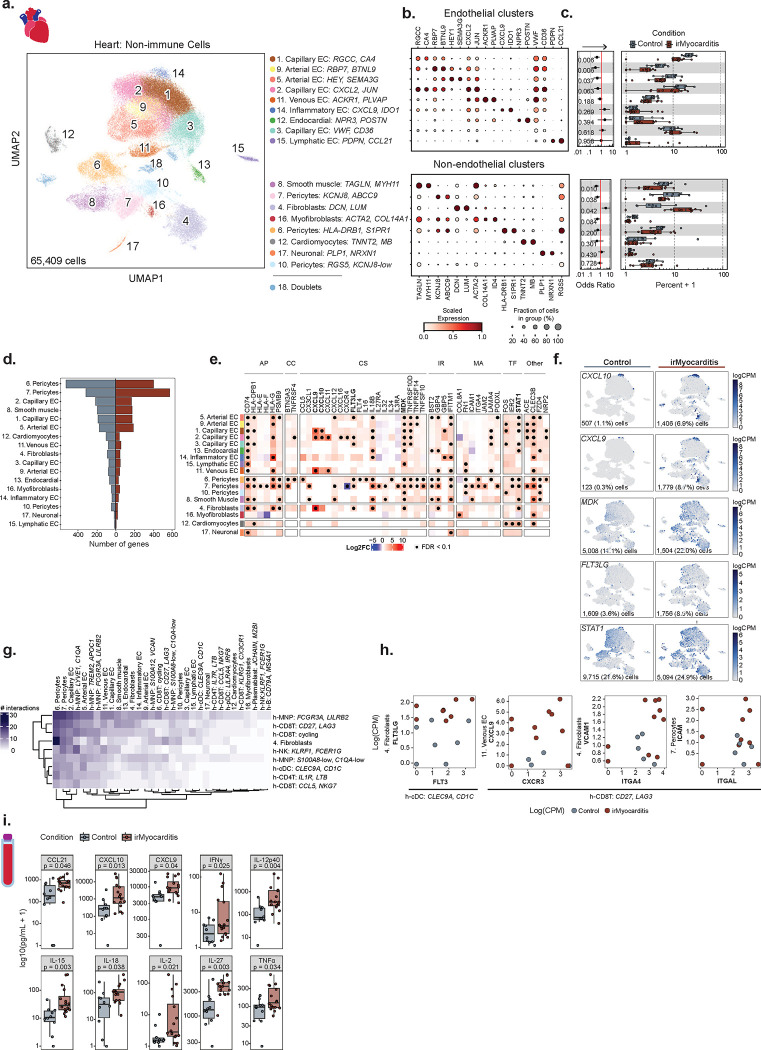
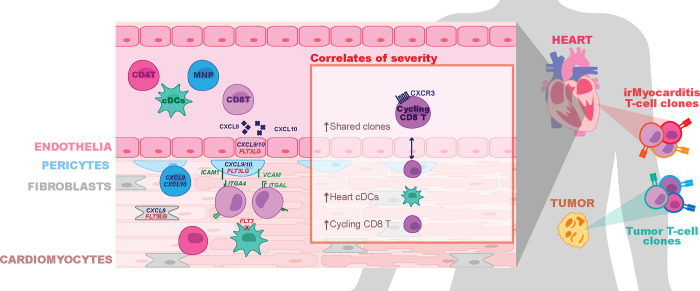
Immune checkpoint inhibitors (ICIs) are widely used anti-cancer therapies that can cause morbid and potentially fatal immune-related adverse events (irAEs). ICI-related myocarditis (irMyocarditis) is uncommon but has the highest mortality of any irAE. The pathogenesis of irMyocarditis and its relationship to anti-tumor immunity remain poorly understood. We sought to define immune responses in heart, tumor, and blood during irMyocarditis and identify biomarkers of clinical severity by leveraging single-cell (sc)RNA-seq coupled with T cell receptor (TCR) sequencing, microscopy, and proteomics analysis of 28 irMyocarditis patients and 23 controls. Our analysis of 284,360 cells from heart and blood specimens identified cytotoxic T cells, inflammatory macrophages, conventional dendritic cells (cDCs), and fibroblasts enriched in irMyocarditis heart tissue. Additionally, potentially targetable, pro-inflammatory transcriptional programs were upregulated across multiple cell types. TCR clones enriched in heart and paired tumor tissue were largely non-overlapping, suggesting distinct T cell responses within these tissues. We also identify the presence of cardiac-expanded TCRs in a circulating, cycling CD8 T cell population as a novel peripheral biomarker of fatality. Collectively, these findings highlight critical biology driving irMyocarditis and putative biomarkers for therapeutic intervention.


Conflict of interest statement

Conflict of Interest S.M.B has been a paid consultant to Two River Consulting and Third Rock Ventures. He has equity positions in Kronos Bio, 76Bio, and Allogene Therapeutics. D.A.Z. has been a paid consultant to Bristol Myers Squibb, Freeline Therapeutics, and Intrinsic Imaging. L.Z. has received consulting fees from Bristol Myers Squibb and Merck. R.J.S has been a paid consultant to Bristol Myers Squibb, Merck, Pfizer, Marengo Therapeutics, Novartis, Eisai, Iovance, OncoSec, and AstraZeneca and has received research funding from Merck. T.G.N has been a paid consultant to Bristol Myers Squibb, Genentech, CRC Oncology, Roche, Sanofi and Parexel Imaging Pharmaceuticals and has received grant funding from Astra Zeneca and Bristol Myers Squibb related to the cardiac effects of immune checkpoint inhibitors. K.L.R has served as an advisory board to SAGA Diagnostics and received speaker’s fees from CMEOutfitters and Medscape as well as research funding from Bristol Myers Squibb. A.C.V. has been a paid consultant to Bristol Myers Squibb.

Figures

Figure 1.
Figure 1.. Multiple intracardiac cell populations are enriched in irMyocarditis.
a, Patient cohort overview, including age, sex, ICI administered, and sample types obtained from irMyocarditis patients and controls. b, Top: bar plots displaying the number of single cells recovered from each heart sample. Middle: per donor color-coded cell lineage composition captured within each heart specimen with corresponding cell lineage color classifications indicated on the right. Bottom: grid depicting the contribution of each sample to the different analyses, grouped by sample characteristics and origins. Patients SIC_182 and SIC_264 each had two myocardial samples collected, the first collected at time of a diagnostic endomyocardial biopsy (labeled as sample A) and the second collected at time of autopsy (labeled as sample B). c, Left: summary of sample utilization across experimental frameworks. Right: UMAP embedding of scRNA-seq data from heart (top) and blood (bottom), color-coded by cell lineage, reporting number of cells per defined lineage. Cell lineage number was assigned according to the absolute number of cells detected per lineage and listed in order of ascending p-value for the associated analyses in panel d (for heart samples). d, Cell subset differential abundance analysis of major cell lineages comparing irMyocarditis cases (n = 12, red) to control in (n = 8, blue). Left: logistic regression odds-ratio for association of lineage abundance with irMyocarditis (OR > 1) vs control (OR < 1) for each lineage. Unadjusted likelihood-ratio test p-values for each lineage are shown. Right: boxplots show per patient intracardiac compositions of cell lineages where each dot represents a patient. Composition is reported as the percent of cells from a patient in each lineage. e, Hematoxylin and eosin (H&E) staining of cardiac tissues obtained via autopsy, SIC_136 (top, melanoma) and SIC_232 (bottom, renal cell carcinoma), showing intracardiac metastasis (left) and evidence of inflamed myocardium remote from metastatic foci (right). In d, error bars represent 95% confidence intervals. Boxes represent the median (line) and interquartile range (IQR) with whiskers extending to the remainder of the distribution, no more than 1.5x IQR, and each dot representing individual samples. Throughout the figure, red labels denote samples from patients with fatal irMyocarditis. Abbreviations: MNP, mononuclear phagocyte; GEX, gene expression; TCR, T cell receptor; FBC, feature bar code.
Figure 2.
Figure 2.. Activated, cytotoxic T cells are enriched in irMyocarditis heart tissue.
a, UMAP embedding of 9,134 CD8 T, CD4 T, and NK cells recovered from scRNA-seq of heart tissue, colored by the seven defined subsets labeled on the right. Cell subset number was assigned according to the absolute number of cells detected per subset and are listed in order of ascending p-value for the associated analyses in panel c. b, Dot plot showing selected marker genes for each T and NK cell subset. Dot size represents the percent of cells in the subset with non-zero expression of a given gene. Color indicates scaled expression. c, Cell subset differential abundance analysis comparing irMyocarditis cases (n = 12, red) to control (n = 8, blue). Left: logistic regression odds-ratio for association of cell subset abundance with irMyocarditis (OR > 1) versus control (OR < 1) for each subset. Unadjusted likelihood-ratio test p-values for each cell subset are shown. Right: boxplots show per patient intracardiac compositions of T/NK cell subsets, where each dot represents a patient. Composition is reported as the percent of T/NK cells from a patient in each subset. d, Feature plots using color to indicate gene expression (logCPM) levels of the indicated genes projected onto the T/NK UMAP embedding. Cell numbers and percentages represent gene expression across all heart T and NK cells. e, h-CD8Tcycling subset intracardiac abundance (y-axis) versus serum troponin T (x-axis) for irMyocarditis patients (n = 12). Linear regression p value shown. f, Heatmap showing selected differentially expressed genes (irMyocarditis versus control) across the T/NK subsets grouped by biological categories. The “All T” row depicts differential gene expression results from a pseudobulk analysis of pooled T-cell subsets (subsets 2–6) and excludes NK cells. Color scale indicates log2 fold-change difference between irMyocarditis cases and controls. Black dots indicate FDR < 0.1 (Wald test). Genes indicated in bold are displayed in panel g. g, Feature plots using color to indicate gene expression (logCPM) levels of the indicated genes expressed by control (left) or irMyocarditis samples (right), projected onto the T/NK UMAP embedding. Cell numbers and percentages represent gene expression across T/NK cells in control or irMyocarditis samples. In c, error bars represent 95% confidence intervals; boxes represent the median (line) and interquartile range (IQR) with whiskers extending to the remainder of the distribution, no more than 1.5x IQ, and dots represent individual samples.
Figure 3.
Figure 3.. T-cell receptors (TCR) distinguish anti-tumor responses from irMyocarditis and identify markers of fatal irMyocarditis in blood.
a, Schematic of the TCR-β chain sequencing experiment. Paired irMyocarditis, ICI-treated tumor, and/or normal parenchyma adjacent to tumor (“control tissue”) was marked and macroscopically dissected from serial slides. Excised portions were processed and underwent TCR-β chain sequencing. b, Smoothed Hill’s diversity index curves at diversity orders 0–4 for the TCR-β repertoires of irMyocarditis tissues, colored by histologic appearance at the time of autopsy. c, d, The proportion of each expanded TCR-β clone in heart and tumor tissue was calculated and then normalized by dividing by the proportion of the same clone in control tissue. Normalized TCR-β clone proportions for heart (x-axis) and tumor tissue (y-axis) are plotted. Individual data points considered significant (FDR < 0.05, Fishers exact test) are colored by tissue(s) of enrichment (c) and by donor (d). e, UMAP embedding of 75,480 CD8 T and NK cells recovered from scRNA-seq of peripheral blood cells, colored by the 13 defined cell subsets labeled on the right. Subset number was assigned according to the absolute number of cells detected per subset and ordered by abundance within major cell types. f, Dot plot showing selected marker genes for each CD8 T and NK cell subsets defined in blood. Dot size represents the percent of cells in the subset with non-zero expression of a given gene. Color indicates scaled expression across subsets. g, TCR-β sequences were compared between blood and heart T cells. Cells in blood for which the same TCR-β was expanded in the irMyocarditis heart sample from the same patient are shown in red on CD8 T/NK blood UMAP embeddings from representative patients. h, Logistic regression was used to determine associations between blood CD8 T cell subsets and the presence of expanded TCR-β clones from irMyocarditis heart samples in those subsets. Far left: heatmap showing the calculated associations, displayed as odds ratios. Color in the heatmap represents the magnitude of the regression odds ratio. Open circles indicate FDR < 0.05 (likelihood ratio test). Middle: the number of unique heart-expanded TCR-β sequences found to be shared with blood. Right: total number of cells containing those TCR-β sequences for each donor. i, Top: feature plots using color to indicate surface protein levels (logCPM) of CD45RA and CD45RO protein (as determined by CITE-seq) projected onto the blood CD8 T and NK cell UMAP embedding. Bottom: feature plots using color to indicate gene expression (logCPM) levels of the indicated genes projected onto the blood CD8 T and NK cell UMAP embedding. Cell numbers and percentages represent gene expression across all blood CD8 T and NK cells. Throughout the figure, red labels denote samples from patients with fatal irMyocarditis.
Figure 4.
Figure 4.. Conventional dendritic cells (cDCs) are enriched in irMyocarditis heart tissue and associated with disease severity.
a, UMAP embedding of 9,824 mononuclear phagocytes (MNPs) isolated from heart tissue, colored by the eight defined cell subsets labeled on the right. Subset number was assigned according to the absolute number of cells detected per subset and are listed in order of ascending p-value for the associated analysis in panel c. b, Dot plot showing top marker genes for each MNP subset. Dot size represents the percent of cells in the subset with non-zero expression of a given gene. Color indicates scaled expression across subsets. c, Cell subset differential abundance analysis comparing irMyocarditis cases (n = 12, red) to control (n = 8, blue). Left: logistic regression odds-ratio for association of cell subset abundance with irMyocarditis (OR > 1) vs control (OR < 1) for each subset. Unadjusted likelihood-ratio test p-values for each subset are shown. Statistics for h-pDCLILRA4, IRF8 are not included due to extremely low recovery from this cell subset. Right: boxplots show per patient intracardiac MNP cell subset compositions for each subset, where each dot represents a patient. Composition is reported as the percent of cells from a patient in each subset. d, Feature plots using color to indicate gene expression (logCPM) levels of the indicated genes projected onto the heart MNP UMAP embedding. Cell numbers and percentages represent gene expression across all heart MNP cells. e, Representative image following immunohistochemical staining of irMyocarditis heart tissue section for CD1c (brown) and hematoxylin nuclear counterstaining (blue). f, Comparison of CD1c+ cell density as measured by immunohistochemical staining in non-inflamed regions (left column) and inflamed regions (right column) of irMyocarditis heart sections; p = 0.043, one-sided T-test. g, h-cDCsCLEC9A,CD1C proportion (y-axis) versus serum troponin T (x-axis) for irMyocarditis samples (n = 12); p = 0.013, linear regression. h, Heatmap showing select differentially expressed genes (irMyocarditis versus control) in heart tissue grouped by the following biological themes: antigen presentation (AP), co-inhibition or co-stimulation (CC), cytokine signaling (CS), inflammasome (Inf), interferon response (IR), motility and adhesion (MA), and transcription factors (TF). The “All MNP” row depicts differential gene expression results from a pseudobulk analysis of pooled MNP subsets 1 through 5, excluding cDCs. Color scale indicates log2 fold-change difference between irMyocarditis cases and controls. Black dots indicate FDR < 0.1 (Wald test). i, Feature plots using color to indicate gene expression (logCPM) levels of the indicated genes expressed by control samples (left) or irMyocarditis samples (right) projected onto the heart MNP UMAP embedding. Cell numbers and percentages represent gene expression across respective control or irMyocarditis sample MNP cells. In c, error bars represent 95% confidence intervals. Boxes represent the median (line) and interquartile range (IQR) with whiskers extending to the remainder of the distribution, no more than 1.5x IQR, with dots representing individual samples.
Figure 5.
Figure 5.. Immunomodulatory signals from non-immune intracardiac populations and circulating secreted factors nominate putative therapeutic targets for irMyocarditis.
a, UMAP embedding of 65,409 non-immune cells isolated from the heart, segregated by endothelial cells (top) and non-endothelial cells (bottom), and colored by the 18 defined cell subsets labeled on the right. Cell subset number was assigned according to the absolute number of cells detected per subset and are listed in order of ascending p-value for the associated analyses in panel c. b, Dot plot showing top marker genes for each non-immune subset. Dot size represents the percent of cells in the subset with non-zero expression of a given gene. Color indicates scaled expression across subsets. c, Cell subset differential abundance analysis comparing irMyocarditis cases (n = 12, red) to control (n = 8, blue). Left: logistic regression odds-ratio for association of non-immune cell subset abundance with irMyocarditis (OR > 1) versus control (OR < 1) for each subset. Unadjusted likelihood-ratio test p-values for each subset are shown. Right: boxplots show per patient intracardiac non-immune cell subset compositions, where each dot represents a patient. Composition is reported as the percent of cells from a patient in each subset. d, The number of differentially expressed genes (DEGs) for each cell subset when comparing irMyocarditis cases (right, red) to control (left, blue). e, Heatmap showing select DEGs (irMyocarditis versus control) grouped by the following biological themes: antigen presentation (AP), co-inhibition or co-stimulation (CC), cytokine signaling (CS), interferon response (IR), motility and adhesion (MA), transcription factors (TF), and “Other” genes of biological interest. Color scale indicates log2 fold-change difference between irMyocarditis cases and controls. Black dots indicate FDR < 0.1 (Wald test). f, Feature plots using color to indicate gene expression (logCPM) levels of the indicated genes expressed by control samples (left) or irMyocarditis samples (right) projected onto the non-immune cell UMAP embedding. Cell numbers and percentages represent gene expression across respective control or irMyocarditis non-immune cells. g, Heatmap reporting the number of significant interactions between intracardiac cell subsets as predicted by CellphoneDB. Significant CellphoneDB results were filtered for high-confidence interactions (see Methods). h, Scatter plots showing select predicted receptor:ligand pairs of interest from CellphoneDB analysis. Each point represents a donor (red = irMyocarditis, blue = control) and the x- and y-axes represent the logCPM of receptors and ligands, respectively, from the indicated cell subset. i, Serum concentrations of selected cytokines and chemokines in irMyocarditis cases and controls. In c, error bars represent 95% confidence intervals. In c and i, boxes represent the median (line) and interquartile range (IQR) with whiskers extending to the remainder of the distribution, no more than 1.5x IQR, with dots representing individual samples.
Figure 6.
Figure 6.. Summary of key findings.
The key findings of our study are represented, starting on the left, by showing the increased cardiac infiltration of CD4 T cells (CD4T), CD8 T cells (CD8T), mononuclear phagocytes (MNP), and conventional dendritic cells (cDCs). These immune cells are shown expressing some of the genes (ITGA4 and ITGAL on CD8T cells; CXCR3 on cycling CD8T; FLT3 on cDCs) that are anticipated to be involved in the recruitment and retention of immune cells into the heart by cognate ligands expressed by other cells in the heart (CXCL9/10 and FLT3LG in endothelial cells; CXCL9/10, ICAM1, and VCAM in pericytes; CXCL9/10 in MNPs; CXCL9 and FLT3LG on fibroblasts). Secreted CXCL9 and CXCL10 are highlighted as proteins that are elevated in the blood of irMyocarditis patients. “Correlates of severity” highlight factors in our scRNA-seq analysis that are associated with fatality (increased sharing of TCR clones expanded in the heart with cycling CD8T cells in the blood) and increased serum troponin in irMyocarditis patients (increased cDCs and cycling CD8T in the heart). An illustration of the heart and paired tumor highlight T cells with distinct colors to emphasize the finding that different T-cell clones are enriched in irMyocarditis and tumor compared to controls.

References

    1. Haslam A. & Prasad V. Estimation of the Percentage of US Patients With Cancer Who Are Eligible for and Respond to Checkpoint Inhibitor Immunotherapy Drugs. JAMA Network Open 2, e192535 (2019). - PMC - PubMed
    1. Postow M. A., Sidlow R. & Hellmann M. D. Immune-Related Adverse Events Associated with Immune Checkpoint Blockade. N. Engl. J. Med. 378, 158–168 (2018). - PubMed
    1. Martins F. et al. Adverse effects of immune-checkpoint inhibitors: epidemiology, management and surveillance. Nat. Rev. Clin. Oncol. 16, 563–580 (2019). - PubMed
    1. Johnson D. B., Nebhan C. A., Moslehi J. J. & Balko J. M. Immune-checkpoint inhibitors: long-term implications of toxicity. Nat. Rev. Clin. Oncol. 19, 254–267 (2022). - PMC - PubMed
    1. Mahmood S. S. et al. Myocarditis in Patients Treated With Immune Checkpoint Inhibitors. J. Am. Coll. Cardiol. 71, 1755–1764 (2018). - PMC - PubMed

Publication types