[Preprint]. 2023 Sep 15:rs.3.rs-3325498.
doi: 10.21203/rs.3.rs-3325498/v1.

Mechanical loading-induced change of bone homeostasis is mediated by PGE2-driven hypothalamic interoception

Affiliations

Mechanical loading-induced change of bone homeostasis is mediated by PGE2-driven hypothalamic interoception

Feng Gao et al. Res Sq. .

Update in

Abstract

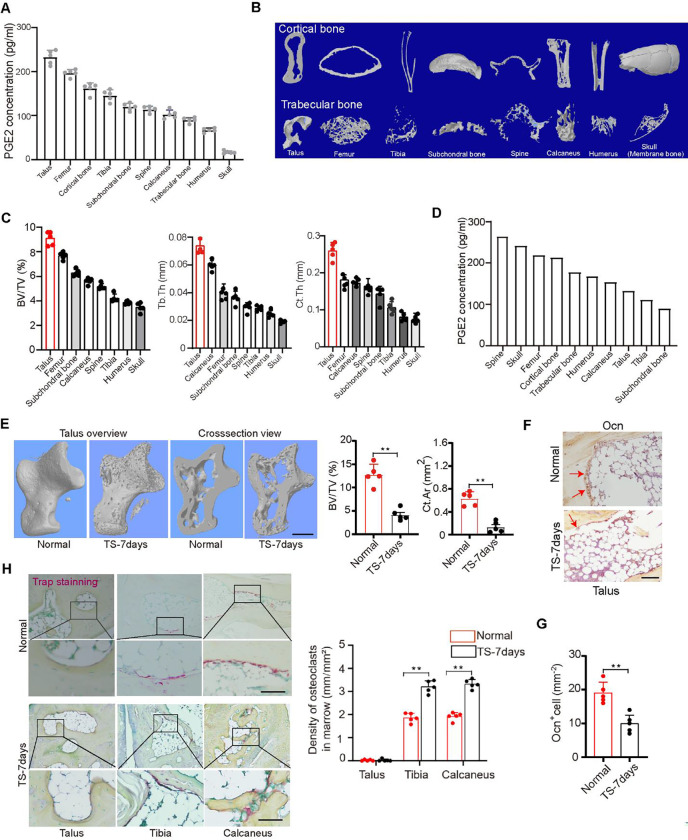
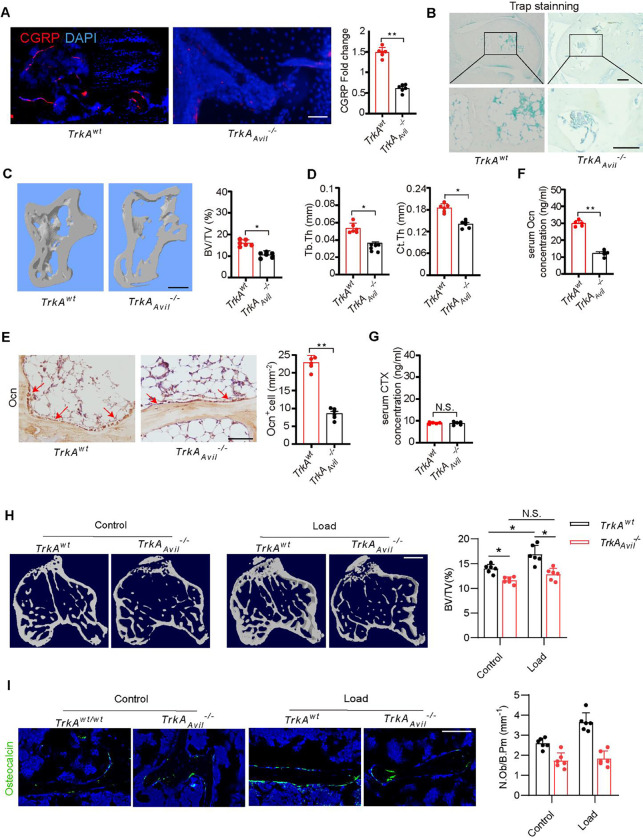
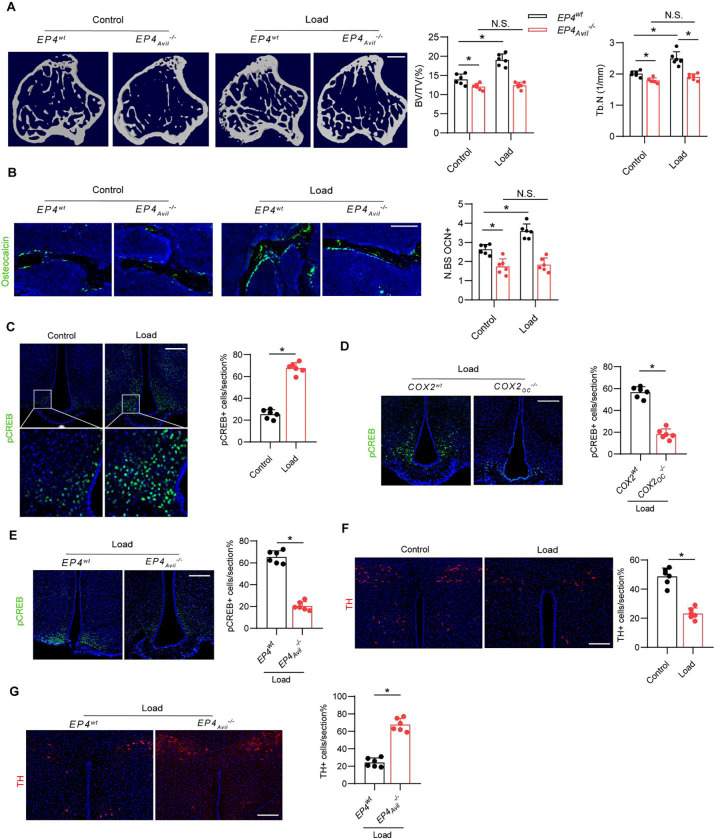
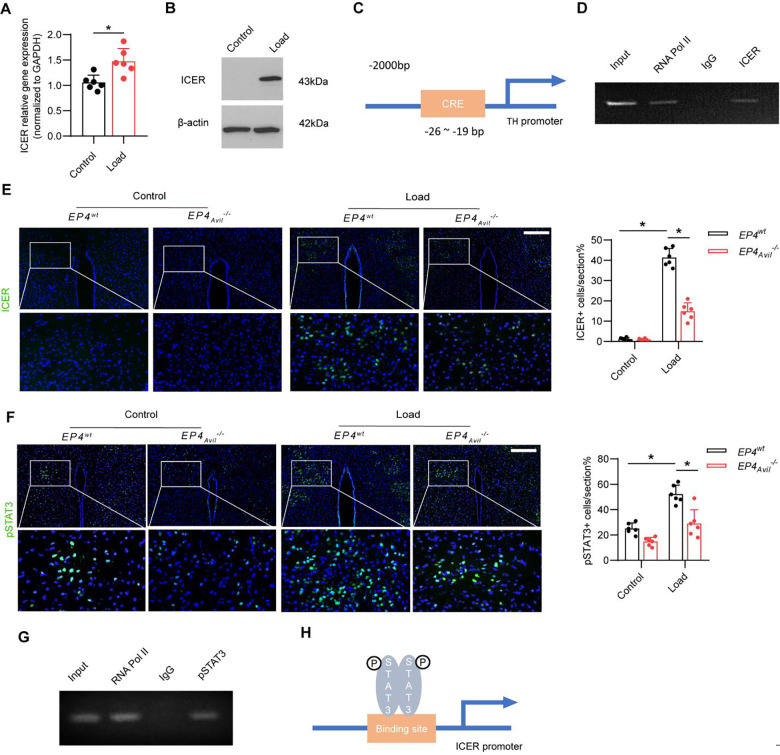
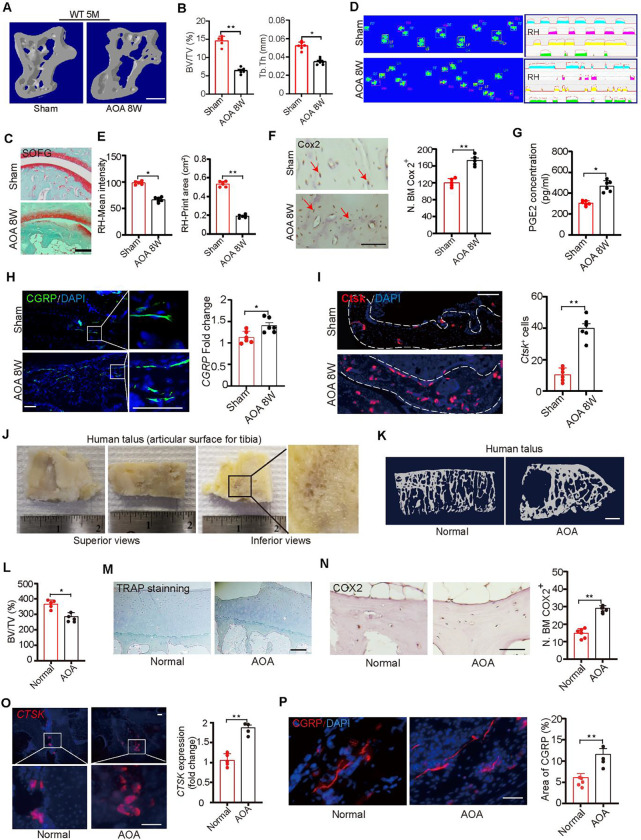
Bone is a mechanosensitive tissue and undergoes constant remodeling to adapt to the mechanical loading environment. However, it is unclear whether the signals of bone cells in response to mechanical stress are processed and interpreted in the brain. In this study, we found that the hypothalamus of the brain regulates bone remodeling and structure by perceiving bone PGE2 concentration in response to mechanical loading. Bone PGE2 levels are in proportion to their weight bearing. When weight bearing changes in the tail-suspension mice, the PGE2 concentrations in bones change in line with their weight bearing changes. Deletion of Cox2 or Pge2 in the osteoblast lineage cells or knockout Ep4 in sensory nerve blunts bone formation in response to mechanical loading. And sensory denervation also significantly reduces mechanical load-induced bone formation. Moreover, mechanical loading induces CREB phosphorylation in the hypothalamic ARC region to inhibit sympathetic TH expression in the PVN for osteogenesis. Finally, we show that elevated PGE2 is associated with ankle osteoarthritis (AOA) and pain. Together, our data demonstrate that in response to mechanical loading, skeletal interoception occurs in the form of hypothalamic processing of PGE2-driven peripheral signaling to maintain physiologic bone homeostasis, while chronically elevated PGE2 can be sensed as pain during AOA and implication of potential treatment.


Conflict of interest statement

Competing Interests No completing interests.

Figures

Figure 1.
Figure 1.. PGE2 concentration in bone is positively correlated with mechanical load.
(A)Enzyme-linked immunosorbent assay (ELISA) analysis of PGE2 level in bone at 10 different points of 12-week-old C57BL/6 mice. (B) Representative μCT images of 8 different point bones from 12-week-old C57BL/6 mice. (C) Quantitative analysis of trabecular bone fraction (BV/TV), trabecular bone thickness (Tb. Th) and cortical bone thickness (Ct. Th). (D)ELISA analysis of PGE2 level in bone at 10 different points of 13-week-old C57BL/6 mice with tail suspension (TS) for 7 days. (E) Representative μCT images and quantitative analysis of trabecular bone fraction (BV/TV), cortical bone area (Ct. Ar) of talus from normal 13-week-old C57BL/6 mice or with tail suspension (TS) for 7 days. Scale bars, 50 μm. (F and G) Representative images of immunostaining of osteocalcin (Ocn) positive cells (F) and analysis of Ocn+ cells in the subchondral bone of talus from normal 13-week-old C57BL/6 mice or with tail suspension (TS) for 7 days (G). Scale bars, 50 μm. (H) Representative images of immunostaining and quantitative analysis of the density of TRAP+ cells in the subchondral bone of talus, tibia, and calcaneus from normal 13-week-old C57BL/6 mice or with tail suspension (TS) for 7 days. Scale bars, 50 μm. N ⩾ 5 per group. *P < 0.05, **P<0.01, and N.S. indicates not significant. Statistical significance was determined by Student’s t-test.
Figure 2.
Figure 2.. PGE2 mediates mechanical load-induced osteoblastic bone formation.
(A) Representative images of immunostaining and quantitative analysis of the Cox2+ cells (brown) in the subchondral bone of talus, calcaneus, and tibia from 12-week-old C57BL/6 mice. Scale bars, 50 μm. (B-D) Representative images of immunostaining TRAP+ cells per bone surface (N.Oc/BS) on the trabecular bone surface (B) and TRAP+ cells in the bone marrow (C) and quantitative analysis of TRAP+ cells (D) in talus, calcaneus, and tibia from 12-week-old C57BL/6 mice. Scale bars, 50 μm. (E, G) Representative images of immunostaining (E) and quantitative analysis (G) of Ctsk expression in osteoclasts at steady state of the subchondral bone of talus, calcaneus, and tibia from 12-week-old C57BL/6 mice. Scale bars, 50 μm. (F, H) Representative images of immunostaining (F) and quantitative analysis (H) of Ctsk expression in osteocytes at steady state of the subchondral bone of talus, calcaneus, and tibia from 12-week-old C57BL/6 mice. Scale bars, 50 μm. (I) ELISA analysis of PGE2 level in tibiae bone marrow at different time points after axial compression loading on the tibiae 100 cycles at 2 Hz of WT mice. (J-O) Mice underwent one month of axial compression loading of the tibiae. Non-loaded tibiae were used as controls. (J) Immunohistochemical staining and quantification of Cox2+ cells (brown) on the trabecular tibial surface in WT mice. Scale bar, 50 μm. (K) ELISA analysis of PGE2 level in tibiae bone marrow at different time points after axial compression loading on the tibiae 100 cycles at 2 Hz of Cox2Ocn−/− mice. (L, M) Representative μCT images (L) and quantitative analysis (M) of trabecular bone fraction (BV/TV) and trabecular number (Tb.N) of tibial bone of WT mice loaded for one month or non-loaded tibiae. Scale bar, 500 μm. (N, O) Representative μCT images (N) and quantitative analysis (O) of trabecular bone fraction (BV/TV) and trabecular number (Tb.N) of tibial bone of Cox2Ocn−/− mice loaded for one month or non-loaded tibiae. Scale bar, 500 μm. N ⩾ 5 per group. *P < 0.05, **P<0.01, and N.S. indicates not significant. Statistical significance was determined by Student’s t-test.
Figure 3.
Figure 3.. Sensory denervation reduces mechanical load-induced bone formation.
(A) Representative images of immunofluorescence staining and quantitative analysis of the CGRP+ sensory nerves (red) in the subchondral bone of talus from 12-week-old TrkAwt and TrkAAvil−/− mice. Scale bar, 100 μm. (B) Representative images of immunostaining of TRAP+ cells in the subchondral bone of talus from 12-week-old TrkAwt and TrkAAvil−/− mice. Scale bar, 100 μm. (C, D) Representative μCT images and quantitative analysis of trabecular bone fraction (BV/TV) (C), trabecular bone thickness (Tb. Th) and cortical bone thickness (Ct. Th) (D) of talus from 12-week-old TrkAwt and TrkAAvil−/− mice. Scale bar, 100 μm. (E) Representative images of immunostaining of Ocn and analysis of Ocn+ cells in the subchondral bone of talus from 12-week-old TrkAwt and TrkAAvil−/− mice. Scale bar, 100 μm. (F, G) ELISA analysis of Ocn (F) and carboxy-terminal collagen crosslinks (CTX) level of the serum (G) from 12-week-old TrkAwt and TrkAAvil−/− mice. (H, I) TrkAwt and TrkAAvil−/− mice underwent one month of axial compression loading of tibiae. Non-loaded tibiae were used as controls. (H) Representative μCT images and quantitative analysis of trabecular bone fraction (BV/TV) of tibial bone. Scale bar, 500 μm. (I) Representative images of immunofluorescence staining and quantitative analysis of Ocn+ cells (green) on trabecular bone surface of tibiae. Scale bar, 50 μm. N ⩾ 5 per group. *P < 0.05, **P<0.01, and N.S. indicates not significant. Statistical significance was determined by Student’s t-test.
Figure 4.
Figure 4.. Mechanical load induces osteogenesis through PGE2/EP4 interoceptive signaling.
(A, B) EP4wt and EP4Avil−/− mice underwent one month of axial compression loading of tibiae. Non-loaded tibiae were used as controls. (A) Representative μCT images and quantitative analysis of trabecular bone fraction (BV/TV) and trabecular number (Tb.N) of tibial bone. Scale bar, 500 μm. (B) Representative images of immunofluorescence staining of Ocn and quantitative analysis of Ocn+ cells (green) on trabecular bone surface of tibiae. Scale bar, 50 μm. (C) Representative images of immunofluorescence staining and quantitative analysis of the pCREB+ cells in the ARC of the hypothalamus of WT mice underwent three consecutive days of axial compression loading of tibiae or control shame load. Scale bar, 50 μm. (D) Representative images of immunofluorescence staining and quantitative analysis of the pCREB+ cells in the ARC of the hypothalamus of COX2wt and COX2Ocn−/− mice underwent three consecutive days of axial compression loading of tibiae. Scale bar, 50 μm. (E) Representative images of immunofluorescence staining and quantitative analysis of the pCREB+ cells in the ARC of the hypothalamus of EP4wt and EP4Avil−/− mice underwent three consecutive days of axial compression loading of tibiae. Scale bar, 50 μm. (F) Representative images of immunofluorescence staining and quantitative analysis of the TH+ cells in the PVN of the hypothalamus of WT mice underwent three consecutive days of axial compression loading of tibiae or control shame load. Scale bar, 50 μm. (G) Representative images of immunofluorescence staining and quantitative analysis of the TH+ cells in the PVN of the hypothalamus of EP4wt and EP4Avil−/− mice underwent three consecutive days of axial compression loading of tibiae. Scale bar, 50 μm. N ⩾ 5 per group. *P < 0.05, **P<0.01, and N.S. indicates not significant. Statistical significance was determined by Student’s t-test.
Figure 5.
Figure 5.. Mechanical load via hypothalamus AgRP neurons to regulate sympathetic activity.
(A) Representative images of the CTB injection site in the PVN area of the WT mice. (B) Representative images of CTB+ neurons in the ARC of the hypothalamus after CTB injection in the PVN for 5 days. (C, D) Representative images of immunofluorescence staining (C) and quantitative analysis of the pCREB (red) and CTB (green) (D) in the ARC of the hypothalamus of WT mice underwent three consecutive days of axial compression loading of tibiae or control sham load after CTB injection in the PVN for 5 days. Scale bar, 50 μm. (E-H) AgRP-Ires-cre mice injected with pAAV-hSyn-DIO-hM4d(Gi)-mCherry in one side of the ARC (right) and control AAV in the other side (left). Mice injected saline or CNO (0.3 mg/kg of body weight, i.p.) before loading. (E, F) Representative images of immunofluorescence staining (E) and quantitative analysis (F) of the pCREB (green) and mCherry (red) in the ARC of hypothalamus of AgRP-Ires-cre mice underwent three consecutive days of axial compression loading of tibiae or control shame load. Scale bar, 50 μm. (G, H) Representative images of immunofluorescence staining (G) and quantitative analysis of the TH (green) (H) in the PVN of hypothalamus of AgRP-Ires-cre mice that underwent three consecutive days of axial compression loading of tibiae. Scale bar, 50 μm. N ⩾ 5 per group. *P < 0.05, **P<0.01, and N.S. indicates not significant. Statistical significance was determined by Student’s t-test.
Figure 6.
Figure 6.. Mechanical load suppresses sympathetic activity through the ARC → PVN circuit via PGE2/EP4 interoceptive pathway.
(A) RT-PCR quantitative analysis of Crem gene expression in the PVN area of the hypothalamus of WT mice underwent three consecutive days of axial compression loading of the tibia or control sham load. (B) Western blot analysis expression of ICER in the PVN area of the hypothalamus of WT mice underwent three consecutive days of axial compression loading of tibiae or control sham load. (C) Diagram of potential ICER binding site on the TH gene promoter. (D) ChIP analysis of ICER on TH gene promoter in the PVN area of WT mice underwent three consecutive days of axial compression loading of the tibia. (E) Representative images of immunofluorescence staining and quantitative analysis of the ICER+ cells in the PVN of the hypothalamus of EP4wt and EP4Avil−/− mice underwent three consecutive days of axial compression loading of tibiae or control sham load. Scale bar, 50 μm. (F) Representative images of immunofluorescence staining and quantitative analysis of the pSTAT3+ cells in the PVN of the hypothalamus of EP4wt and EP4Avil−/− mice underwent three consecutive days of axial compression loading of tibiae or control sham load. Scale bar, 50 μm. N ⩾ 5 per group. *P < 0.05, **P<0.01, and N.S. indicates not significant. Statistical significance was determined by Student’s t-test for A. Statistical significance was determined by two-way analysis of variance for E, F. (G) ChIP analysis of pSTAT3 on ICER gene promoter in the PVN area of WT mice underwent three consecutive days of axial compression loading of tibiae. (H) Diagram of the mechanism of mechanical load up-regulated ICER gene expression in the PVN area.
Figure 7.
Figure 7.. Alteration in PGE2 level leads to Ankle Osteoarthritis and pain through sensory nerve.
(A, B) Representative μCT images (A) and quantitative analysis of trabecular bone fraction (BV/TV) and trabecular bone thickness (Tb. Th) of talus (B) from 20-week-old C57BL/6 mice with sham or ankle osteoarthritis surgery(AOA) for 8 weeks. Scale bars, 50 μm. (C) Representative images of Safranin Orange and fast green staining in the subchondral bone of talus from 20-week-old C57BL/6 mice with sham or ankle osteoarthritis surgery(AOA) for 8 weeks. Scale bars, 50 μm. (D, E) Representative images of catwalk (D) and ink blot analysis (E) of ipsilateral intensity and contact area of right hind paw of 20-week-old C57BL/6 mice with sham or ankle osteoarthritis surgery(AOA) for 8 weeks. (F) Representative images of immunostaining and quantitative analysis of the Cox2+ (brown) cells in the subchondral bone of talus of 20-week-old C57BL/6 mice with sham or ankle osteoarthritis surgery (AOA) for 8 weeks. Scale bars, 50 μm. (G) ELISA analysis of PGE2 level in the talus of 20-week-old C57BL/6 mice with sham or ankle osteoarthritis surgery (AOA) for 8 weeks. (H) Representative images of immunofluorescence staining and quantitative analysis of the CGRP+ sensory nerves (green) in the subchondral bone of talus of 20-week-old C57BL/6 mice with sham or ankle osteoarthritis surgery(AOA) for 8 weeks. Scale bars, 50 μm. (I) Representative images of immunostaining of Ctsk and quantitative analysis of Ctsk+ cells (red) in the subchondral bone of talus of 20-week-old C57BL/6 mice with sham or ankle osteoarthritis surgery(AOA) for 8 weeks. Scale bars, 50 μm. (J)Representative images of human talus samples from end stage of AOA patients with total ankle arthroplasty (TAA). (K, L) Representative μCT images (K) and quantitative analysis (L) of trabecular bone fraction (BV/TV) of healthy talus and end-stage AOA patient talus. Scale bars, 500 μm. (M) Representative images of immunostaining of TRAP in the subchondral bone of healthy talus and end-stage AOA patient talus. Scale bars, 50 μm. (N) Representative images of immunostaining and quantitative analysis of the COX2+ cells (brown) in the subchondral bone of healthy talus and end-stage AOA patient talus. Scale bars, 50 μm. (O) Representative immunofluorescence staining and quantitative analysis of CTSK (red) in the subchondral bone of healthy talus and end-stage AOA patient talus. Scale bars, 50 μm. (P) Representative images of immunofluorescence staining and quantitative analysis of the CGRP+ sensory nerves (red) in the subchondral bone of healthy talus and end-stage AOA patient talus. Scale bars, 50 μm. N ⩾ 5 per group. *P < 0.05, **P<0.01, and N.S. indicates not significant. Statistical significance was determined by Student’s t-test.

References

    1. Doherty AH, Ghalambor CK, and Donahue SW. Evolutionary physiology of bone: bone metabolism in changing environments. Physiology (Bethesda). 2015;30(1):17–29. - PubMed
    1. Samelson EJ, Broe KE, Xu H, Yang L, Boyd S, Biver E, et al. Cortical and trabecular bone microarchitecture as an independent predictor of incident fracture risk in older women and men in the Bone Microarchitecture International Consortium (BoMIC): a prospective study. Lancet Diabetes Endocrinol. 2019;7(1):34–43. - PMC - PubMed
    1. Tang Y, Wu X, Lei W, Pang L, Wan C, Shi Z, et al. TGF-beta1-induced migration of bone mesenchymal stem cells couples bone resorption with formation. Nat Med. 2009;15(7):757–65. - PMC - PubMed
    1. Xie H, Cui Z, Wang L, Xia Z, Hu Y, Xian L, et al. PDGF-BB secreted by preosteoclasts induces angiogenesis during coupling with osteogenesis. Nat Med. 2014;20(11):1270–8. - PMC - PubMed
    1. Xian L, Wu X, Pang L, Lou M, Rosen CJ, Qiu T, et al. Matrix IGF-1 maintains bone mass by activation of mTOR in mesenchymal stem cells. Nat Med. 2012;18(7):1095–101. - PMC - PubMed

Publication types