

This is a preprint.
Identifying proteomic risk factors for overall, aggressive and early onset prostate cancer using Mendelian randomization and tumor spatial transcriptomics
- PMID: 37790472
- PMCID: PMC10543057
- DOI: 10.1101/2023.09.21.23295864
Identifying proteomic risk factors for overall, aggressive and early onset prostate cancer using Mendelian randomization and tumor spatial transcriptomics
Update in
-
Identifying proteomic risk factors for overall, aggressive, and early onset prostate cancer using Mendelian Randomisation and tumour spatial transcriptomics.EBioMedicine. 2024 Jul;105:105168. doi: 10.1016/j.ebiom.2024.105168. Epub 2024 Jun 14. EBioMedicine. 2024. PMID: 38878676 Free PMC article.
Abstract
Background: Understanding the role of circulating proteins in prostate cancer risk can reveal key biological pathways and identify novel targets for cancer prevention.
Methods: We investigated the association of 2,002 genetically predicted circulating protein levels with risk of prostate cancer overall, and of aggressive and early onset disease, using cis-pQTL Mendelian randomization (MR) and colocalization. Findings for proteins with support from both MR, after correction for multiple-testing, and colocalization were replicated using two independent cancer GWAS, one of European and one of African ancestry. Proteins with evidence of prostate-specific tissue expression were additionally investigated using spatial transcriptomic data in prostate tumor tissue to assess their role in tumor aggressiveness. Finally, we mapped risk proteins to drug and ongoing clinical trials targets.
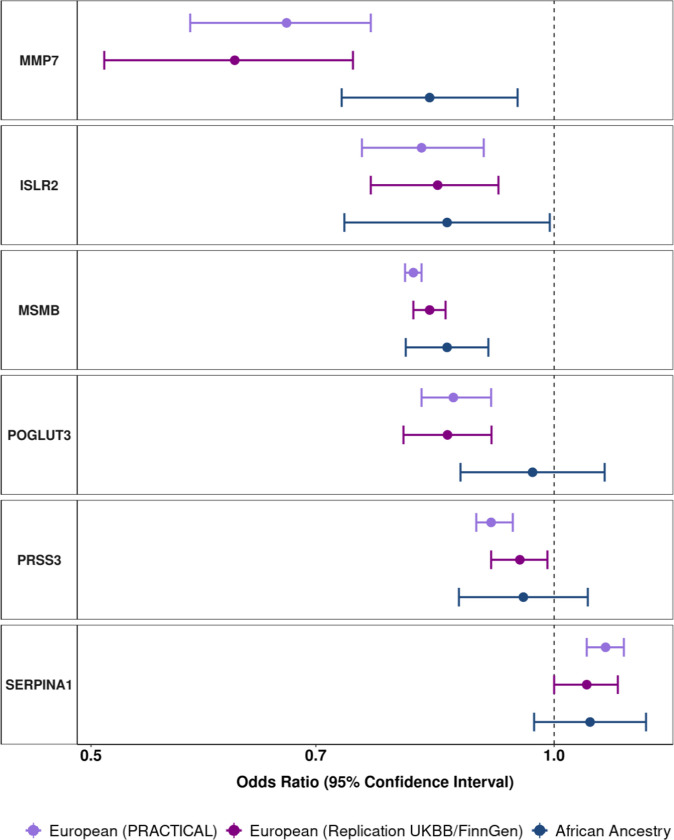
Results: We identified 20 proteins genetically linked to prostate cancer risk (14 for overall [8 specific], 7 for aggressive [3 specific], and 8 for early onset disease [2 specific]), of which a majority were novel and replicated. Among these were proteins associated with aggressive disease, such as PPA2 [Odds Ratio (OR) per 1 SD increment = 2.13, 95% CI: 1.54-2.93], PYY [OR = 1.87, 95% CI: 1.43-2.44] and PRSS3 [OR = 0.80, 95% CI: 0.73-0.89], and those associated with early onset disease, including EHPB1 [OR = 2.89, 95% CI: 1.99-4.21], POGLUT3 [OR = 0.76, 95% CI: 0.67-0.86] and TPM3 [OR = 0.47, 95% CI: 0.34-0.64]. We confirm an inverse association of MSMB with prostate cancer overall [OR = 0.81, 95% CI: 0.80-0.82], and also find an inverse association with both aggressive [OR = 0.84, 95% CI: 0.82-0.86] and early onset disease [OR = 0.71, 95% CI: 0.68-0.74]. Using spatial transcriptomics data, we identified MSMB as the genome-wide top-most predictive gene to distinguish benign regions from high grade cancer regions that had five-fold lower MSMB expression. Additionally, ten proteins that were associated with prostate cancer risk mapped to existing therapeutic interventions.
Conclusion: Our findings emphasize the importance of proteomics for improving our understanding of prostate cancer etiology and of opportunities for novel therapeutic interventions. Additionally, we demonstrate the added benefit of in-depth functional analyses to triangulate the role of risk proteins in the clinical aggressiveness of prostate tumors. Using these integrated methods, we identify a subset of risk proteins associated with aggressive and early onset disease as priorities for investigation for the future prevention and treatment of prostate cancer.
Keywords: Prostate Cancer; Proteomics; cis-pQTL; plasma; protein.
Figures


References
-
- Siegel R. L., Miller K. D. & Jemal A. Cancer statistics, 2018. CA: A Cancer Journal for Clinicians 68, 7–30 (2018). - PubMed
-
- Shih H.-J., Fang S.-C., An L. & Shao Y.-H. J. Early-onset prostate cancer is associated with increased risks of disease progression and cancer-specific mortality. Prostate 81, 118–126 (2021). - PubMed
Publication types
Grants and funding
LinkOut - more resources
Full Text Sources
Miscellaneous