[Preprint]. 2023 Sep 19:rs.3.rs-3299295.
doi: 10.21203/rs.3.rs-3299295/v1.

Loss of Bmp2 impairs odontogenesis via dysregulating pAkt/pErk/GCN5/Dlx3/Sp7

Affiliations

Loss of Bmp2 impairs odontogenesis via dysregulating pAkt/pErk/GCN5/Dlx3/Sp7

Shuo Chen et al. Res Sq. .

Abstract

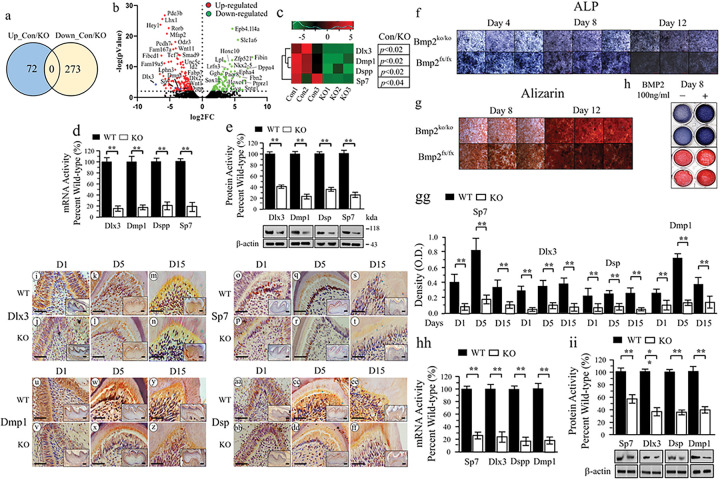
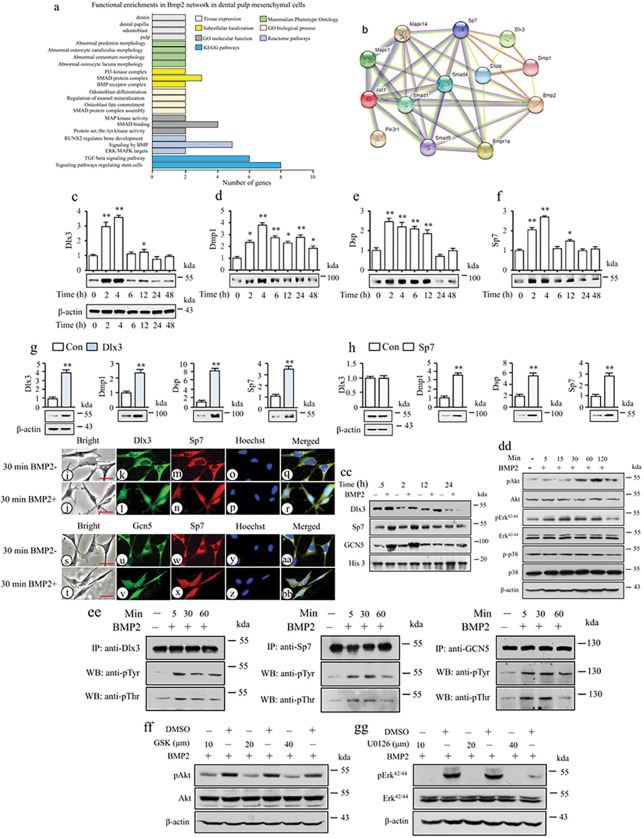
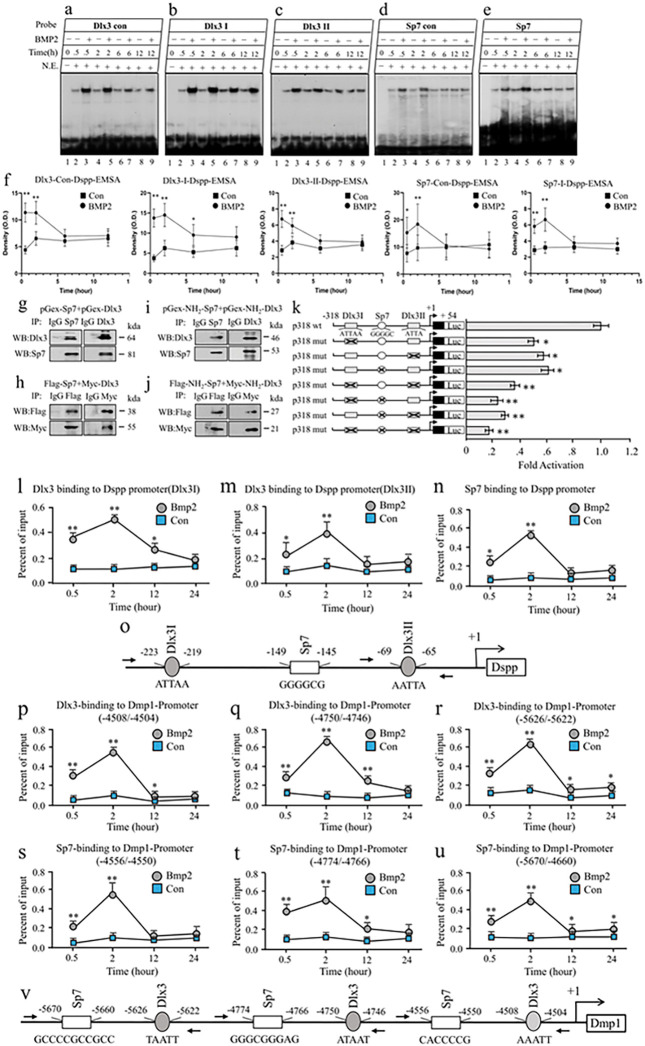
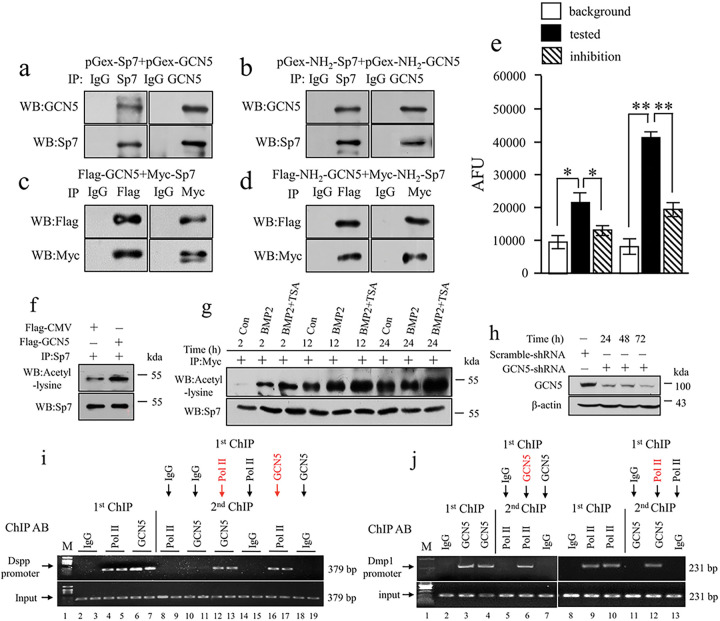
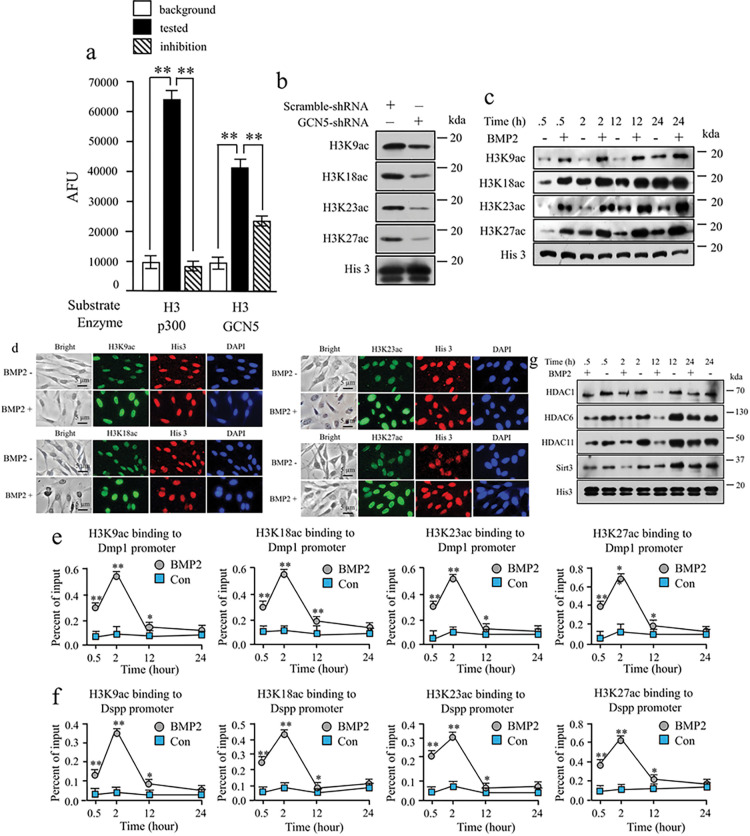
BMP2 signaling plays a pivotal role in odontoblast differentiation and maturation during odontogenesis. Teeth lacking Bmp2 exhibit a morphology reminiscent of dentinogenesis imperfecta (DGI), associated with mutations in dentin matrix protein 1 (DMP1) and dentin sialophosphoprotein (DSPP) genes. Mechanisms by which BMP2 signaling influences expressions of DSPP and DMP1 and contributes to DGI remain elusive. To study the roles of BMP2 in dentin development, we generated Bmp2 conditional knockout (cKO) mice. Through a comprehensive approach involving RNA-seq, immunohistochemistry, promoter activity, ChIP, and Re-ChIP, we investigated downstream targets of Bmp2. Notably, the absence of Bmp2 in cKO mice led to dentin insufficiency akin to DGI. Disrupted Bmp2 signaling was linked to decreased expression of Dspp and Dmp1, as well as alterations in intracellular translocation of transcription factors Dlx3 and Sp7. Intriguingly, upregulation of Dlx3, Dmp1, Dspp, and Sp7, driven by BMP2, fostered differentiation of dental mesenchymal cells and biomineralization. Mechanistically, BMP2 induced phosphorylation of Dlx3, Sp7, and histone acetyltransferase GCN5 at Thr and Tyr residues, mediated by Akt and Erk42/44 kinases. This phosphorylation facilitated protein nuclear translocation, promoting interactions between Sp7 and Dlx3, as well as with GCN5 on Dspp and Dmp1 promoters. The synergy between Dlx3 and Sp7 bolstered transcription of Dspp and Dmp1. Notably, BMP2-driven GCN5 acetylated Sp7 and histone H3, while also recruiting RNA polymerase II to Dmp1 and Dspp chromatins, enhancing their transcriptions. Intriguingly, BMP2 suppressed the expression of histone deacetylases. we unveil hitherto uncharted involvement of BMP2 in dental cell differentiation and dentine development through pAkt/pErk42/44/Dlx3/Sp7/GCN5/Dspp/Dmp1.

Keywords: Bone morphogenetic protein 2; Chromatin remodeling; Dentine matrix protein 1 (DMP1); Dentine sialophosphoprotein (DSPP); Dentinogenesis; Dentinogenesis imperfecta; Transcriptional factors; histone acetyltransferases.


Conflict of interest statement

Conflict of interests: The authors declare no competing interests.

Figures

Figure 1
Figure 1. Abnormal tooth structure in Bmp2 knockout mice.
(a) In situ hybridization assay. Anti-sense mRNA of Bmp2 exon 3 gene as the probe was used to detect Bmp2 mRNA expression within odontoblasts and dental pulp cells at the 21-day old Bmp2fx/fx mice (bright signal) and at the same age of the Bmp2 cKO mice. FX, floxed; KO, Bmp2 knockout; D, dentin; Dp, dental pulp chamber; Od, odontoblasts. (b) In the Bmp2 mutant mice, both sides of the up and lower incisors were asymmetric with open forked. The incisor edge was jagged with chipping and the tip incisor wearing (arrows). (c) Morphology of teeth revealed abnormal incisors and incisor dental pulp chambers in the Bmp2 cKO teeth were exposed. (d-g’) X-ray analysis of the teeth in the control (d, e) and Bmp2-cKO (f, g) mice. The mineral density of incisors and molars from the Bmp2-cKO mice was decreased compared to the control mice. Abnormal morphology of the molars and incisors in the Bmp2 null mice was observed. The dental pulp cavity of the incisors from the 3-month-old null mice was exposed and the dental pulp cavity of the molars was enlarged, and thin dentin layer compared to that of the control-type teeth. d’, e’, f’, and g’ show higher magnification from the boxes of d, e, f, and g. (h-o) Micro-CT analysis of teeth of the control (h, i, l, n) and Bmp2 cKO (j, k, m, o) mice from 3-month-old mice. (p, q, r, s) Dentin volume, thickness, total porosity, and dental pulp chamber from the first, and second mandibular molars and incisors in the 1- and 3-month-old wild type and Bmp2 null mice were analyzed by Micro -CT. Bars show mean ± S.E. from three animals of each group. t-test, *p<0.05; **p<0.01. (t) The dentin layer of the mandibular molars, root development, and size of dental pulp cavity from 1-month-old wild type and Bmp2 cKO mice were observed by histological staining. (u) SEM of the mandibular incisors and molars from Bmp2 null and control mice. The enamel layer of the incisor and molar is rough as well as incisor surface and molar cusps are rugged and abraded in 3-month-old Bmp2 cKO mice whereas the enamel surface of the incisor and molar of the same age of the control mouse is smooth. The dentinal tubules and inter-tubular dentin are asymmetrically distributed, and the dentinal tube numbers are less and small in size in the Bmp2 mutant mice while the dental tubules and inter-tubular dentin in the control mice are uniform. (v, w) Tooth hardiness and elasticity between the control and Bmp2 cKO mice from 1-month-old mice were conducted by an electromechanical testing machine to measure shear and compressive strength. There are statistically significant differences by t-test (p<0.007, p<0.0001).
Figure 2
Figure 2. RNA-seq and gene expression.
(a) RNA-seq. Total RNAs were isolated from the Bmp2ko/ko and Bmp2fx/fx dental mesenchymal cells and differentially expressed genes (DEGs) were selected by DESeq based on BHadjPvaland fold changes using RNA-seq. The ratio of Bmp2fx/fx /Bmp2 ko/ko dental mesenchymal cells was 72 upregulated and 273 downregulated. (b) Volcano plots of RNA-seq data, showing the genes up- or downregulated in Bmp2fx/fx vs Bmp2ko/ko dental mesenchymal cells. Dots in black are those genes that did not meet the criteria of being significantly expressed with a twofold change or greater. Thresholds appear as black dashed lines on the y-axis for significance (p Value < 0.01), y-intercept at −Log2FC = 2, and on the x-axis for foldchange (FC). Green dots indicated the downregulated genes. Red dots indicated the upregulated genes. n =3. (c) Heatmap comparison of gene expression profiles from the iBmp2fx/fx vs Bmp2ko/ko dental mesenchymal cells showed expression of Dlx3, Dmp1, Dspp, and Sp7 was decreased. (d) Expression of Dlx3, Dmp1, Dspp, and Sp7 in the Bmp2fx/fx vs Bmp2ko/ko dental mesenchymal cells was tested by RT-qPCR. The bar graphs show mean ± S.D (n = 3). t-test, **p<0.01. (e) Protein expression of Dlx3, Dmp1, Dsp, and Sp7 was detected by Western blotting. Expression of these proteins in Bmp2fx/fx dental mesenchymal cells acts as 100%. Bars show mean ± S.D. (n = 3) from three independent experiments: t-test, *p<0.05, **p<0.01. (f, and g) Cell differentiation and biomineralization in Bmp2fx/fx and Bmp2ko/ko dental mesenchymal cells were detected by ALP assay and Alizarin red S dye. These cells at days 8 and 12 in the calcifying medium were stained with Alizarin red S dye. (h) Cell differentiation and mineralization activities from Bmp2ko/ko dental mesenchymal cells treated with or without BMP2 (10 ng/ml) were measured by ALP and Alizarin red S assays. (i-ff) Immunohistochemistry showed expressions of Dlx3, Dmp1, Sp7, and Dsp within odontoblasts in control and Bmp2 cKO mice at postnatal days, 1 (D1), 5 (D5) and 15 (D15). Inserted photos represented lower magnification of the figures. Bars, 200 μm. (gg) The immunostaining density of Sp7, Dlx3, Dsp, and Dmp1 proteins within odontoblasts in the control and Bmp2 cKO mice was analyzed by J image software. Bars represent the mean ± S.E. (hh) RT-qPCR analysis of mRNA expression of Dlx3, Sp7, Dspp, and Dmp1 from control and Bmp2 cKO mice at D1. Values of control mRNAs were expressed as a 100-fold increase versus Bmp2 cKO mice. (ii). The expressions of Dlx3, Sp7, Dsp, and Dmp1 for the control and Bmp2 cKO mice at D1 were analyzed by Western blotting. Up panel showed the quantified data assessed by ImageJ software. Bars represent the mean ± S.E. from three animals in three separate experiments. t-test, *p < 0.05; **p < 0.01.
Figure 3
Figure 3. Effect of BMP2 on expression of Dlx3, Sp7, Dspp and Dmp1 in mouse dental mesenchymal cells.
(a) KEGG and GO represent BMP2 signal pathways involved in functional enrichments of dentinogenesis and others. (b) PPI predicts the network interaction of BMP2 with its target genes including canonical and non-canonical BMP signal pathways as well as Dlx3, Dmp1, Dspp, and Sp7. (c-f) The cells were treated with or without recombinant BMP2 (100 ng/ml) for 0–48h and proteins were isolated and quantitated. The expression of Dlx3, Dmp1, Dsp, and Sp7 was detected by Western blot, and β-actin was used as an internal control. These protein expressions in 0 h served as a 1.0-fold increase. Bars represent the mean ± S.E. from three separate experiments. t-test, *p < 0.05; **p < 0.01, indicates significant differences. (g, h) The cells were transfected with pcDNA-Dlx3 or pcDNA-3.1 (g) and with pcDNA-Sp7 or pcDNA 3.1 (h) for 48h. After transfection, protein expression of Dlx3, Dmp1, Dsp, Sp7, and β-actin was detected by Western blotting. The fold activity was determined by individual value by the control group value (pcDNA 3.1). Up panels were quantitated by Image software and bars represent the mean ± S.E. from three separate experiments. t-test, *p <0.05; **p <0.01. I-BB. Effect of BMP2 on nuclear translocation of Dlx3, Sp7, and GCN5 in iMDP3 cells. The cells were treated with or without 100 ng/ml of recombinant BMP2. Co-expression of Dlx3 (green, k, l), Sp7 (red, m, n), GCN5 (green, u, v), and Sp7 (red, w, x) was observed in the cells by fluorescent images. (i, j, s, t) bright images, Hoechst for nuclei (o, p, y, z), merged images (q, r, aa, bb). Bars, 10 μm. (cc) Cells were treated or untreated with BMP2 in 0.5h, 2h, 12h, and 24h, and nuclear extracts were then isolated and quantitated. Expression of Dlx3, Sp7, GCN5 and histone H3 (His 3) proteins in nuclear extracts was detected by Western blotting. (dd) Cells were treated or untreated with BMP2 in the given periods, and proteins were isolated and quantitated. Expression of pAkt, Akt, pErk42/44, Erk42/44, p-p38, p38, and β-actin as control was detected by Western blotting. (ee) Cells were treated with BMP2 for 0–60min, and Dlx3, Sp7, and GCN5 proteins were immunoprecipitated using anti-Dlx3 or anti-Sp7, anti-GCN5 antibodies, respectively. Phosphorylation of Dlx3, Sp7, and GCN5 at Tyr and Thr residues was assayed using anti-pTyr or anti-pThr antibodies, respectively. (ff, gg) Cells were treated or untreated with 10 μM of U0126 or GSK630639 (GSK), respectively for 2h and followed by adding BMP2. Nuclear extracts were then isolated and quantitated. Expression of pAkt, Akt, pErkl42/44, Erk42/44, and β-actin as control from the nuclear extracts were analyzed by Western blotting.
Figure 4
Figure 4. BMP2 upregulation of Dmp1 and Dspp transcriptions via Dlx3 and Sp7.
(a-e) The binding affinity of Dlx3 and Sp7 to their binding sites is induced by BMP2. The cells were treated with or without BMP2 (100 ng/ml) for 0, 0.5, 2h, 6h, and 12h. Nuclear extracts were isolated and quantitated. The binding activity of Dlx3 and Sp7 in their motifs in the Dspp promoter was observed by EMSAs. (f) Dynamic effect of BMP2 on the binding of Dlx3 and Sp7 to Dspp promoter detected by EMSA. The cells were treated with or without 100 ng/ml of BMP2 at 30 min, 2h, 12h, and 24h. Then, nuclear extracts were isolated and the binding of Dlx3 and Sp7 to their motifs in the Dspp promoter was analyzed by EMSA. Three independent experiments were performed. p*<0.05 and p**<0.01, shows significant differences. (g-j) For in vitro assay, the different fragments of Dlx3 and Sp7 genes were subcloned into pGex vectors, respectively, and the fused proteins were expressed and purified. In vitro interaction assay was carried out by incubating purified GST full-length Sp7 with GST full-length Dlx3 (g), GST NH2-Sp7, and GST NH2-Dlx3. (h) Immunoprecipitation was performed using anti-Sp7 or anti-Dlx3 antibodies. IgG was the negative control. Protein-protein interaction was detected by immunoblotting. For in vivo study, Co-IP assay was performed using whole cell extracts from iMDP3 and HEK293T cells expressing Flag-tagged full-length Sp7, and Myc-tagged full-length Dlx3 (i), Flag-tagged NH2-Sp7 and Myc-tagged NH2-Dlx3 (j). Anti-Flag, anti-Myc antibodies, and negative control IgG were pulled down by Co-IP. Anti-Flag or anti-Myc antibody was used for Western blotting to confirm the interaction of Dlx3 and Sp7. (k) Schematic representation of wild-type and mutant constructs of Dlx3 and Sp7 binding sites in the mouse Dspp promoter. Cells were transfected with wild-type or mutant chimeric or pGl3-basic and pRT-TK plasmids. The value (ratio firefly/Renilla Luc) was obtained, and the Luc activity of the wild-type group acts as a 1-fold increase. The fold Luc activity was calculated by dividing the individual value by the wild-type group value. The data show the mean ± S.E. from three separate experiments performed in triplicate. There are significantly different if *p<0.05, **p<0.01 by t-test. Mutant Dlx3 and Sp7 sites are shown by rectangles and round with cross lines. (l-o, and p-v) The dynamic effect of BMP2 on Dmp1 and Dspp transcriptions via Dlx3 and Sp7. The cells were treated with or without 100 ng/ml of BMP2 at 0.5h, 2h, 12h, and 24h. ChIP assay was used to pull down the binding sites of Dlx3 and Sp7 in the Dspp and Dmp1 promoters using anti-Dlx3 or anti-Sp7 antibodies. The dynamic binding affinity of Dlx3 (l, m), Sp7 (n) to their binding motifs in the Dspp promoter and of Dlx3 (p-r), and Sp7 (s-u) in the Dmp1 promoter was measured by qPCR using the specific primers. (o, and v) Schematic representation of Dlx3 and Sp7 binding sites in the Dspp (o) and Dmp1 (v) promoters. +1 represents transcriptional start sites. Arrows show primer positions designed. Mean data ± S.E. from three independent q-PCR experiments in triplicate was plotted. t-test, *p<0.05 and **p<0.01, show significant differences.
Figure 5
Figure 5. GCN5 acetylates Sp7 and regulates Dmp1 and Dspp transcriptions by BMP2-GCN5-RNA polymerase II.
(a-d) For in vitro assay, the different fragments of Sp7 and GCN5 genes were subcloned into pGex vectors, respectively and fused proteins were expressed and purified. In vitro interaction assay was performed by incubating purified GST full-length Sp7 with GST full-length GCN5 (a), GST NH2-Sp7, and GST NH2-GCN5 (b). Immunoprecipitation was carried out by anti-Sp7 or anti-GCN5 antibodies. Protein-protein interaction was detected by Western blotting. IgG was as control. For in vivo study, Co-IP assay was performed using whole cell extracts from iMDP3 and HEK293T cells expressing Flag-tagged full-length Sp7 and Myc-tagged full-length GCN5 (c), Flag-tagged NH2-Sp7 and Myc-tagged NH2-Dlx3 (d). Sp7 and GCN5 proteins were used to pull down by Co-IP using anti-Flag or Myc antibody. Western blotting was subject to confirm the interaction between Sp7 or GCN5. (e) p300 and GCN5 acetylated Sp7, however, p300 and GCN5 activity were inhibited by anacardic acid. p300 and GCN5 (50 ng) activity assays were carried out with the fluorescent HAT assay using either GCN5 (50 ng) or p300 (50 ng), or Sp7 protein (50 μM), acetyl-CoA (50 μM) and anacardic acid (15 μM) for inhibition. The fluorescent signal was monitored on a SpectraMAX Gemini XS plate reader with excitation at 365 nm and emission at 470 nm. AFU, arbitrary fluorescence units. (f) Overexpression of GCN5 stimulated Sp7 acetylation in vivo. The cells were transfected with pcDNA GCN5 or pcDNA 3.1 plasmids for 48h, respectively. After transfection, the cells were lysed and immunoprecipitated by the anti-Sp7 antibody. The immunoprecipitation complex was blotted with anti-Sp7 and anti-acetyl-lysine antibodies. (g) Cells were transfected with pcDNA-Myc-Sp7. After 12h transfection, the cells were treated or untreated with 10 nM of TSA alone or plus 100 ng/ml of recombinant BMP2 for 2h, 12h, and 24h, respectively. Sp7 was pulled down by immunoprecipitation using an anti-Myc antibody. Sp7 acetylated lysine site (s) and Sp7 were detected by Western blotting using anti-acetyl-lysine or anti-Sp7 antibodies, respectively. (h) The cells were transfected with either scramble-shRNA or shRNA-GCN5 plasmid for 24h, 48h, and 72h. The expression of GCN5 and β-actin was detected by Western blotting using anti-GCN5 and anti-β actin antibodies. (i, j) Cells were subjected to the first ChIP assay of the Dspp and Dmp1 promoters using anti-GCN5 or anti-RNA pol II antibody or non-immune IgG as a negative control. For the Re-ChIP assay, the beads from the first ChIP with anti-GCN5 antibody were washed, eluted, and subjected to the second ChIP with anti-RNA pol II antibody or non-immune IgG and vice versa. The Re-ChIP samples were amplified by PCR using specific primers of the Dspp and Dmp1 genes. Representative results of PCR with the specific primers pairs for Dspp (i) and DMP1 (j) genes. M, DNA markers; Pol II, RNA polymerase II.
Figure 6
Figure 6. GCN5 acetylates histone H3 and regulates chromatin remodeling in Dmp1 and Dspp promoters by BMP2.
(a) p300 and GCN5 acetylated H3, however, p300 and GCN5 activity were inhibited by anacardic acid. p300 and GCN5 (50 ng) activity assays were carried out with the fluorescent HAT assay using either GCN5 (50 ng) or p300 (50 ng), histone 3 peptide substrate (residues 5–23 of human H3, 50 μM), or acetyl-CoA (50 μM) and anacardic acid as an inhibitor (15 μM). AFU, arbitrary fluorescence units. (b). The cells were transfected with either scramble-shRNA or shRNA-GCN5 plasmid for 24h, 48h, and 72h. The expression of His H3 at different lysine residues, and β-actin was detected by Western blotting. (c) The cells were treated with or without 100 ng/ml of recombinant BMP2 for the given periods, and whole proteins were isolated. Expression of histone H3 (His 3), H3K9ac, H3K18ac, H3K23ac and H3K27ac were assayed by Western blotting. (d) Cells were treated with or without 100 ng/ml of recombinant BMP2 for 2h. Immunohistochemistry was performed using His 3, H3K9ac, H3K18ac, H3K23ac, and H3K27ac antibodies. The nucleus was stained by DAPI. BMP2 induces His 3 acetylation at lysine residues and nuclear translocation. (e, f) Dynamic binding of acetylated histone H3 at lysine residues in the Dmp1 and Dspp chromatins mediated by BMP2. Cells were treated with or without BMP2 for the given time points. Dynamic binding activity of H3K9ac, H3K18ac, H3K23ac, and H3K27ac in the Dmp1 (e) and Dspp (f) promoters medicated by BMP2 was analyzed by ChIP assay. Mean data ± S.E. from three independent qPCR experiments in triplicate was plotted. t-test, *p<0.05 and **p<0.01, show significant differences. (g) Effect of BMP2 on the expression of histone deacetylases (HDACs) in iMDP3 cells. The cells were treated with or without 100 ng/ml of recombinant BMP2 for 0.5h, 2h, 12h, and 24h, and whole proteins were isolated. Expression of HDAC1, HDAC6, HDAC11, and Sirt3 was analyzed by Western blot assay. His protein was used for internal control. His3, histone H3.

References

    1. MacDougall M. et al. Dentin phosphoprotein and dentin sialoprotein are cleavage products expressed from a single transcript coded by a gene on human chromosome 4. Dentin phosphoprotein DNA sequence determination. J Biol Chem 272, 835–842 (1997). 10.1074/jbc.272.2.835 - DOI - PubMed
    1. Liu M. M. et al. Dentine sialophosphoprotein signal in dentineogenesis and dentine regeneration. Eur Cell Mater 42, 43–62 (2021). 10.22203/eCM.v042a04 - DOI - PMC - PubMed
    1. D’Souza R. N. et al. Gene expression patterns of murine dentin matrix protein 1 (Dmp1) and dentin sialophosphoprotein (DSPP) suggest distinct developmental functions in vivo. J Bone Miner Res 12, 2040–2049 (1997). 10.1359/jbmr.1997.12.12.2040 - DOI - PubMed
    1. Chen S. et al. Differential regulation of dentin sialophosphoprotein expression by Runx2 during odontoblast cytodifferentiation. J Biol Chem 280, 29717–29727 (2005). 10.1074/jbc.M502929200 - DOI - PubMed
    1. Sreenath T. et al. Dentin sialophosphoprotein knockout mouse teeth display widened predentin zone and develop defective dentin mineralization similar to human dentinogenesis imperfecta type III. J Biol Chem 278, 24874–24880 (2003). 10.1074/jbc.M303908200 - DOI - PubMed

Publication types