[Preprint]. 2023 Sep 19:2023.09.18.23295747.
doi: 10.1101/2023.09.18.23295747.

Developmental progression of the nasopharyngeal microbiome during childhood and association with the lower airway microbiome

Affiliations

Developmental progression of the nasopharyngeal microbiome during childhood and association with the lower airway microbiome

Ariel J Hernandez-Leyva et al. medRxiv. .

Update in

  • Upper and lower airway microbiota across infancy and childhood.
    Hernandez-Leyva AJ, Rosen AL, Tomera CP, Lin EE, Akaho EH, Blatz AM, Otto WR, Logan J, Young LR, Harris RM, Whiteside SA, Kau AL, Odom John AR. Hernandez-Leyva AJ, et al. Pediatr Res. 2025 Mar 12. doi: 10.1038/s41390-025-03942-0. Online ahead of print. Pediatr Res. 2025. PMID: 40075175

Abstract

Background: The upper (URT) and lower (LRT) respiratory tract feature distinct environments and responses affecting microbial colonization but investigating the relationship between them is technically challenging. We aimed to identify relationships between taxa colonizing the URT and LRT and explore their relationship with development during childhood.

Methods: We employed V4 16S rDNA sequencing to profile nasopharyngeal swabs and tracheal aspirates collected from 183 subjects between 20 weeks and 18 years of age. These samples were collected prior to elective procedures at the Children's Hospital of Philadelphia over the course of 20 weeks in 2020, from otherwise healthy subjects enrolled in a study investigating potential reservoirs of SARS-CoV-2.

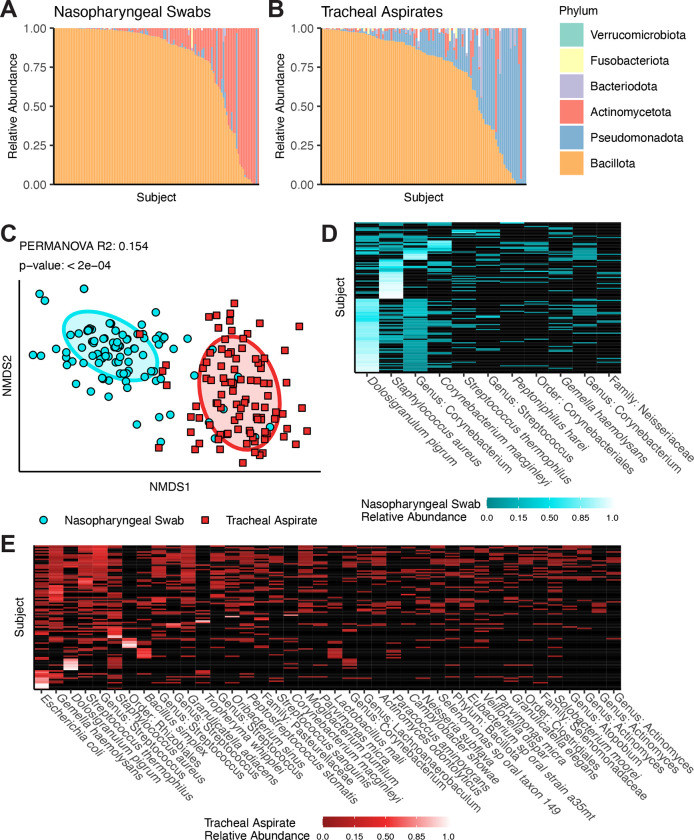
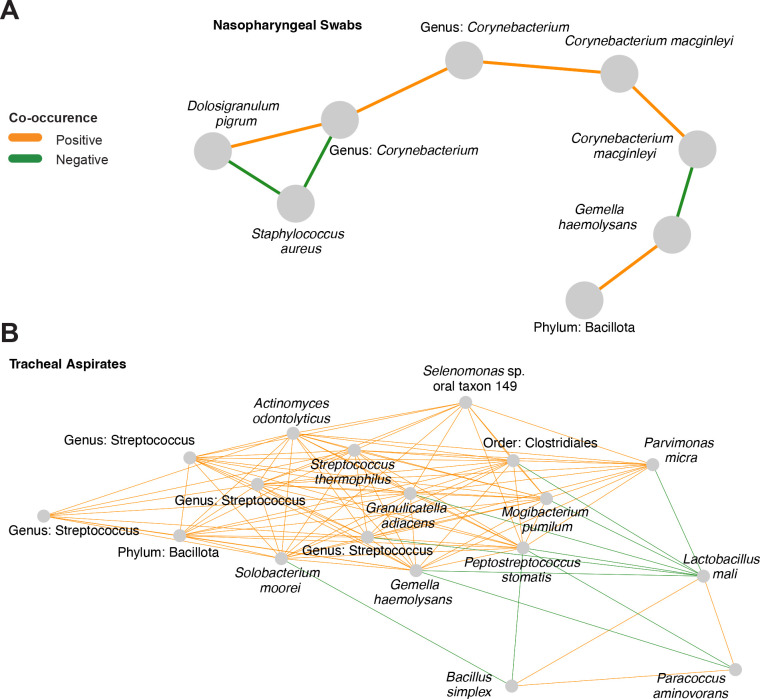
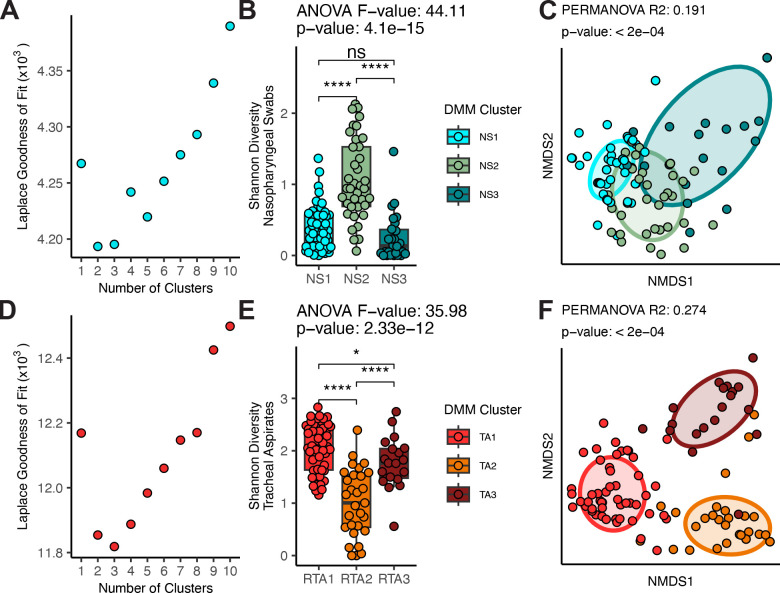
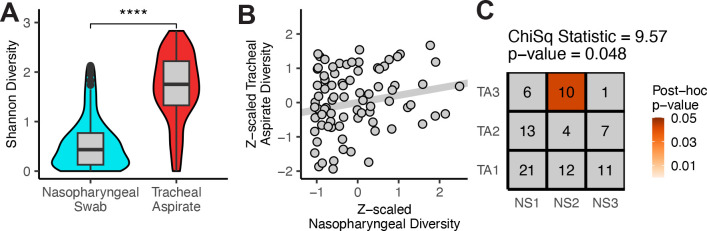
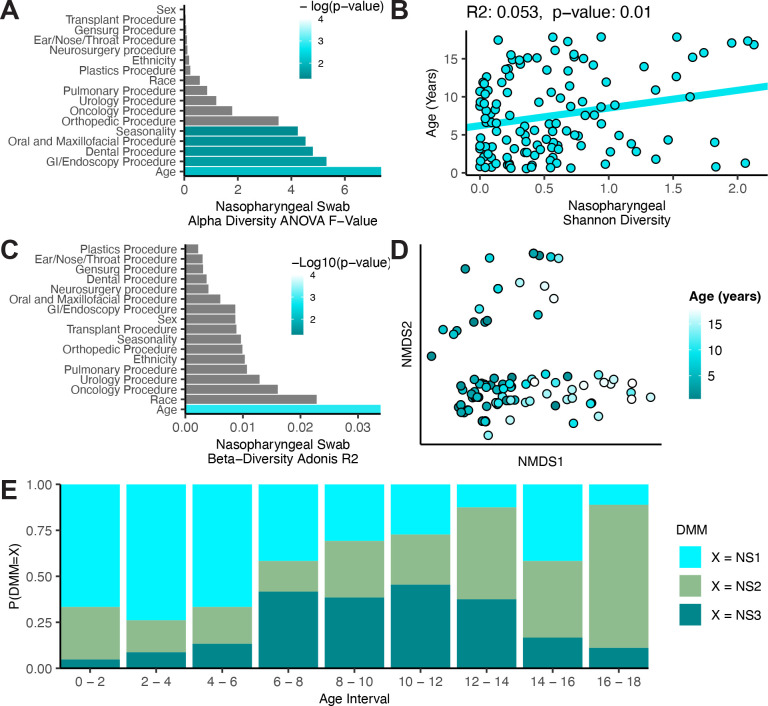
Findings: After extraction, sequencing, and quality control, we studied the remaining 124 nasopharyngeal swabs and 98 tracheal aspirates, including 85 subject-matched pairs of samples. V4 16S rDNA sequencing revealed that the nasopharynx is colonized by few, highly-abundant taxa, while the tracheal aspirates feature a diverse assembly of microbes. While no taxa co-occur in the URT and LRT of the same subject, clusters of microbiomes in the URT correlate with clusters of microbiomes in the LRT. The clusters identified in the URT correlate with subject age across childhood development.

Interpretations: The correlation between clusters of taxa across sites may suggest a mutual influence from either a third site, such as the oropharynx, or host-extrinsic, environmental features. The identification of a pattern of upper respiratory microbiota development across the first 18 years of life suggests that the patterns observed in early childhood may extend beyond the early life window.


Conflict of interest statement

Declaration of interests The authors declare no competing interests.

Figures

Figure 1:
Figure 1:. Summary of V4 16S rDNA Sequencing results from upper and lower airway samples.
A - B) Taxonomic relative abundance means plots depicting phyla level abundances for each sample in either the nasopharyngeal swabs (A, N = 124) or tracheal aspirates (B, N = 98). White bars reflect the proportion of taxa that were not classified to the phyla level. C) Non-metric dimensional scaling depicting the Unifrac distances between all samples. Results of PERMANOVA reflect the difference between nasopharyngeal swab and tracheal aspirate microbiomes. D) Heatmap reflecting taxa detected in at least 10% the nasopharyngeal swabs samples. E) Heatmap reflecting taxa detected in at least 10% of the tracheal aspirate samples.
Figure 2:
Figure 2:. Co-occurrence networks reveal interactions in nasopharyngeal swabs and tracheal aspirate microbiomes.
A) Co-occurrence network generated from V4 16S rDNA profiling the nasopharyngeal samples. Nodes were only included if they shared an edge with a minimum effect size of 0.05. B) Co-occurrence network generated from V4 16S rDNA profiling the tracheal aspirate samples. Nodes were only included if they shared an edge with a minimum effect of 0.10.
Figure 3:
Figure 3:. Summary of clusters identified by Dirichlet multinomial modeling of the nasopharyngeal swab microbiomes and tracheal aspirate microbiomes.
A) Laplace goodness of fit comparison for models produced with various numbers of clusters for the nasopharyngeal swabs. B) A comparison of Shannon diversity measures for the microbiota of the nasopharyngeal swabs separated by assigned cluster. Nasopharyngeal swabs are divided into three clusters: NS1 (N = 60), NS2 (N = 38), and NS3 (N = 26). C) Non-metric dimensional scaling analysis of the unweighted Unifrac distances between nasopharyngeal microbiomes. D) Laplace goodness of fit comparison for models produced with various numbers of clusters for the tracheal aspirates. E) A comparison of Shannon diversity measures for the microbiota of the tracheal aspirates separated by assigned cluster. Tracheal aspirates are divided into three clusters: TA1 (N = 50), TA2 (N = 29), and TA3 (N = 19). F) Non-metric dimensional scaling analysis of the unweighted Unifrac distances between tracheal aspirate microbiomes. ANOVA was used to test whether the clusters explained a significant proportion of variance in the alpha diversity of subjects. T-tests with Benjamini-Hochberg correction was used to demonstrate between-cluster differences. NMDS analyses of beta diversity were rotated to display axes with the greatest variation between clusters. PERMANOVA was conducted to test whether the assigned clusters explained a significant proportion of the variance in the data.
Figure 4:
Figure 4:. Correlating features of the nasopharyngeal swabs and tracheal aspirates.
A) Shannon diversity comparison between nasopharyngeal swabs (N = 124) and tracheal aspirates (N = 98). Mean difference was assessed using Student’s t-test. B) Comparison of the correlation between tracheal aspirate diversity and nasopharyngeal diversity for the 85 paired samples. The strength of the relationship was measured with Pearson’s correlation. C) Chi-square test comparing clusters assigned to the nasopharyngeal swabs against clusters assigned to the tracheal aspirates. A post-hoc chi-square test was used to identify unlikely correlations.
Figure 5:
Figure 5:. Nasopharyngeal microbiome composition correlates with age across childhood development.
A) Results of an ANOVA comparing nasopharyngeal swab microbiome Shannon’s diversity against demographic features of the subjects. B) Pearson’s correlation between the subject age and nasopharyngeal microbiome Shannon’s diversity. C) Results of a PERMANOVA analysis comparing Unifrac distances between subjects against demographic features. D) Non-metric dimensional scaling plot rotated to show the influence of age on Unifrac distances between subjects. E) Bar plot depicting the distribution of nasopharyngeal swab clusters across age. All 124 nasopharyngeal swabs were used in each analysis.

References

    1. Tony-Odigie A., Wilke L., Boutin S., Dalpke A. H. & Yi B. Commensal Bacteria in the Cystic Fibrosis Airway Microbiome Reduce P. aeruginosa Induced Inflammation. Front Cell Infect Microbiol 12, 824101 (2022). - PMC - PubMed
    1. Teo S. M. et al. Airway Microbiota Dynamics Uncover a Critical Window for Interplay of Pathogenic Bacteria and Allergy in Childhood Respiratory Disease. Cell Host Microbe 24, 341–352.e5 (2018). - PMC - PubMed
    1. van Meel E. R., Jaddoe V. W. V., Bønnelykke K., de Jongste J. C. & Duijts L. The role of respiratory tract infections and the microbiome in the development of asthma: A narrative review. Pediatr Pulmonol 52, 1363–1370 (2017). - PMC - PubMed
    1. Man W. H., de Steenhuijsen Piters W. A. A. & Bogaert D. The microbiota of the respiratory tract: gatekeeper to respiratory health. Nat Rev Microbiol 15, 259–270 (2017). - PMC - PubMed
    1. McCauley K. E. et al. Seasonal airway microbiome and transcriptome interactions promote childhood asthma exacerbations. J Allergy Clin Immunol 150, 204–213 (2022). - PubMed

Publication types