[Preprint]. 2023 Sep 22:2023.09.19.23295780.
doi: 10.1101/2023.09.19.23295780.

Rare variation in noncoding regions with evolutionary signatures contributes to autism spectrum disorder risk

Affiliations

Rare variation in noncoding regions with evolutionary signatures contributes to autism spectrum disorder risk

Taehwan Shin et al. medRxiv. .

Update in

Abstract

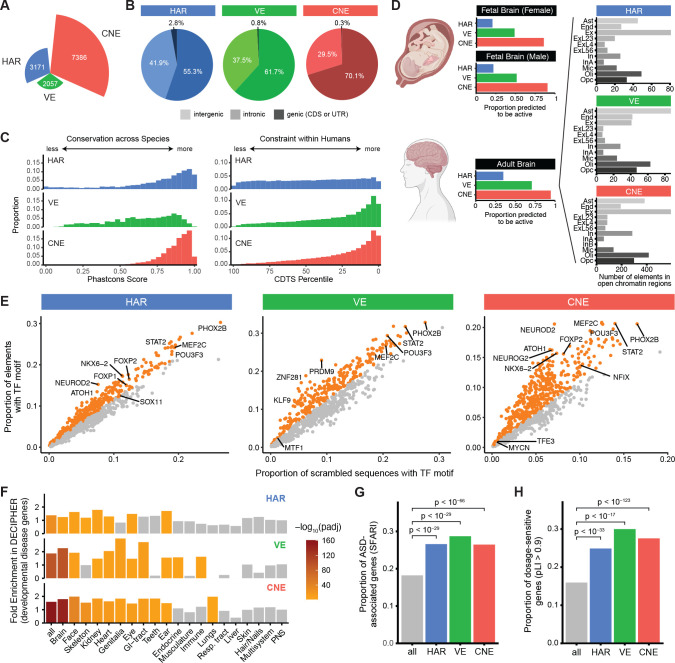
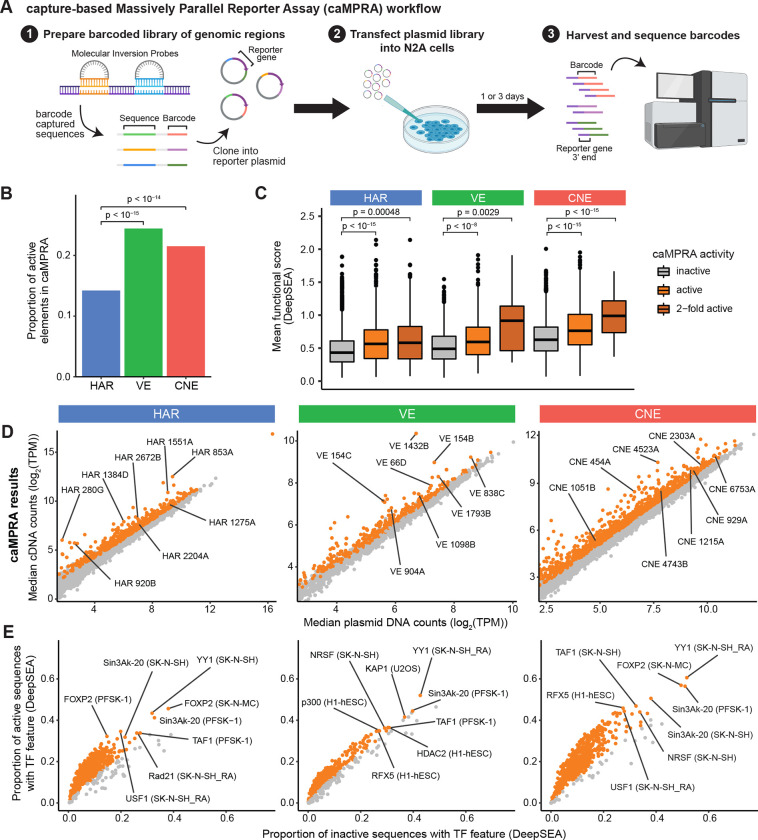
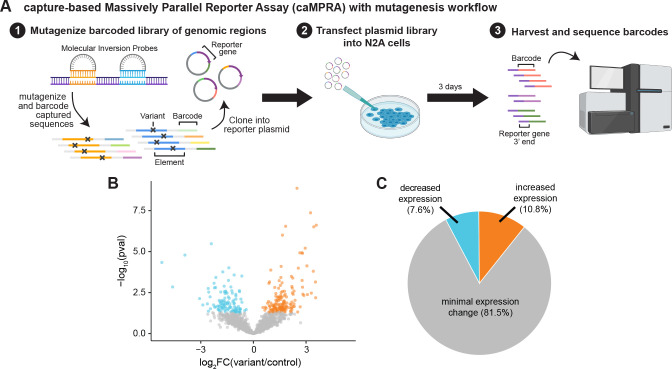
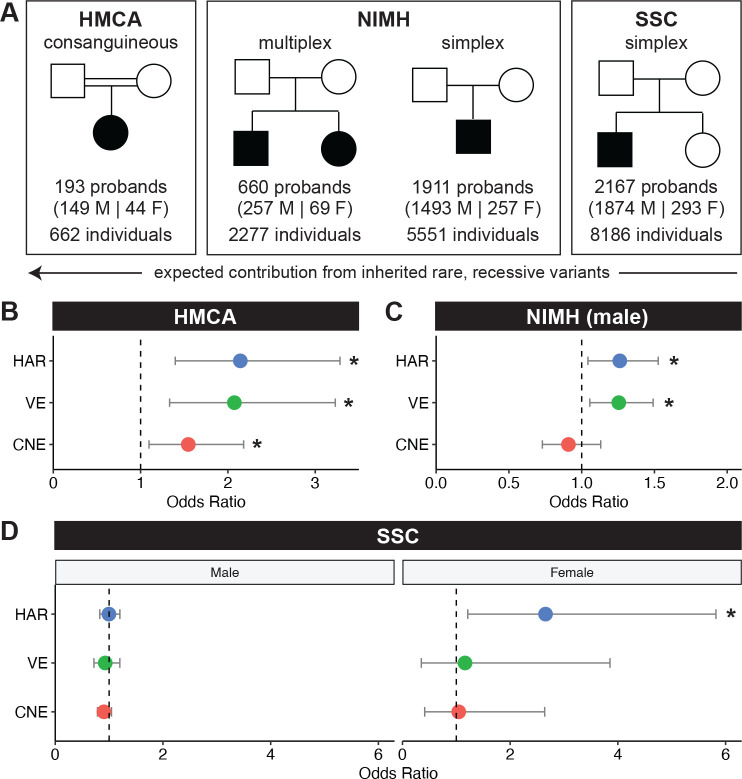
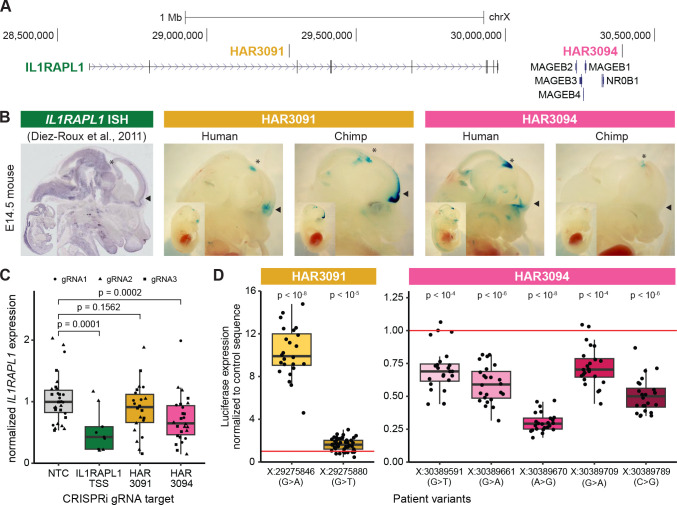
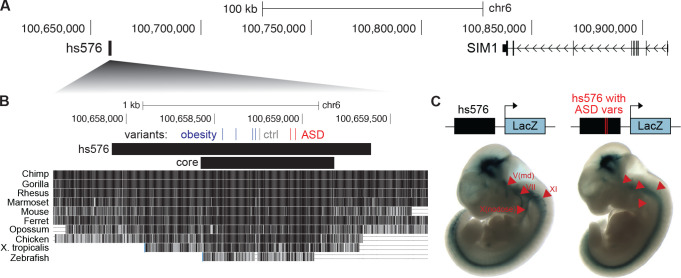
Little is known about the role of noncoding regions in the etiology of autism spectrum disorder (ASD). We examined three classes of noncoding regions: Human Accelerated Regions (HARs), which show signatures of positive selection in humans; experimentally validated neural Vista Enhancers (VEs); and conserved regions predicted to act as neural enhancers (CNEs). Targeted and whole genome analysis of >16,600 samples and >4900 ASD probands revealed that likely recessive, rare, inherited variants in HARs, VEs, and CNEs substantially contribute to ASD risk in probands whose parents share ancestry, which enriches for recessive contributions, but modestly, if at all, in simplex family structures. We identified multiple patient variants in HARs near IL1RAPL1 and in a VE near SIM1 and showed that they change enhancer activity. Our results implicate both human-evolved and evolutionarily conserved noncoding regions in ASD risk and suggest potential mechanisms of how changes in regulatory regions can modulate social behavior.

Keywords: Human Accelerated Regions; IL1RAPL1; SIM1; Vista Enhancers; autism spectrum disorder; caMPRA; consanguineous families; conserved neural enhancers; noncoding regions; recessive variants.


Conflict of interest statement

Declaration of Interests The authors declare no competing interests.

Figures

Figure 1:
Figure 1:. Genomic and epigenomic features of HARs, VEs, and CNEs.
(A) Number of HARs, VEs, and CNEs. (B) Proportion of HARs, VEs, and CNEs in intergenic (light coloring), intronic (moderate coloring), and genic (dark coloring) regions. (C) Conservation across species (left) and constraint within humans (right) of HARs, VEs, and CNEs are represented by phastCons score (Siepel et al., 2005) and CDTS percentile (di Iulio et al., 2018), respectively. (D) Proportion of HARs, VEs, and CNEs predicted to be active by ChromHMM based on epigenomic data from a fetal male brain, a fetal female brain, and an adult brain (Kundaje et al., 2015) (left). Number of HARs, VEs, and CNEs that overlap open chromatin regions from scTHS-seq across cell types in the adult brain (Lake et al., 2018). Ast: astrocytes, End: endothelial cells, Ex: excitatory neurons, ExL23: layers 2–3 excitatory neurons, ExL4: layers 4 excitatory neurons, ExL56: layers 5–6 excitatory neurons, In: inhibitory neurons, InA: inhibitory neurons subtype A, InB: inhibitory neurons subtype B, Mic: microglia, Oli: oligodendrocytes, Opc: oligodendrocyte precursor cells. (E) Enrichment of transcription factor (TF) binding site motifs in HARs, VEs, and CNEs compared to nucleotide-matched scrambled sequences (Materials and Methods). Orange dots indicate significantly enriched elements at 5% FDR. (F) Enrichment of HARs, VEs, and CNEs near genes associated with developmental diseases in different body systems from the DECIPHER consortium (Firth et al., 2009). (G) HARs, VEs, and CNEs are enriched near ASD-associated genes annotated in the SFARI database (Abrahams et al., 2013). (H) Genes near HARs, VEs, or CNEs are enriched for genes with pLI > 0.9. Genes with pLI > 0.9 are considered loss-of-function intolerant (Lek et al., 2016).
Figure 2:
Figure 2:. HARs, VEs, and CNEs display enhancer activity in a capture-based Massively Parallel Reporter Assay (caMPRA).
(A) Schematic of caMPRA method. Sequences of interest are captured by molecular inversion probes (MIPs), barcoded, and cloned upstream of a minimal promoter driving luciferase expression. ~500bp sequences are captured by separate MIP probes per HAR, VE, or CNE element. The enhancer reporter plasmid library is then transfected into N2A cells and cells are harvested one (D1) or three (D3) days after transfection. Transcribed barcodes and barcodes from the original plasmid library are sequenced to examine enhancer activity. The results from the D3 caMPRA experiment are shown in this figure, and the results from the D1 caMPRA experiment are shown in Fig. S6. (B) Proportion of VEs or CNEs that have enhancer activity in at least one captured sequence is significantly higher than HARs by the chi-square test after FDR correction. (C) Sequences captured from HARs, VEs, and CNEs are classified as inactive, active, or 2-fold active and compared to their predicted mean functional score from DeepSEA (average of −log10(evalue) for every feature) (Zhou and Troyanskaya, 2015). P-values were determined with the hypergeometric test and adjusted by FDR correction. (D) Normalized cDNA counts vs normalized plasmid counts for sequences captured from HARs, VEs, and CNEs. Sequences with significant enhancer activity are in orange. (E) TF features were predicted by DeepSEA for each captured sequence. TF features significantly enriched in active sequences by caMPRA are shown in orange. Representative TF features are marked in the format: TF (cell type).
Figure 3:
Figure 3:. Random variants in HARs can modulate enhancer activity.
(A) Schematic of caMPRA with random mutagenesis. (B) Volcano plot of fold change in expression and adjusted p-value for each mutagenized sequence. (C) Pie chart of percent of mutagenized sequences with decreased expression, increased expression, or no statistically significant change in expression.
Figure 4:
Figure 4:. The contribution of rare, recessive variants in HARs, VEs, and CNEs to ASD varies across cohorts based on family structure.
(A) We examined HARs, VEs, and CNEs in three cohorts: 1. HMCA, a consanguineous cohort; 2. NIMH, a cohort that includes multiplex and simplex families; 3. SSC, a cohort that only contains simplex families. (B) In the HMCA cohort, cases are enriched for rare, recessive variants in HARs (adjusted p = 0.0014), VEs (adjusted p = 0.0038), and CNEs (adjusted p = 0.0412) at allele frequency (AF) < 0.005. (C) In the NIMH cohort, male cases are enriched for rare, recessive variants in HARs (adjusted p = 0.0495) and VEs (adjusted p = 0.0297) at AF < 0.001. Combined autosomal rates for males and females were not significant, and there was insufficient sample size to assess females separately (Fig. S10A, B). (D) In the SSC cohort, female cases are enriched for rare, recessive variants in HARs (adjusted p = 0.0438) at AF < 0.005. All analyses are done on conserved bases, and allele frequency cut-offs were chosen based on predefined heuristics (Materials and Methods). Odds ratios are consistent across different AFs (Fig. S9A, Fig. S11, Fig. S12). Statistical analyses are detailed in Materials and Methods.
Figure 5:
Figure 5:. Patient variants in HAR3091 and HAR3094 likely regulate IL1RAPL1 expression in multiple brain regions.
(A) The genomic region containing IL1RAPL1, HAR3091, and HAR3094. (B) Constructs containing either the human or chimpanzee version of HAR3091 and HAR3094 cloned upstream of a minimal promoter driving lacZ expression were randomly integrated into mice and analyzed at E14.5. HAR3091 has enhancer activity predominantly in the telencephalon and olfactory bulb (filled arrowheads), and the human version of HAR3091 is a weaker enhancer than the chimpanzee version. In contrast, HAR3094 has enhancer activity predominantly in the midbrain (asterisks), and the human version of HAR3094 is a stronger enhancer than the chimpanzee version. Representative embryos are shown (all embryos are in Fig. S14). In situ hybridization of IL1RAPL1 at E14.5 from the Eurexpress database (Diez-Roux et al., 2011) is shown for comparison. (C) CRISPRi targeting the IL1RAPL1 TSS and HAR3094 significantly decrease IL1RAPL1 expression compared to the non-targeting control (NTC) gRNAs in iPSC-derived neurons induced by NGN2 expression. Multiple gRNAs were tested per target region. (D) Patient variants in HAR3091 and HAR3094 were tested for luciferase expression in N2A cells. HAR3091 patient variants significantly increased luciferase expression, whereas HAR3094 patient variants significantly decreased luciferase expression. Statistical analyses are detailed in Materials and Methods. Coordinates are in hg19.
Figure 6:
Figure 6:. Patient variants in hs576 (VE854) reduce enhancer activity in cranial nerves.
(A) The genomic region containing hs576 and SIM1. (B) The locations of two ASD patient variants from the HMCA and NIMH cohorts (ASD; red), two variants from one control individual (ctrl; gray), and four previously identified obesity-associated variants (blue) (Kim et al., 2014) are indicated. These variants are all located in the most conserved region of hs576 (core), which recapitulates most of the enhancer activity of the entire hs576 element (Kim et al., 2014). (C) Constructs containing hs576 without (n = 4) or with (n = 6) the two ASD patient variants upstream of a minimal promoter driving the lacZ gene were integrated into the safe-harbor H11 locus and analyzed for lacZ expression at E11.5 (Materials and Methods). Arrowheads indicate cranial nerves where the inclusion of the two ASD patient variants reduces enhancer activity. Representative embryos are shown (all embryos are in Fig. S17). Coordinates are in hg19.

References

    1. Abrahams B. S., Arking D. E., Campbell D. B., Mefford H. C., Morrow E. M., Weiss L. A., Menashe I., Wadkins T., Banerjee-Basu S., and Packer A., et al. , 2013. SFARI Gene 2.0: A community-driven knowledge-base for the autism spectrum disorders (ASDs). Molecular Autism, 4:36. - PMC - PubMed
    1. Ahituv N., Kavaslar N., Schackwitz W., Ustaszewska A., Martin J., Hébert S., Doelle H., Ersoy B., Kryukov G., Schmidt S., et al. , 2007. Medical sequencing at the extremes of human body mass. American Journal of Human Genetics, 80(4):779–791. - PMC - PubMed
    1. Akula S. K., Marciano J. H., Lim Y., Exposito-Alonso D., Hylton N. K., Hwang G. H., Neil J. E., Dominado N., Bunton-Stasyshyn R. K., Song J. H. T., et al. , 2023. TMEM161B regulates cerebral cortical gyration, Sonic Hedgehog signaling, and ciliary structure in the developing central nervous system. Proceedings of the National Academy of Sciences, 120(4):e2209964120. - PMC - PubMed
    1. Albert-Gasco H., Ros-Bernal F., Castillo-Gómez E., and Olucha-Bordonau F. E., 2020. MAP/ERK signaling in developing cognitive and emotional function and its effect on pathological and neurodegenerative processes. International Journal of Molecular Sciences, 21(12):4471. - PMC - PubMed
    1. Altman D. G., 1991. Practical Statistics for Medical Research. Chapman and Hall, London.

Publication types