[Preprint]. 2023 Sep 18:2023.09.18.558307.
doi: 10.1101/2023.09.18.558307.

Nanoparticle delivery of innate immune agonists combines with senescence-inducing agents to mediate T cell control of pancreatic cancer

Affiliations

Nanoparticle delivery of innate immune agonists combines with senescence-inducing agents to mediate T cell control of pancreatic cancer

Loretah Chibaya et al. bioRxiv. .

Update in

Abstract

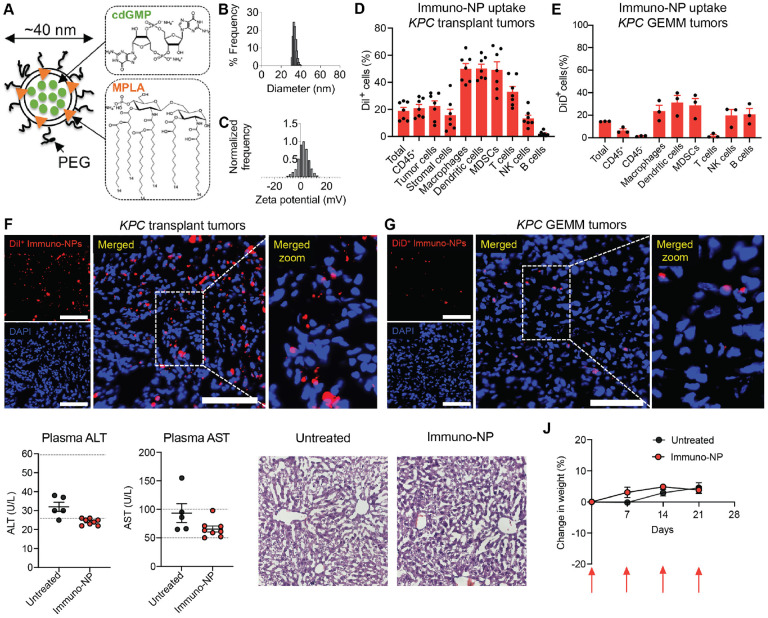
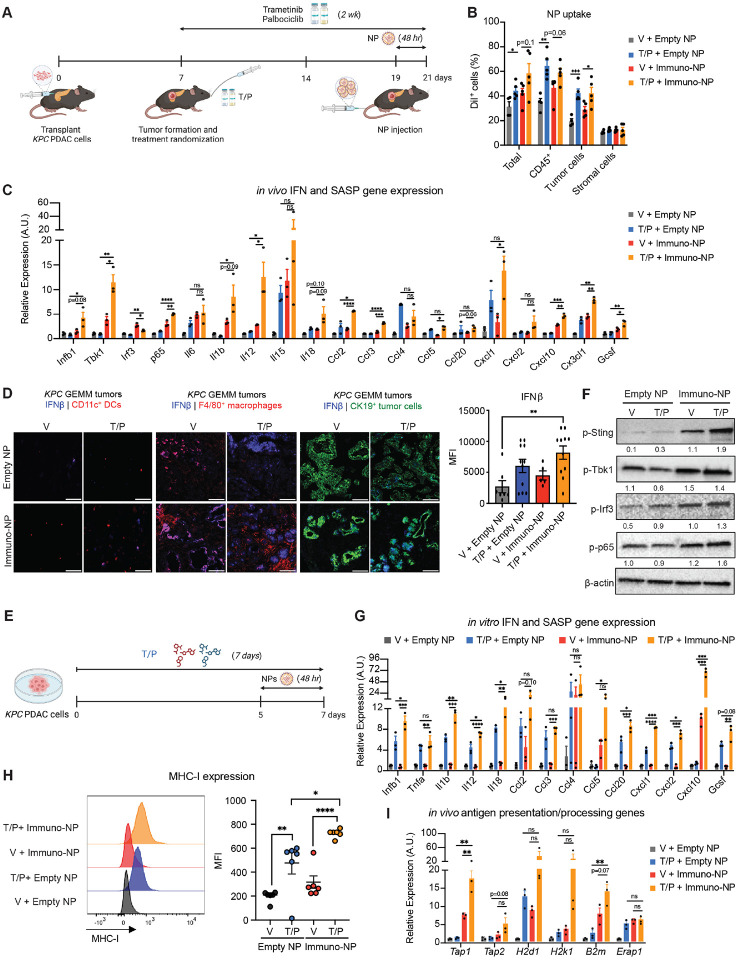
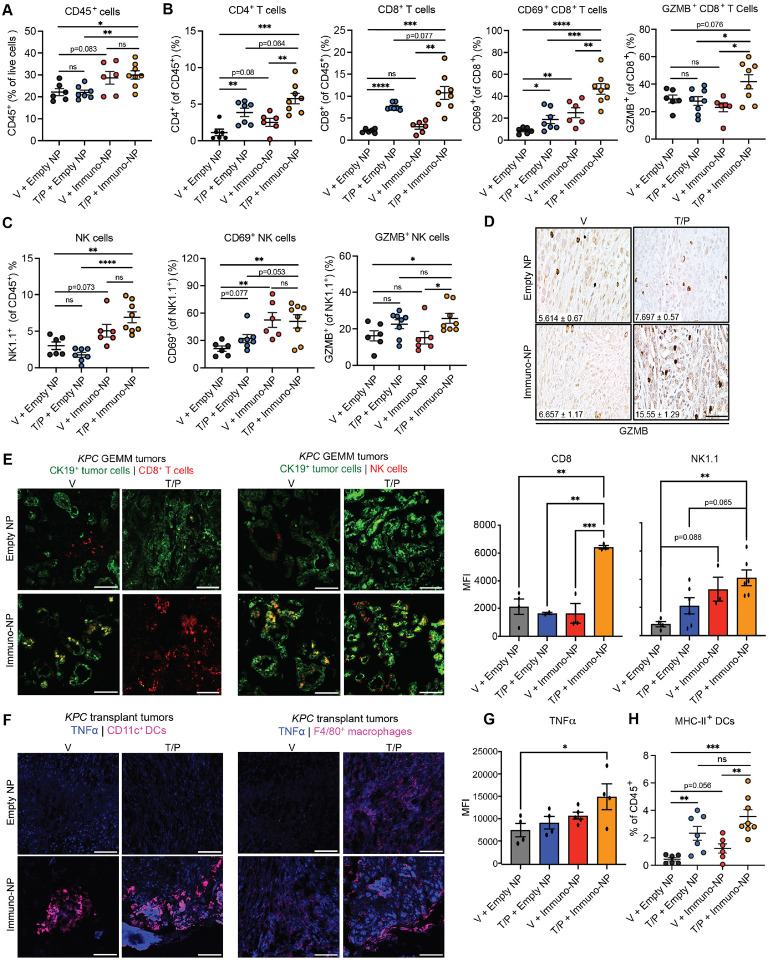
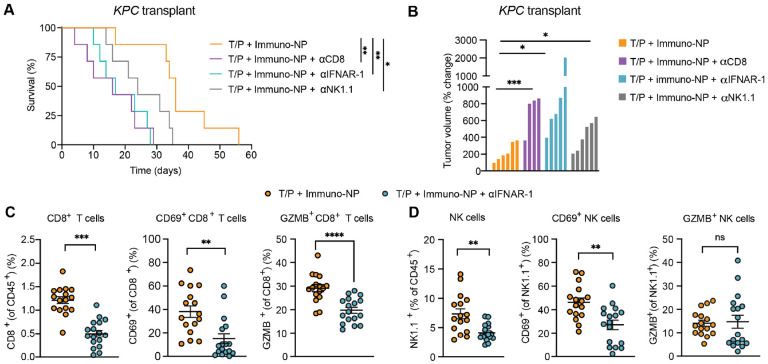
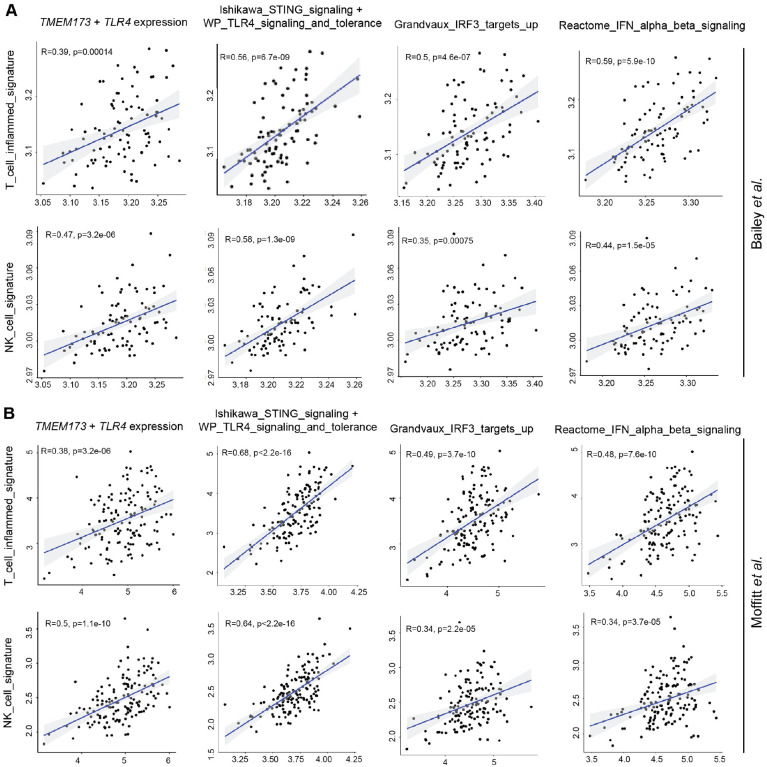
Pancreatic ductal adenocarcinoma has quickly risen to become the 3rd leading cause of cancer-related death. This is in part due to its fibrotic tumor microenvironment (TME) that contributes to poor vascularization and immune infiltration and subsequent chemo- and immunotherapy failure. Here we investigated an innovative immunotherapy approach combining local delivery of STING and TLR4 innate immune agonists via lipid-based nanoparticles (NPs) co-encapsulation with senescence-inducing RAS-targeted therapies that can remodel the immune suppressive PDAC TME through the senescence-associated secretory phenotype. Treatment of transplanted and autochthonous PDAC mouse models with these regimens led to enhanced uptake of NPs by multiple cell types in the PDAC TME, induction of type I interferon and other pro-inflammatory signaling, increased antigen presentation by tumor cells and antigen presenting cells, and subsequent activation of both innate and adaptive immune responses. This two-pronged approach produced potent T cell-driven and Type I interferon-dependent tumor regressions and long-term survival in preclinical PDAC models. STING and TLR4-mediated Type I interferon signaling were also associated with enhanced NK and CD8+ T cell immunity in human PDAC. Thus, combining localized immune agonist delivery with systemic tumor-targeted therapy can synergize to orchestrate a coordinated innate and adaptive immune assault to overcome immune suppression and activate durable anti-tumor T cell responses against PDAC.


Conflict of interest statement

Competing Interests: M.R. is a consultant for Boehringer Ingelheim. L.C., G.I.K., P.U.A., and M.R. have filed a U.S. patent application (Ser. No. 63/466,164) related to this work. The other authors declare no competing interests.

Figures

Fig. 1.
Fig. 1.. Systemic administration of NPs can deliver cargo locally to multiple cell types in PDAC TME with minimal toxicity.
(A) Schematic representation of immuno-NP design. (B) NP hydrodynamic size as assessed by dynamic light scattering (DLS). (C) Measurement of NP surface charge as assessed by zeta potential. (D) KPC1 PDAC tumor cells expressing luciferase-GFP were injected orthotopically into the pancreas of 8–12 week old C57BL/6 female mice. Following tumor formation, mice received a single dose of fluorescently labeled immuno-NPs by intravenous (i.v.) injection. Flow cytometry analysis of DiI+ NP uptake in indicated cell types 48hrs later is shown (n = 7 mice per group). Tumor cells were defined as GFP+, and stromal cells as CD45GFP. (E) PDAC-bearing KPC GEMM mice were i.v. injected with a single dose of fluorescently labeled immuno-NPs. Flow cytometry analysis of DiD-labeled NP uptake in different cell types 48hrs later is shown (n = 3 mice per group). (F) Representative immunofluorescence (IF) staining of KPC1 orthotopic transplant PDAC tumors for expression of DiI-labeled immuno-NPs. Scale bars, 100 μm. (G) Representative immunofluorescence (IF) staining of KPC GEMM PDAC tumors for expression of DiD-labeled immuno-NPs. Scale bars, 100 μm. (H) Plasma AST and ALT levels in Wild-type (WT) C57BL/6 mice either untreated or treated with immuno-NPs weekly for 3 weeks (n = 5 to 8 mice per group). Dotted lines indicate established range for normal AST and ALT levels. (I) Representative Hematoxylin and eosin (H&E) staining of livers from WT C57BL/6 mice treated as in (H). (J) Change in tumor weight of WT C57BL/6 mice treated as in (H) (n = 5 to 8 mice per group). Arrows indicate when immuno-NPs were administered. Error bars, mean ± SEM.
Fig. 2
Fig. 2. T/P pre-treatment enhances immuno-NP uptake, IFN and cytokine production, and antigen presentation in tumor cells and APCs.
(A) Schematic of KPC orthotopic transplant model and 2-week treatment schedule. (B) Flow cytometry analysis of DiI-labeled NP uptake in indicated cellular compartments in KPC1 transplant PDAC tumors from mice treated with vehicle or trametinib (1 mg/kg) and palbociclib (100 mg/kg) for 2 weeks and empty- or immuno-NPs for 48 hrs (n = 4 to 5 mice per group). Tumor cells were defined as GFP+, and stromal cells as CD45GFP. (C) RT-qPCR analysis of IFN pathway and SASP gene expression in KPC1 transplant PDAC tumors from mice treated as in (B) (n = 3 mice per group). A.U., arbitrary units. (D) Representative IF staining of KPC GEMM PDAC tumors from mice treated as in (B) for expression of IFNβ in DCs (CD11c+), macrophages (F4/80+), and tumor cells (CK19+). Quantification of mean fluorescent intensity (MFI) of total IFNβ expression in tissues is shown in last panel on right (n = 3 mice per group). Scale bars, 100 μm. (E) Schematic of KPC1 cell line in vitro treatment schedule. (F) Immunoblots of KPC1 PDAC cells treated in vitro with vehicle or trametinib (25 nM) and palbociclib (500 nM) for 1 week and empty- or immuno-NPs for 48 hrs. Numbers indicate band density normalized to β-actin loading control. (G) RT-qPCR analysis of IFN pathway and SASP gene expression in KPC1 PDAC cells treated as in (F) (n = 3 samples per group). A.U., arbitrary units. (H) Representative histograms (left) and quantification of MHC-I (H-2kb) MFI (right) on KPC1 PDAC cells treated as in (F) (n = 6 samples per group). (I) RT-qPCR analysis of antigen presentation/processing gene expression in KPC1 transplant PDAC tumors from mice treated as in (B) (n = 3 mice per group). A.U., arbitrary units. Error bars, mean ± SEM. P values were calculated using two-tailed, unpaired Student’s t-test. **** P <0.0001, *** P <0.001, ** P <0.01, * P <0.05. n.s., not significant.
Fig. 3.
Fig. 3.. Combinatorial immuno-NP and T/P treatment activates NK and CD8+ T cell immunity in PDAC.
(A to C) Flow cytometry analysis of total CD45+ immune cells (A), T cell numbers and activation markers (B), and NK cell numbers and activation markers (C) in KPC1 orthotopic transplant PDAC tumors from mice treated with vehicle or trametinib (1 mg/kg) and palbociclib (100 mg/kg) for 2 weeks and empty- or immuno-NPs for 48 hrs (n = 6 to 8 mice per group). (D) Immunohistochemical (IHC) staining of KPC1 orthotopic transplant PDAC tumors from mice treated as in (A). Quantification of the number of degranulating Granzyme B (GZMB)+ cells per field is shown inset (n = 3 to 6 mice per group). Scale bar, 50μm. (E) IF staining of PDAC tumors from KPC GEMM mice treated as in (A) (left). Quantification of NK1.1+ NK cell and CD8+ T cell MFI is shown on right (n = 3 mice per group). Scale bars, 100 μm. (F) IF staining for TNFα expression in CD11c+ DCs (left) and F4/80+ macrophages (right) in PDAC tumors from KPC1 transplant mice treated as in (A). Scale bars, 100 μm. (G) Quantification of combined TNFα MFI in macrophages and DCs from IF staining in (F) (n = 3 mice per group). (H) Flow cytometry analysis of MHC-II+ DCs in KPC1 transplant PDAC tumors from mice treated as in (A) (n = 6 to 8 mice per group). Error bars, mean ± SEM. P values were calculated using two-tailed, unpaired Student’s t-test. **** P <0.0001, *** P <0.001, ** P <0.01, * P <0.05. n.s., not significant.
Fig. 4.
Fig. 4.. Immuno-NP and T/P regimens produce tumor control and substantially increase overall survival in preclinical PDAC models.
(A) Waterfall plot of the response of KPC1 transplant PDAC tumors after treatment with vehicle or trametinib (1 mg/kg) and palbociclib (100 mg/kg) 4 times per week and empty- or immuno-NPs weekly for 2 weeks (n = 12 to 13 mice per group). (B) H&E staining of KPC1 transplant PDAC tumors from mice treated with vehicle or trametinib (1 mg/kg) and palbociclib (100 mg/kg) for 2 weeks and empty- or immuno-NPs for 48 hrs. Quantification of percent of tumor area covered in necrosis is shown inset (n = 5 to 6 mice per group). Scale bar, 500μm. (C) Kaplan-Meier survival curve of mice harboring KPC1 transplant PDAC tumors treated with vehicle or trametinib (1 mg/kg) and palbociclib (100 mg/kg) 4 times per week and empty- or immuno-NPs weekly (n = 7 to 8 mice per group). (D) Waterfall plot of the response of KPC GEMM PDAC tumors to treatment as in (A) (n = 5 to 9 mice per group). (E) H&E staining of KPC GEMM PDAC tumors from mice treated as in (B). Quantification of percent of tumor area covered in necrosis is shown inset (n = 4 to 7 mice per group). Scale bar, 500μm. (F) Kaplan-Meier survival curve of PDAC-bearing KPC GEMM animals treated as in (C) (n = 8 to 10 mice per group). Arrows indicate when mice were taken off of treatment. Error bars, mean ± SEM. P values were calculated using two-tailed, unpaired Student’s t-test (A and D) or log-rank test (C and F). **** P <0.0001, *** P <0.001, ** P <0.01, * P <0.05. n.s., not significant.
Fig. 5.
Fig. 5.. Immuno-NP and T/P therapy efficacy driven by IFNAR-dependent NK and CD8+ T cell immune surveillance.
(A) Kaplan-Meier survival curve of mice harboring KPC1 transplant PDAC tumors treated with trametinib (1 mg/kg) and palbociclib (100 mg/kg) 4 times per week, immuno-NPs weekly, and blocking antibodies against NK1.1 (PK136; 250 μg), CD8 (2.43; 200 μg), or IFNAR-1 (MAR15A3; 200 μg) twice per week (n = 7 mice per group). (B) Waterfall plot of the response of KPC1 transplant PDAC tumors to 2 weeks of treatment as in (A) (n = 4 to 7 mice per group). (C to D) Flow cytometry analysis of CD8+ T cell (C) and NK cell (D) numbers and activation markers in KPC1 transplant PDAC tumors from mice treated with trametinib (1 mg/kg) and palbociclib (100 mg/kg) 4 times per week, immuno-NPs weekly, and neutralizing antibodies against IFNAR-1 (MAR15A3; 200 μg) administered twice per week for 2 weeks (n = 16 to 17 mice per group). Error bars, mean ± SEM. P values were calculated using log-rank test (A) or two-tailed, unpaired Student’s t-test (B to D). **** P <0.0001, *** P <0.001, ** P <0.01, * P <0.05. n.s., not significant.
Figure 6.
Figure 6.. STING and TLR4 expression and Type I interferon signaling correlate with NK and T cell immunity in human PDAC.
(A to B) Pearson’s correlation analysis plots comparing NK and T cell signatures with expression of STING (TMEM174), TLR4, and downstream interferon signaling pathway genes in human PDAC transcriptomic data from Bailey et al. (35) (A) and Moffitt et al. (36) (B) (n = 91 to 145 samples). Pearson’s correlation coefficient (R) values are displayed. P values were calculated using a two-tailed, unpaired Student’s t-test.

References

    1. Siegel R. L., Miller K. D., Wagle N. S., Jemal A., Cancer statistics, 2023. CA Cancer J Clin 73, 17–48 (2023). - PubMed
    1. Ho W. J., Jaffee E. M., Zheng L., The tumour microenvironment in pancreatic cancer - clinical challenges and opportunities. Nat Rev Clin Oncol 17, 527–540 (2020). - PMC - PubMed
    1. Brahmer J. R., Tykodi S. S., Chow L. Q., Hwu W. J., Topalian S. L., Hwu P., Drake C. G., Camacho L. H., Kauh J., Odunsi K., Pitot H. C., Hamid O., Bhatia S., Martins R., Eaton K., Chen S., Salay T. M., Alaparthy S., Grosso J. F., Korman A. J., Parker S. M., Agrawal S., Goldberg S. M., Pardoll D. M., Gupta A., Wigginton J. M., Safety and activity of anti-PD-L1 antibody in patients with advanced cancer. N Engl J Med 366, 2455–2465 (2012). - PMC - PubMed
    1. Royal R. E., Levy C., Turner K., Mathur A., Hughes M., Kammula U. S., Sherry R. M., Topalian S. L., Yang J. C., Lowy I., Rosenberg S. A., Phase 2 trial of single agent Ipilimumab (anti-CTLA-4) for locally advanced or metastatic pancreatic adenocarcinoma. J Immunother 33, 828–833 (2010). - PMC - PubMed
    1. Bear A. S., Vonderheide R. H., O’Hara M. H., Challenges and Opportunities for Pancreatic Cancer Immunotherapy. Cancer Cell 38, 788–802 (2020). - PMC - PubMed

Publication types