[Preprint]. 2023 Sep 14:rs.3.rs-3290264.
doi: 10.21203/rs.3.rs-3290264/v1.

Systematic investigation of chemo-immunotherapy synergism to shift anti-PD-1 resistance in cancer

Affiliations

Systematic investigation of chemo-immunotherapy synergism to shift anti-PD-1 resistance in cancer

Yue Wang et al. Res Sq. .

Update in

Abstract

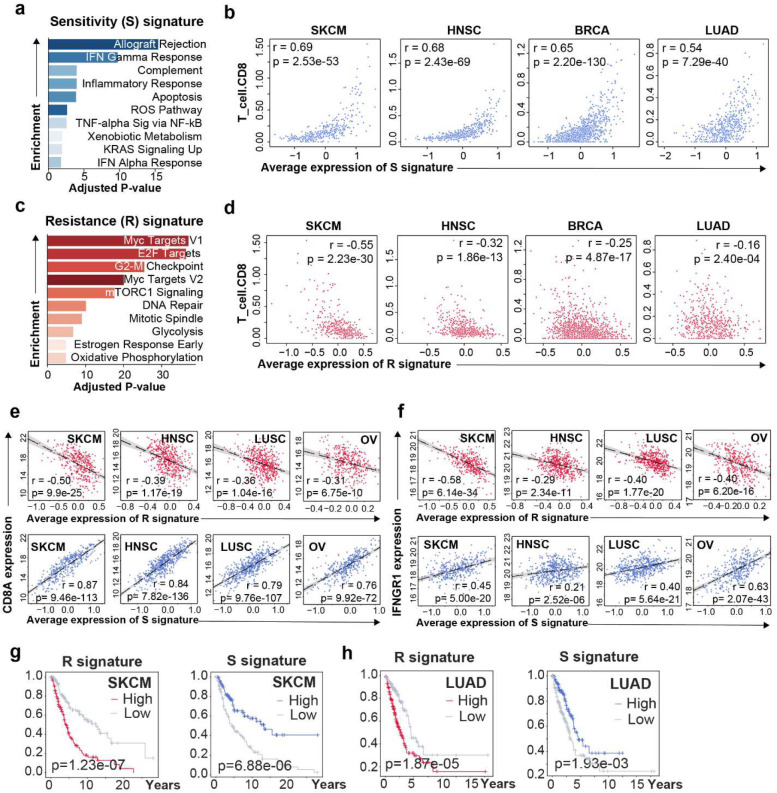
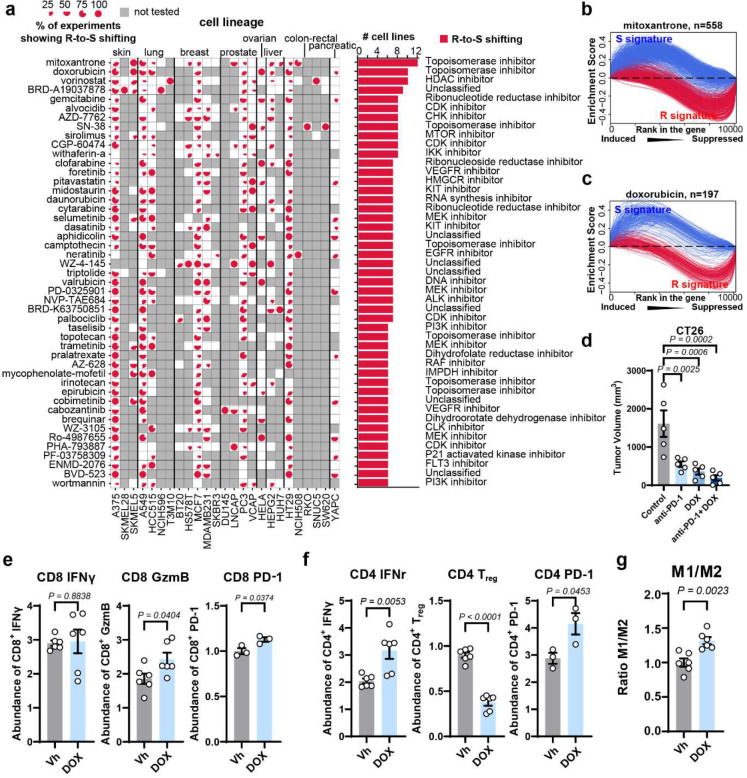
Chemo-immunotherapy combinations have been regarded as one of the most practical ways to improve immunotherapy response in cancer patients. In this study, we integrated the transcriptomics data from immunotherapy-treated tumors and compound-treated cell lines to systematically identify chemo-immunotherapy synergisms and their underlying mechanisms. Through analyzing anti-PD-1 treatment induced expression changes in patient tumors, we developed a shift ability score that can measure whether a chemotherapy treatment shifts anti-PD-1 response. By applying the shift ability analysis on 41,321 compounds and 16,853 shRNA treated cancer cell line expression profiles, we characterized a systematic landscape of chemo-immunotherapy synergism and prioritized 17 potential synergy targets. Further investigation of the treatment induced transcriptomic data revealed that a mitophagy-dsRNA-MAVS-dependent activation of type I IFN signaling may be a novel mechanism for chemo-immunotherapy synergism. Our study represents the first comprehensive effort to mechanistically characterize chemo-immunotherapy synergism and will facilitate future pre-clinical and clinical studies.


Conflict of interest statement

Competing interests: Authors declare that they have no competing interests.

Figures

Fig. 1
Fig. 1. Treatment-induced expression changes can predict anti-PD-1 response in patients.
a, Receiver operating characteristic (ROC) curve showing the performance of using treatment-naïve (grey) or treatment-induced (red) expression to classify anti-PD-1 responders and non-responders. The kernel density estimation plot in the corner showed the distribution of patient response groups on the first principal component of treatment-naïve expression (upper) or treatment-induced expression (lower). b, Volcano plot showing the identification of R and S signatures. Y-axis represents the Wilcoxon rank-sum test of gene expression on treatment-induced level between anti-PD-1 sensitive patients and resistant patients. The highlighted genes have significantly differential treatment-induced change between response groups. Blue-highlighted genes have higher treatment-induced expression changes in anti-PD-1 sensitive patients (i.e., S signature). Red-highlighted genes have higher expression changes in anti-PD-1 resistant patients, (i.e., R signature). c, Average gene expression of R signature genes (left) and S signature genes (right) across different response group in multiple cancer types (GSE93157). CR: complete response. PR: partial response. SD: stable disease. PD: progressive disease. d, Integrating R and S signature to classify anti-PD-1 responders and non-responders in training cohort (GSE91061) and GSE93157. ROC curve (left) shows the classification performance in different cancer types. Bar plot (right) shows the area under the curve (auc) of the corresponding ROC curve on the left panel.
Fig. 2
Fig. 2. R and S signature associate with anti-tumor immunity in cancer patients.
a, Pathway enrichment of genes involved in S signature. X-axis represents adjusted P-value derived from gene set enrichment analysis. Color degree represents the enrichment score derived from the same analysis. b, Scatter plots showing the association between CD8+ T cell infiltration and average S gene expression across TCGA cancer types. c, Pathway enrichment of genes involved in R signature. X-axis represents adjusted P-value derived from gene set enrichment analysis. Color degree represents the enrichment score derived from the same analysis. d, Scatter plots showing the association between CD8+ T cell infiltration and average S gene expression across TCGA cancer types. e and f, Scatter plots showing the association between CD8A e, or IFNGR1 (f) expression (log2FPKM-UQ) and average R (upper) or S (lower) gene expression across TCGA cancer types. g and h, Kaplan-Meier plots of patients grouped by average R (g) or S (h) gene expression in melanoma (upper) and lung adenocarcinoma (lower). High (low) groups are defined as top (bottom) one-third average expression in the corresponding cancer types.
Fig. 3
Fig. 3. Genetic inhibition of genes in R and S signature can shift immunotherapy response phenotypes.
a, Graph demonstration of R and S signature enrichment and shift ability analysis. b, Number of R (left) or S (right) targeting shRNAs that are able to knock down the target genes (shX w/KO), to suppress the target signature (X sig down), and to induce the other signature while suppressing the target signature (X sig down + Y sig up). c, Suppression of R signature (above) and induction of S signature (bottom) by shRNAs targeting the R signature genes. Color scale indicates the enrichment score of corresponding signatures in each experiment. Size of triangles indicates the knockdown efficiency given by the expression changes of target genes compared to other experiments in the same panel. Direction of triangles indicates the direction of expression changes. d, Enrichment curves of R signature and S signature in SMAD3 knockdown cell lines. e, Enrichment curves of R signature and S signature in MYC knockdown cell lines. f, Distribution of shift ability score of shRNAs targeting R signatures (shR) or S signatures (shS) across different cell lines. P values are given by two sample KS test.
Fig. 4
Fig. 4. Shift ability analysis on compound-treated transcriptomes identified the landscape of chemo-immunotherapy synergism.
a, Stacked density plot of top R-to-S shifting drug targets in A375 melanoma cell line. X-axis indicates shift ability. Y-axis indicates density. Red-highlighted text indicates the major drug targets in significant R-to-S shifting range (shift ability >= 0.7). b, Stacked density plot of top R-to-S shifting drug targets in HT29 colorectal cell line. X-axis indicates shift ability. Y-axis indicates density. Red-highlighted text indicates the major drug targets in significant R-to-S shifting range (shift ability >= 0.7). c, Prioritized potent targets for chemo-immunotherapy synergism. Drug names showed beside the potent gene targets are their corresponding pharmacological inhibitors. Circles indicate the shift ability of shRNAs, with big circles showing the average and small circles showing the individual experiments. Triangles indicate the shift ability of compound treatment, with big triangles showing the average and small triangles showing the individual experiments. Bar plots on the right side of the strip plot showed the number of TCGA cancer types where the corresponding genes have significantly positive (red) or negative (blue) correlation with different anti-tumor immunity signatures. d, Enrichment curves of R signature and S signature in PAK4 knockdown (left) and PAK4 inhibitor treated (right) cell lines (A375 and HT29). e, Association between PAK4 expression and immune cell infiltration in TCGA samples. f, PAK4 expression in patients before and after anti-PD-1 therapy from cohort GSE91061 and cohort GSE168204.
Fig. 5
Fig. 5. Landscape of pan-cancer chemo-immunotherapy synergism.
a, Compounds that showed R-to-S shifting in multiple cell lines. Pie charts in each cell indicate the percentage of experiments showed a R-to-S shift ability. The bar plot on the right side of the pie matrix indicates the number of cell lines where the compounds showed R-to-S shifting in at least one experiment. Untested cell lines are shaded by grey. b, Enrichment curves of R signature and S signature in mitoxantrone treated cell lines. c, Enrichment curves of R signature and S signature in doxorubicin treated cell lines. d, Tumor volumes in CT26 tumor bearing mice after anti-PD-1, doxorubicin and combination treatments. n = 6 mice per group. e, Single-cell suspensions were prepared from CT26 tumor samples and subjected to flow cytometry analysis of CD4+ subtype T cells (CD4+ IFNγ+ T cells, FoxP3+ T cells, CD4+ PD-1+ T cells). f, Single-cell suspensions were prepared from CT26 tumor samples and subjected to flow cytometry analysis of CD8+ subtype T cells (CD8+ IFNγ+ T cells, GzmB+ T cells, CD8+ PD-1+ T cells). g, M1/M2 ratio of tumor associated macrophages (TAM) in CT26 colorectal tumor tissues
Fig. 6
Fig. 6. PAK4 inhibitor can induce immune response through autophagy-mtRNA-MAVS-CXCL10 axis in cancer cells.
a, Treatment induced expression analyses reveals mechanisms of chemo-immunotherapy synergisms. b, Immunoblotting analysis of LC3 protein in cancer cells after 48 h of PF-03758309 (PAKi) treatment. Heat map (Right) indicates fold change of LC3-I and LC3-II band intensity, normalized to respective β-actin. c, PAKi treatment induces mitophagy in MCF7 cells. Florescence assay-based detection of mitophagy in 24 h DMSO and 500 nM PF-03758309 treated MCF7 cells. Arrowheads indicate mtphagy dye signals, Scale bar: 20 μm. d, Association between dosage and immunity induction of PAK4 inhibitor PF-03758309 in multiple cancer cell lines. PF-03758309 induces mitophagy in MCF7 cells. MCF7 cells were treated with 500 nM of PF-03758309 e and f, qRT-PCR validation of antigen presenting and processing genes (e) and interferon stimulated genes (f) in MCF7 cells after 48 h of PAKi (200 nM) treatment. 0 nM or vehicle served as control, n = 3 technical replicates. g and h, The CXCL10 expression, detected by qRT-PCR (g) and ELISA analysis (h), in cancer cells after 48 h of PAKi treatment. Concentration of PF-03758309 used: 0, 2, 50 and 500 nM for MEL-526; 0, 50, 200 and 500 nM for MEL-888, MCF7 and MDA-MB-468 cells. n = 3 technical or biological replicates. i, PAKi treatment induces dsRNA accumulation in MCF7 cells. Immunofluorescence analysis in 24 h DMSO or PF-03758309 treated MCF7 cells. Scale bar: 20 μm. j, PAKi treatment induces dose-depended dsRNA expression in MCF7 cells (24 h). n = 8 replicates from two independent experiments with 4 biological replicates. k, Immunoblotting analysis in MCF7 sgControl and sgMAVS cells after 48 h of PAKi treatment. l, qRT-PCR analysis of IFNB1 and interferon stimulated genes in MCF7 sgControl and sgMAVS cells after 48 h of PAKi treatment. n = 3 technical replicates. m, The CXCL10 expression, detected by qRT-PCR (top) and ELISA analysis (bottom), in MCF7 sgControl and sgMAVS after 48 h of PAKi treatment. n = 3 technical or biological replicates. Data in e-h, j, l, and m are presented as mean ± SD, P values were generated using a two-tailed Student’s t-test, P > 0.05 was indicated as ns.

References

    1. Ribas A. et al. Association of Pembrolizumab With Tumor Response and Survival Among Patients With Advanced Melanoma. JAMA 315, 1600–1609, doi:10.1001/jama.2016.4059 (2016). - DOI - PubMed
    1. Schadendorf D. et al. Pooled Analysis of Long-Term Survival Data From Phase II and Phase III Trials of Ipilimumab in Unresectable or Metastatic Melanoma. J Clin Oncol 33, 1889–1894, doi:10.1200/JCO.2014.56.2736 (2015). - DOI - PMC - PubMed
    1. Brahmer J. et al. Nivolumab versus Docetaxel in Advanced Squamous-Cell Non–Small-Cell Lung Cancer. New England Journal of Medicine 373, 123–135, doi:10.1056/NEJMoa1504627 (2015). - DOI - PMC - PubMed
    1. Smith K. M. & Desai J. Nivolumab for the treatment of colorectal cancer. Expert Review of Anticancer Therapy 18, 611–618, doi:10.1080/14737140.2018.1480942 (2018). - DOI - PubMed
    1. Keenan T. E. & Tolaney S. M. Role of Immunotherapy in Triple-Negative Breast Cancer. Journal of the National Comprehensive Cancer Network J Natl Compr Canc Netw 18, 479–489, doi:10.6004/jnccn.2020.7554 (2020). - DOI - PubMed

Publication types

LinkOut - more resources