. 2023 Oct 1;150(19):dev201865.
doi: 10.1242/dev.201865. Epub 2023 Oct 5.

Human pluripotent stem cell-derived inner ear organoids recapitulate otic development in vitro

Affiliations

Human pluripotent stem cell-derived inner ear organoids recapitulate otic development in vitro

Daniela Doda et al. Development. .

Abstract

Our molecular understanding of the early stages of human inner ear development has been limited by the difficulty in accessing fetal samples at early gestational stages. As an alternative, previous studies have shown that inner ear morphogenesis can be partially recapitulated using induced pluripotent stem cells directed to differentiate into inner ear organoids (IEOs). Once validated and benchmarked, these systems could represent unique tools to complement and refine our understanding of human otic differentiation and model developmental defects. Here, we provide the first direct comparisons of the early human embryonic otocyst and fetal sensory organs with human IEOs. We use multiplexed immunostaining and single-cell RNA-sequencing to characterize IEOs at three key developmental steps, providing a new and unique signature of in vitro-derived otic placode, epithelium, neuroblasts and sensory epithelia. In parallel, we evaluate the expression and localization of crucial markers at these equivalent stages in human embryos. Together, our data indicate that the current state-of-the-art protocol enables the specification of bona fide otic tissue, supporting the further application of IEOs to inform inner ear biology and disease.

Keywords: Hair cells; Human iPSC-derived inner ear organoids; Human otocyst; Inner ear development; Otic neuroblasts; Sensory epithelia.


Conflict of interest statement

Competing interests K.R.K. is an inventor on patents related to the inner ear organoid system and consults for STEMCELL Technologies on matters related to the technology. The other authors declare no competing interests.

Figures

Fig. 1.
Fig. 1.
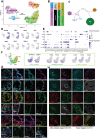
Otic vesicle development in human embryos. (A) Human fetal samples at CS11 (E1026), CS12 (E1027) and CS13 (E1037) immunolabelled to detect the developing otocysts (white box) with SOX2, TUBB3 and F-Actin (Phalloidin). (B) 3D reconstructions of embryos at CS11 (day 23-26), CS12 (day 26-30) and CS13 (day 28-32) adapted from the 3D Embryo Atlas (https://www.3dembryoatlas.com). (C) Higher magnification of the otocyst and the developing cochleo-vestibular ganglion (CVG) stained with SOX2 and TUBB3 antibodies and F-Actin (Phalloidin). Panels 3 and 4 show sections at different lateral-medial levels of the same sample (E1037). Asterisk indicates potential cutting artifact or tissue damage. fn, putative branch of the facial nerve; GP, glossopharyngeal ganglion. Scale bars: 1 mm (A); 100 µm (C).
Fig. 2.
Fig. 2.
Characterization of otic vesicle development in human embryos. (A-F) Human fetal samples at CS11 (E1026; A,D), CS12 (E1027; B,E) and CS13 (E1037; C,F) immunolabelled to detect the developing otocysts with SOX2, PAX2 and TUBB3 staining (left) or SOX10, PAX8 and TUBB3 staining (right). A tile scan of the head region (top; scale bars: 1 mm) and a detail of the otocyst (bottom; scale bars: 100 µm) are shown for each panel; all images are consecutive sections to those shown in Fig. 1. b in E and F indicates autofluorescence blood cells.
Fig. 3.
Fig. 3.
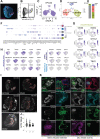
Placode induction in IEOs is dependent on BMP concentration. (A) iPSC aggregates derived from the PAX2-GFP iPSC line exposed to discrete BMP concentrations (0-10 ng/ml) from day 0 to day 3.5 of culture. Organoids fixed at day 8 and immunostained for the placodal marker SIX1 and co-stained with CDH1 (top panels) or phosphorylated SMAD1-5-9 (bottom panels). (B) iPSC aggregates derived from the SOX2-GFP iPSC line exposed to discrete BMP concentration (0-10 ng/ml) from day 0 to day 3.5 of culture. Organoids fixed at day 8 and immunostained for the placodal marker SIX1 and co-stained with CDH1 and SOX10 (top panels) or phosphorylated SMAD1-5-9 (bottom panels). Placodal ectoderm (PE) forms for concentrations of 1-2.5 ng/ml, with cell line-specific optimal levels. EPI, epidermis; NE/NC, neural epithelium/neural crest. Scale bars: 100 µm.
Fig. 4.
Fig. 4.
Comparison placodal tissue differentiated in IEO and CS11 samples. (A) UMAP plot of day 8 scRNA-seq data showing the identified cell clusters: placodal ectoderm (PE; green), surface ectoderm (SE; orange), neural crest (NC; violet), NC-mesenchyme (NC-MES; magenta), neural epithelium (NE; turquoise), neurons (Neu; blue). (B) Histogram plot showing the relative abundance of the different populations at day 8. AP, anterior placode; OEPD, otic-epibranchial placode. (C) Schematic of the potential differentiation dynamics. Size of the circles is proportional to the percentage of cells in the cluster, relative to total number of cells. (D) UMAP plots with selected marker genes defining the PE cluster. (E) Dot plot for selected markers for the main clusters. ant PE, anterior placode (PE0, PE1; PE13); post PE, posterior placode (PE5, PE7, PE9). (F) UMAP plots for the PE population only (manual selection). Six subclusters are identified by unsupervised clustering: PE0, PE1, PE9, PE7, PE5, PE13. ‘Pan’ placodal, anterior or posterior placode markers are shown. (G) Organoid characterization at day 8. Immunofluorescent staining characterization on consecutive sections was used to verify the expression/absence of the following markers: CDH1, CDH2, SIX1, TFAP2A (AP2), PAX8, PAX2, SOX2, PAX6, SOX10, PAX3. Boxed areas are imaged at higher magnification and shown as merged and single channels. (H) Images of the OV (left) and head/developing brain (right) in CS11 embryos (E1026) immunostained for PAX8, SIX1, CDH1, TFAP2A, SOX2 and PAX6. Different lateral to medial sections are shown from the same embryo. OV and head regions are from the same section and imaged with the same parameters to compare signal intensity. Scale bars: 100 µm.
Fig. 5.
Fig. 5.
Comparison of otic tissue differentiated in IEO and CS13 samples. (A) EPCAM (magenta) and F-Actin (cyan) staining on an organoid section at day 30 of in vitro differentiation. (B) Flow cytometry analysis of cells dissociated at day 26 of differentiation and stained for EPCAM-PeCy7. EPCAM+ cells (9.2% of the total) were sorted and processed for scRNA-seq. (C) UMAP plot of day 26 IEO scRNA-seq showing expression of EPCAM in all cells analyzed. (D) UMAP plot of day 26 IEO scRNA-seq with cluster labeling. (E) Percentage of the different cell populations identified by scRNA-seq. (F) Dot plot of the selected populations: mesenchyme (MES; magenta), neural epithelium (NE; turquoise), epidermis/keratinocytes (EP/K; gray), otic neuroblasts (ONB; blue) and otic epithelium (OE; green). (G) UMAP plots of selected genes expressed in the OE cluster. (H) UMAP plots of selected genes labeling the otic neuroblasts cluster (manual selection). (I) Characterization of otic vesicles in SOX2-GFP iPSC line at day 32 of differentiation. The otic markers EPCAM, PAX8, SOX10, SOX9 and SOX2 are shown. Vesicle areas are highlighted with a red contour. (J) Quantification of the organoid area positive for each marker (n=3-4 sections of three organoids per experiment; three independent experiments). No significant differences between the group means (one way ANOVA with multiple comparison). (K) Otic vesicles at day 30-42 of differentiation in vitro (hIEOd30, hIEOd42) in comparison with CS13 embryo. CVG, cochleo-vestibular ganglion. Asterisks indicate potential cutting artifact or tissue damage. Scale bars: 100 µm.
Fig. 6.
Fig. 6.
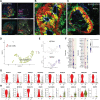
Characterization of sensory epithelia in IEOs at days 55 and 60. (A) Characterization of IEO at day 55 of differentiation (PAX2-GFP iPSC line). Different sections of the same organoids are shown. Otic marker-positive areas are contoured with white-dashed line. (B,C) Sensory vesicle derived from the PAX2-GFP iPSC line (day 55; IEOd55) and LMNB1-RFP iPSC line (day 60; IEOd60) (C). Staining for MYO7A, SOX2, TUBB3 and F-Actin are shown. MES/G, mesenchyme/glia; NSE, non-sensory epithelium; SE, sensory epithelium. (D) UMAP plot of the selected OEP (green) and HC (red) clusters. (E) UMAP plots of the selected cells showing ATOH1 and SOX2 expression. (F) Dot plot with relative expression of known marker genes in the selected OEP and HC cluster. (G,H) Violin plots showing expression levels of selected genes in HC and OEP. Scale bars: 100 µm (A); 10 µm (B,C).
Fig. 7.
Fig. 7.
Comparison of organoid marker expression and human fetal cochlea, utricle and saccule. (A) Representative images of IEO-derived sensory vesicles from two different cell lines (SOX2-GFP iPSC and LMNB1-RFP iPSC) at day 60 of differentiation. (B) Cochlea sections at week 12 of development (sample E1291). (C) Utricle sections at week 10 of development (sample EF1). (D) Saccule sections at week 10 of development (sample EF1). HC, hair cells; KO, Kölliker's organ; MES/G, mesenchyme/glia; SC, supporting cells; SE, sensory epithelium. Single channels of the images are shown in Fig. S9, including extended figure legend. Red asterisks (C,D) indicate cross-reactivity of the goat anti mouse IgG1 antibody with hair bundles (used for POU4F3 and SOX10 staining). This has been detected only on paraffin-embedded sections. White asterisks (A,C,D) show SOX10+ glia cells. White arrows (A,B) indicate espin-positive immature hair bundles. Blue arrows (A,B) indicate NGFR+ otic epithelia. Dashed white lines indicate sensory epithelia (SE). (E) Violin plots showing expression levels in HC and OEP for selected genes. Scale bars: 100 µm.

Update of

References

    1. Adameyko, I., Lallemend, F., Furlan, A., Zinin, N., Aranda, S., Kitambi, S. S., Blanchart, A., Favaro, R., Nicolis, S., Lubke, M.et al. (2012). Sox2 and Mitf cross-regulatory interactions consolidate progenitor and melanocyte lineages in the cranial neural crest. Development 139, 397-410. 10.1242/dev.065581 - DOI - PMC - PubMed
    1. Alsina, B. and Whitfield, T. T. (2017). Sculpting the labyrinth: morphogenesis of the developing inner ear. Semin. Cell Dev. Biol. 65, 47-59. 10.1016/j.semcdb.2016.09.015 - DOI - PubMed
    1. Appler, J. M. and Goodrich, L. V. (2011). Connecting the ear to the brain: molecular mechanisms of auditory circuit assembly. Prog. Neurobiol. 93, 488-508. 10.1016/j.pneurobio.2011.01.004 - DOI - PMC - PubMed
    1. Baker, C. V., Stark, M. R., Marcelle, C. and Bronner-Fraser, M. (1999). Competence, specification and induction of Pax-3 in the trigeminal placode. Development 126, 147-156. 10.1242/dev.126.1.147 - DOI - PubMed
    1. Bok, J., Dolson, D. K., Hill, P., Ruther, U., Epstein, D. J. and Wu, D. K. (2007). Opposing gradients of Gli repressor and activators mediate Shh signaling along the dorsoventral axis of the inner ear. Development 134, 1713-1722. 10.1242/dev.000760 - DOI - PubMed

Publication types