. 2023 Nov 15;83(22):3681-3692.
doi: 10.1158/0008-5472.CAN-23-0398.

Stroma-Mediated Breast Cancer Cell Proliferation Indirectly Drives Chemoresistance by Accelerating Tumor Recovery between Chemotherapy Cycles

Affiliations

Stroma-Mediated Breast Cancer Cell Proliferation Indirectly Drives Chemoresistance by Accelerating Tumor Recovery between Chemotherapy Cycles

Daria Miroshnychenko et al. Cancer Res. .

Abstract

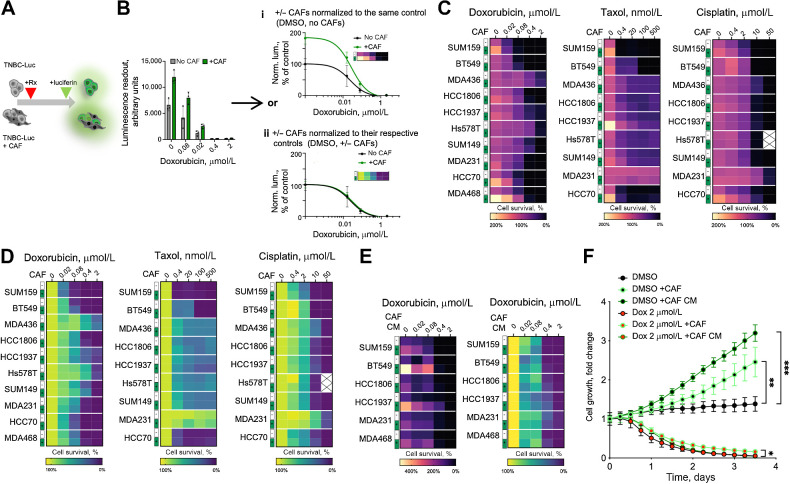
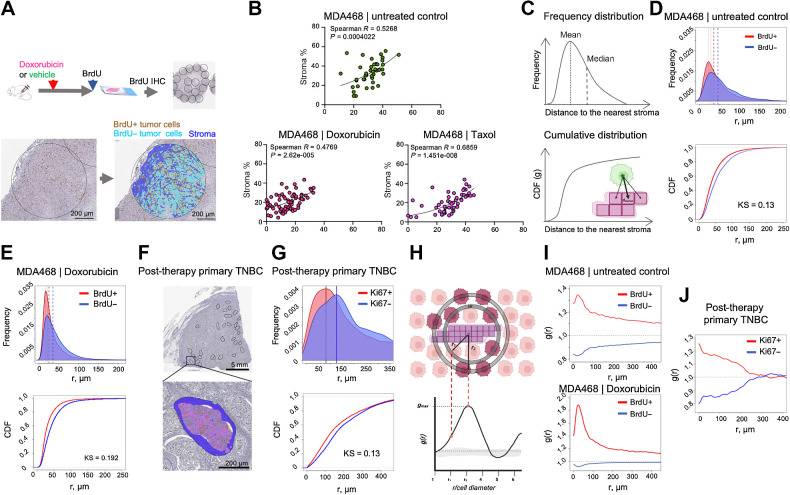
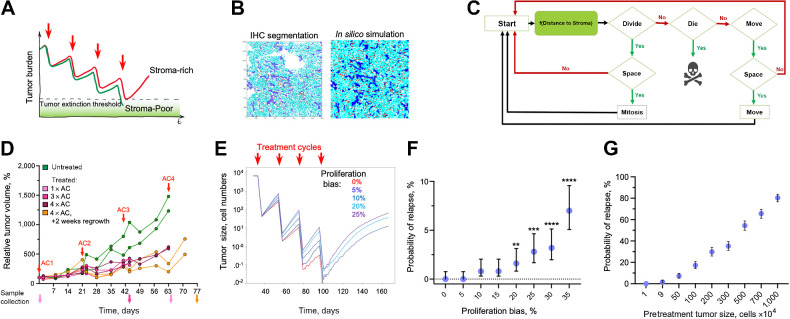
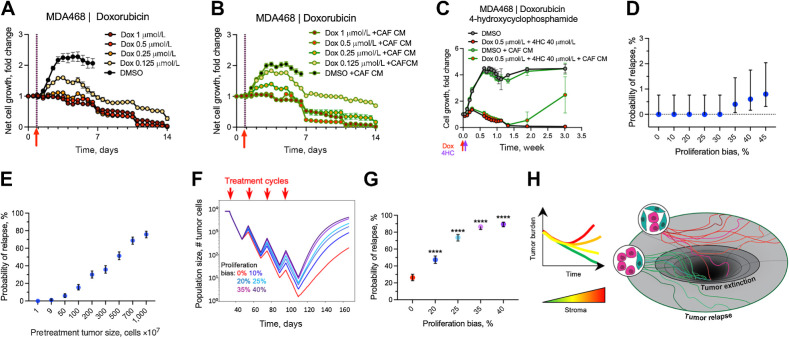
The ability of tumors to survive therapy reflects both cell-intrinsic and microenvironmental mechanisms. Across many cancers, including triple-negative breast cancer (TNBC), a high stroma/tumor ratio correlates with poor survival. In many contexts, this correlation can be explained by the direct reduction of therapy sensitivity induced by stroma-produced paracrine factors. We sought to explore whether this direct effect contributes to the link between stroma and poor responses to chemotherapies. In vitro studies with panels of TNBC cell line models and stromal isolates failed to detect a direct modulation of chemoresistance. At the same time, consistent with prior studies, fibroblast-produced secreted factors stimulated treatment-independent enhancement of tumor cell proliferation. Spatial analyses indicated that proximity to stroma is often associated with enhanced tumor cell proliferation in vivo. These observations suggested an indirect link between stroma and chemoresistance, where stroma-augmented proliferation potentiates the recovery of residual tumors between chemotherapy cycles. To evaluate this hypothesis, a spatial agent-based model of stroma impact on proliferation/death dynamics was developed that was quantitatively parameterized using inferences from histologic analyses and experimental studies. The model demonstrated that the observed enhancement of tumor cell proliferation within stroma-proximal niches could enable tumors to avoid elimination over multiple chemotherapy cycles. Therefore, this study supports the existence of an indirect mechanism of environment-mediated chemoresistance that might contribute to the negative correlation between stromal content and poor therapy outcomes.

Significance: Integration of experimental research with mathematical modeling reveals an indirect microenvironmental chemoresistance mechanism by which stromal cells stimulate breast cancer cell proliferation and highlights the importance of consideration of proliferation/death dynamics. See related commentary by Wall and Echeverria, p. 3667.


Figures

Figure 1. CAFs facilitate TNBC proliferation in vitro. A, Experiment diagram for the chemosensitivity sensitivity assay. Luciferase-labeled TNBC cells were cultured in the presence or absence of unlabeled CAFs in the presence of doxorubicin or DMSO vehicle control. Only TNBC cells directly contribute to the viability signal. B, Normalization schemata for the data analyses. Raw data from the viability assay can be normalized to either the DMSO control signal of cells cultured without CAFs (i), or with separate normalization of the control and CAF cocultures to their respective DMSO controls (ii). C and D, Heat map summaries of the impact of CAF cocultures on the sensitivity of the indicated chemotherapeutic agent in a panel of TNBC cell lines, normalized as i or ii in B, respectively. E, Heat map summaries of the impact of CAF CM on doxorubicin sensitivities of the indicated TNBC cell lines. F, Impact of CAFs and CAF CM on the growth of GFP-labeled MDA468 cells following 24 hours of doxorubicin exposure, measured by time-lapse microscopy. Statistical analyses of indicated differences were performed with a paired two-tailed t test, comparing confluency value at each of the time point. * P = 0.0102; **, P = 0.003; ***, P = 0.0007.
Figure 1.
CAFs facilitate TNBC proliferation in vitro. A, Experiment diagram for the chemosensitivity sensitivity assay. Luciferase-labeled TNBC cells were cultured in the presence or absence of unlabeled CAFs in the presence of doxorubicin or DMSO vehicle control. Only TNBC cells directly contribute to the viability signal. B, Normalization schemata for the data analyses. Raw data from the viability assay can be normalized to either the DMSO control signal of cells cultured without CAFs (i), or with separate normalization of the control and CAF cocultures to their respective DMSO controls (ii). C and D, Heat map summaries of the impact of CAF cocultures on the sensitivity of the indicated chemotherapeutic agent in a panel of TNBC cell lines, normalized as i or ii in B, respectively. E, Heat map summaries of the impact of CAF CM on doxorubicin sensitivities of the indicated TNBC cell lines. F, Impact of CAFs and CAF CM on the growth of GFP-labeled MDA468 cells following 24 hours of doxorubicin exposure, measured by time-lapse microscopy. Statistical analyses of indicated differences were performed with a paired two-tailed t test, comparing confluency value at each of the time point. * P = 0.0102; **, P = 0.003; ***, P = 0.0007.
Figure 2. Proximity to stroma correlates with higher proliferation in vivo. A, Diagram of the experimental approach to assess the impact of stroma proximity on the proliferation of TNBC cells in vivo. Before euthanasia, the mice were pulsed with BrdU, which enabled IHC-based detection of cells in the S-phase of the cell cycle. Tumor tissue in whole slide scans of BrdU IHC staining was subsampled into smaller areas (0.9 mm in diameter); necrosis-free tumor tissue within these subsampled regions was segmented into BrdU± tumor cells and stroma. B, Regression analyses of MDA468 xenograft tumors, treated with doxorubicin (2.5 mg/kg), Taxol (10 mg/kg), or vehicle control 48 hours before euthanasia were used to assess the correlation between stromal content and tumor cell proliferation. Each dot represents a subsampled ROI, as in A. Spearman R and P values of nonlinear fit are shown. C, Schemata for the nearest neighbor analyses that calculate distances between each of BrdU± cells in the tumor cross-section and the nearest stromal pixel. D and E, Frequency distribution and cumulative distribution function (CDF) plots of distances to the nearest stroma of BrdU± cells in MDA468 xenografts tumors from control (D) and doxorubicin-treated (E) mice. Dashed lines indicate medians and means of the distributions KS denote the Kolmogorov-Smirnov statistical test. F, A representative image of a diagnostic biopsy of a post-treatment primary human TNBC tumor, stained with proliferation marker Ki67, ROIs used for subsampling, and an example segmentation of an ROI into Ki67± cells and stroma. G, Frequency distribution and CDF plots of distances of Ki67± cells to the nearest stroma in the primary TNBC sample. H Schemata for the RDF analysis. I, RDF analyses of the impact of stroma proximity on the distribution of BrdU± cells in control and doxorubicin-treated MDA468 tumors. J, RDF analyses of the impact of stroma proximity on the distribution of Ki67± cells in a post-treatment primary TNBC tumor. (A, C, and H, Created with BioRender.com.)
Figure 2.
Proximity to stroma correlates with higher proliferation in vivo. A, Diagram of the experimental approach to assess the impact of stroma proximity on the proliferation of TNBC cells in vivo. Before euthanasia, the mice were pulsed with BrdU, which enabled IHC-based detection of cells in the S-phase of the cell cycle. Tumor tissue in whole slide scans of BrdU IHC staining was subsampled into smaller areas (0.9 mm in diameter); necrosis-free tumor tissue within these subsampled regions was segmented into BrdU± tumor cells and stroma. B, Regression analyses of MDA468 xenograft tumors, treated with doxorubicin (2.5 mg/kg), Taxol (10 mg/kg), or vehicle control 48 hours before euthanasia were used to assess the correlation between stromal content and tumor cell proliferation. Each dot represents a subsampled ROI, as in A. Spearman R and P values of nonlinear fit are shown. C, Schemata for the nearest neighbor analyses that calculate distances between each of BrdU± cells in the tumor cross-section and the nearest stromal pixel. D and E, Frequency distribution and cumulative distribution function (CDF) plots of distances to the nearest stroma of BrdU± cells in MDA468 xenografts tumors from control (D) and doxorubicin-treated (E) mice. Dashed lines indicate medians and means of the distributions KS denote the Kolmogorov-Smirnov statistical test. F, A representative image of a diagnostic biopsy of a post-treatment primary human TNBC tumor, stained with proliferation marker Ki67, ROIs used for subsampling, and an example segmentation of an ROI into Ki67± cells and stroma. G, Frequency distribution and CDF plots of distances of Ki67± cells to the nearest stroma in the primary TNBC sample. H Schemata for the RDF analysis. I, RDF analyses of the impact of stroma proximity on the distribution of BrdU± cells in control and doxorubicin-treated MDA468 tumors. J, RDF analyses of the impact of stroma proximity on the distribution of Ki67± cells in a post-treatment primary TNBC tumor. (A, C, and H, Created with BioRender.com.)
Figure 3. In silico validation of the hypothesized indirect stroma-mediated chemoresistance. A, Model schemata depicting the hypothesized indirect stroma-mediated chemoresistance. Enhanced proliferation in stroma-rich tumors can enhance between-chemo cycles recovery of tumors, enabling them to escape therapeutic eradication. B, ABM is initiated on the basis of the spatial localization of tumor cells and stroma observed in the indicated experimental sample. C, Diagram of the ABM model. D, Dynamics of volume changes in MDA468 xenograft tumors over the course of AC treatment (0.5 mg/kg doxorubicin and 50 mg/kg cyclophosphamide). Red arrows, injection times. Traces indicate individual tumors; distinct colors of volume traces indicate tumors harvested at different time points (arrows of matching colors). E, Impact of the indicated magnitude of enhancement of cell proliferation within three cell diameters from stroma border on the average population size over the course of chemotherapy. Traces depict average population sizes over 500 simulations per condition. F, Impact of the indicated magnitude of enhancement of cell proliferation on the probability of tumor relapse through the course of therapy, over 500 simulations with 95% confidence interval. **, P = 0.0076; ***, P < 0.001; ****, P < 0.001 of Fisher exact test, comparing the probability of relapse with indicated proliferation bias against the simulations without stromal effect (proliferation bias 0%). G, Dependence on the sampling grid size of the tumor relapse for the simulations under short-term cytotoxic effects of the chemotherapy under 5% bias in proliferation due to stromal effects. For each data point, 500 random samplings of groups of 1,9,50, 100, 200, 300, 500 700, and 1,000 simulations have been randomly selected from 10,000 simulations of 100 × 100 grids. Error bars, 95% confidence intervals.
Figure 3.
In silico validation of the hypothesized indirect stroma-mediated chemoresistance. A, Model schemata depicting the hypothesized indirect stroma-mediated chemoresistance. Enhanced proliferation in stroma-rich tumors can enhance between-chemo cycles recovery of tumors, enabling them to escape therapeutic eradication. B, ABM is initiated on the basis of the spatial localization of tumor cells and stroma observed in the indicated experimental sample. C, Diagram of the ABM model. D, Dynamics of volume changes in MDA468 xenograft tumors over the course of AC treatment (0.5 mg/kg doxorubicin and 50 mg/kg cyclophosphamide). Red arrows, injection times. Traces indicate individual tumors; distinct colors of volume traces indicate tumors harvested at different time points (arrows of matching colors). E, Impact of the indicated magnitude of enhancement of cell proliferation within three cell diameters from stroma border on the average population size over the course of chemotherapy. Traces depict average population sizes over 500 simulations per condition. F, Impact of the indicated magnitude of enhancement of cell proliferation on the probability of tumor relapse through the course of therapy, over 500 simulations with 95% confidence interval. **, P = 0.0076; ***, P < 0.001; ****, P < 0.001 of Fisher exact test, comparing the probability of relapse with indicated proliferation bias against the simulations without stromal effect (proliferation bias 0%). G, Dependence on the sampling grid size of the tumor relapse for the simulations under short-term cytotoxic effects of the chemotherapy under 5% bias in proliferation due to stromal effects. For each data point, 500 random samplings of groups of 1,9,50, 100, 200, 300, 500 700, and 1,000 simulations have been randomly selected from 10,000 simulations of 100 × 100 grids. Error bars, 95% confidence intervals.
Figure 4. Impact of the stroma-enhanced proliferation on tumor chemotherapy recovery. A and B, Changes in numbers of viable MDA468 cells following brief (2 hours) administration of doxorubicin in control medium (A) and with CAF CM (B). C, Impact of CAF CM on the response of MDA468 to the sequential administration of doxorubicin and 4-hydroxy cyclophosphamide (1 hour each). D, Probability of relapse for the simulations under long-term cytotoxic effects of the chemotherapy, with the killing fraction of 21% of the cells per time step. Each data point in the graph represents the average of 500 simulations. Error bars, 95% confidence interval. E, Dependence of the relapse probability on the initial population size under the scenario of 20% bias in tumor cells proximal to the stroma. Each data point is the average of the 500 samplings and the respective 95% confidence interval. F, Impact of the indicated magnitude of enhancement of cell proliferation within three cell diameters from stroma border on the average population size over the course of chemotherapy that, in the absence of stromal effects, eliminates tumors with 27% relapse probability. Traces depict average population size over 500 simulations per condition. G, Probability of tumor relapse affected by different proliferation bias and prolongated cytotoxic effect. Graphs depict the outcomes of 500 simulations with 95% confidence interval. ****, P < 0.001 of Fisher exact test, comparing outcomes with different values of stromal enhancement values with simulations without stromal effect (proliferation bias 0%). H, Conceptual model of the indirect stromal chemoresistance. The link between high stromal content and chemoresistance might be at least partially mediated by the stroma-dependent potentiation of tumor cell proliferation, which enhances tumor recovery between chemotherapy cycles and decreases the odds of chemotherapeutic extinction.
Figure 4.
Impact of the stroma-enhanced proliferation on tumor chemotherapy recovery. A and B, Changes in numbers of viable MDA468 cells following brief (2 hours) administration of doxorubicin in control medium (A) and with CAF CM (B). C, Impact of CAF CM on the response of MDA468 to the sequential administration of doxorubicin and 4-hydroxy cyclophosphamide (1 hour each). D, Probability of relapse for the simulations under long-term cytotoxic effects of the chemotherapy, with the killing fraction of 21% of the cells per time step. Each data point in the graph represents the average of 500 simulations. Error bars, 95% confidence interval. E, Dependence of the relapse probability on the initial population size under the scenario of 20% bias in tumor cells proximal to the stroma. Each data point is the average of the 500 samplings and the respective 95% confidence interval. F, Impact of the indicated magnitude of enhancement of cell proliferation within three cell diameters from stroma border on the average population size over the course of chemotherapy that, in the absence of stromal effects, eliminates tumors with 27% relapse probability. Traces depict average population size over 500 simulations per condition. G, Probability of tumor relapse affected by different proliferation bias and prolongated cytotoxic effect. Graphs depict the outcomes of 500 simulations with 95% confidence interval. ****, P < 0.001 of Fisher exact test, comparing outcomes with different values of stromal enhancement values with simulations without stromal effect (proliferation bias 0%). H, Conceptual model of the indirect stromal chemoresistance. The link between high stromal content and chemoresistance might be at least partially mediated by the stroma-dependent potentiation of tumor cell proliferation, which enhances tumor recovery between chemotherapy cycles and decreases the odds of chemotherapeutic extinction.

Comment in

Similar articles

Cited by

References

    1. Ge W, Yue M, Wang Y, Wang Y, Xue S, Shentu D, et al. A novel molecular signature of cancer-associated fibroblasts predicts prognosis and immunotherapy response in pancreatic cancer. Int J Mol Sci 2022;24:156. - PMC - PubMed
    1. Xu J, Fang Y, Chen K, Li S, Tang S, Ren Y, et al. Single-cell RNA sequencing reveals the tissue architecture in human high-grade serous ovarian cancer. Clin Cancer Res 2022;28:3590–602. - PMC - PubMed
    1. Irvine AF, Waise S, Green EW, Stuart B, Thomas GJ. Characterising cancer-associated fibroblast heterogeneity in non–small cell lung cancer: a systematic review and meta-analysis. Sci Rep 2021;11:1. - PMC - PubMed
    1. Jamieson NB, Carter CR, McKay CJ, Oien KA. Tissue biomarkers for prognosis in pancreatic ductal adenocarcinoma: a systematic review and meta-analysis. Clin Cancer Res 2011;17:3316–31. - PubMed
    1. Graizel D, Zlotogorski-Hurvitz A, Tsesis I, Rosen E, Kedem R, Vered M. Oral cancer-associated fibroblasts predict poor survival: systematic review and meta-analysis. Oral Dis 2020;26:733–44. - PubMed

Publication types