

Maximal Number of Repetitions at Percentages of the One Repetition Maximum: A Meta-Regression and Moderator Analysis of Sex, Age, Training Status, and Exercise
- PMID: 37792272
- PMCID: PMC10933212
- DOI: 10.1007/s40279-023-01937-7
Maximal Number of Repetitions at Percentages of the One Repetition Maximum: A Meta-Regression and Moderator Analysis of Sex, Age, Training Status, and Exercise
Abstract
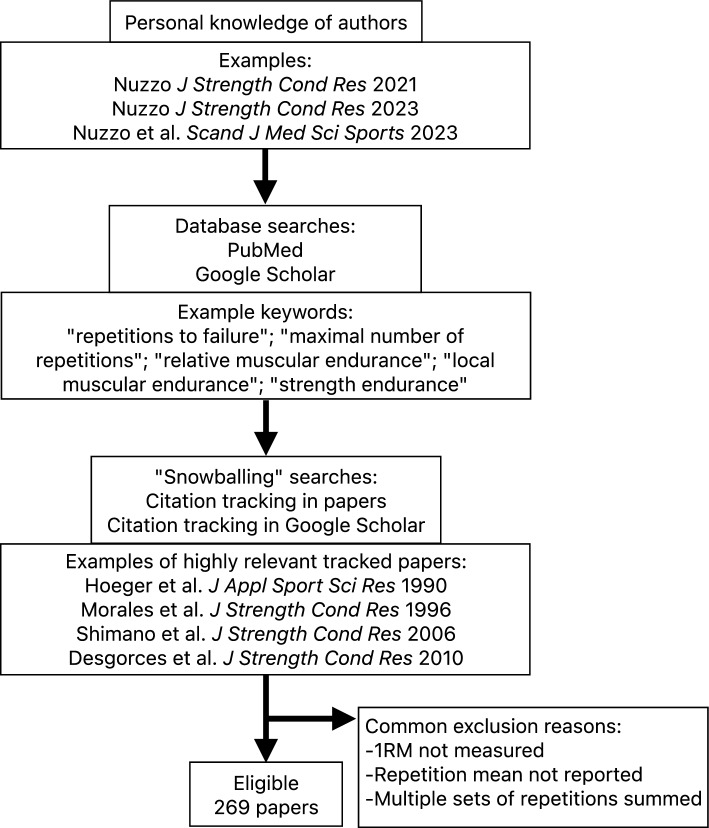
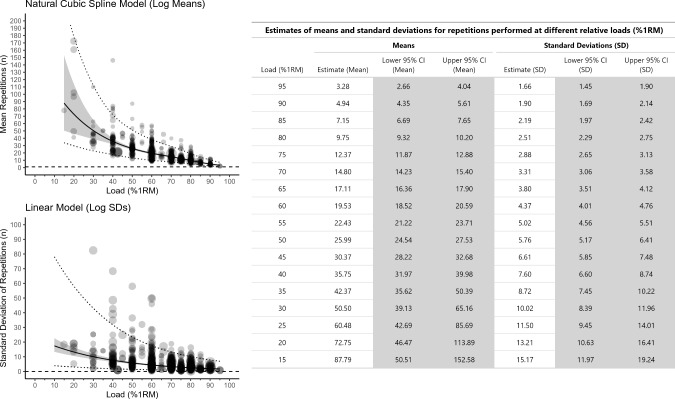
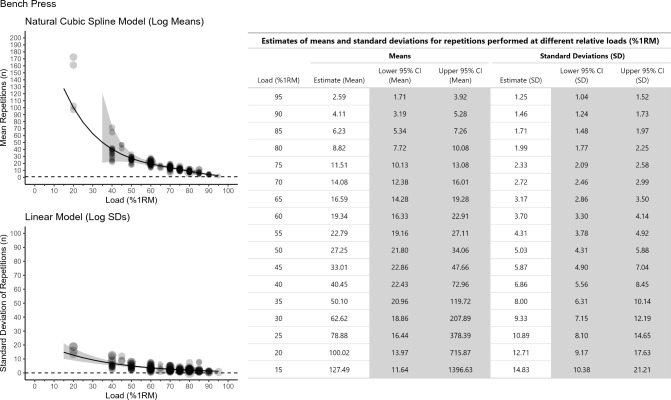
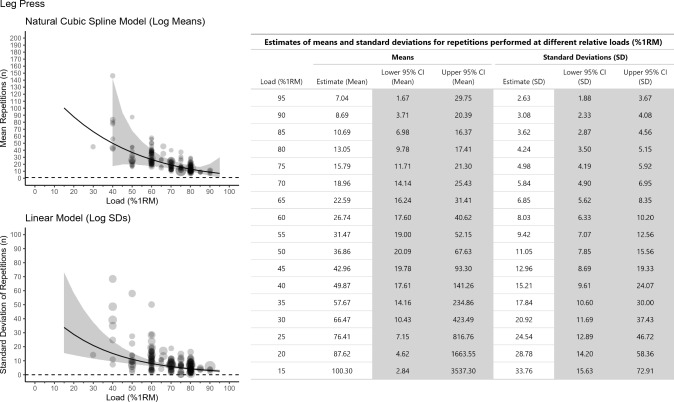
The maximal number of repetitions that can be completed at various percentages of the one repetition maximum (1RM) [REPS ~ %1RM relationship] is foundational knowledge in resistance exercise programming. The current REPS ~ %1RM relationship is based on few studies and has not incorporated uncertainty into estimations or accounted for between-individuals variation. Therefore, we conducted a meta-regression to estimate the mean and between-individuals standard deviation of the number of repetitions that can be completed at various percentages of 1RM. We also explored if the REPS ~ %1RM relationship is moderated by sex, age, training status, and/or exercise. A total of 952 repetitions-to-failure tests, completed by 7289 individuals in 452 groups from 269 studies, were identified. Study groups were predominantly male (66%), healthy (97%), < 59 years of age (92%), and resistance trained (60%). The bench press (42%) and leg press (14%) were the most commonly studied exercises. The REPS ~ %1RM relationship for mean repetitions and standard deviation of repetitions were best described using natural cubic splines and a linear model, respectively, with mean and standard deviation for repetitions decreasing with increasing %1RM. More repetitions were evident in the leg press than bench press across the loading spectrum, thus separate REPS ~ %1RM tables were developed for these two exercises. Analysis of moderators suggested little influences of sex, age, or training status on the REPS ~ %1RM relationship, thus the general main model REPS ~ %1RM table can be applied to all individuals and to all exercises other than the bench press and leg press. More data are needed to develop REPS ~ %1RM tables for other exercises.
© 2023. The Author(s).
Conflict of interest statement
James L. Nuzzo and Matheus D. Pinto were previously employed at Vitruvian, a company that designs and sells resistance exercise equipment. Kazunori Nosaka and James Steele have no conflicts of interest that are directly relevant to the content of this article.
Figures
References
-
- Berger RA, Harris MW. Effects of various repetitive rates in weight training on improvements in strength and endurance. J Assoc Phys Ment Rehabil. 1966;20(6):205–207. - PubMed
-
- Clarke DH, Irving RN. Objective determination of resistance load for ten repetitions maximum for knee flexion exercise. Res Q. 1960;31(2):131–135.
-
- Clarke DH, Herman EL. Objective determination of resistance load for ten repetitions maximum for quadriceps development. Res Q. 1955;26(4):385–390.
-
- Hansen JW. The training effect of repeated isometric muscle contractions. Int Z Angew Physiol. 1961;18:474–477. - PubMed
-
- Hoeger WWK, Barette SL, Hale DF, Hopkins DR. Relationship between repetitions and selected percentages of one repetition maximum. J Appl Sport Sci Res. 1987;2(1):11–13.
Publication types
MeSH terms
LinkOut - more resources
Full Text Sources
