Reconstructing the somatotopic organization of the corticospinal tract remains a challenge for modern tractography methods
- PMID: 37792280
- PMCID: PMC10619402
- DOI: 10.1002/hbm.26497
Reconstructing the somatotopic organization of the corticospinal tract remains a challenge for modern tractography methods
Abstract
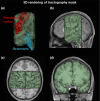
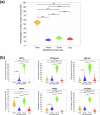
The corticospinal tract (CST) is a critically important white matter fiber tract in the human brain that enables control of voluntary movements of the body. The CST exhibits a somatotopic organization, which means that the motor neurons that control specific body parts are arranged in order within the CST. Diffusion magnetic resonance imaging (MRI) tractography is increasingly used to study the anatomy of the CST. However, despite many advances in tractography algorithms over the past decade, modern, state-of-the-art methods still face challenges. In this study, we compare the performance of six widely used tractography methods for reconstructing the CST and its somatotopic organization. These methods include constrained spherical deconvolution (CSD) based probabilistic (iFOD1) and deterministic (SD-Stream) methods, unscented Kalman filter (UKF) tractography methods including multi-fiber (UKF2T) and single-fiber (UKF1T) models, the generalized q-sampling imaging (GQI) based deterministic tractography method, and the TractSeg method. We investigate CST somatotopy by dividing the CST into four subdivisions per hemisphere that originate in the leg, trunk, hand, and face areas of the primary motor cortex. A quantitative and visual comparison is performed using diffusion MRI data (N = 100 subjects) from the Human Connectome Project. Quantitative evaluations include the reconstruction rate of the eight anatomical subdivisions, the percentage of streamlines in each subdivision, and the coverage of the white matter-gray matter (WM-GM) interface. CST somatotopy is further evaluated by comparing the percentage of streamlines in each subdivision to the cortical volumes for the leg, trunk, hand, and face areas. Overall, UKF2T has the highest reconstruction rate and cortical coverage. It is the only method with a significant positive correlation between the percentage of streamlines in each subdivision and the volume of the corresponding motor cortex. However, our experimental results show that all compared tractography methods are biased toward generating many trunk streamlines (ranging from 35.10% to 71.66% of total streamlines across methods). Furthermore, the coverage of the WM-GM interface in the largest motor area (face) is generally low (under 40%) for all compared tractography methods. Different tractography methods give conflicting results regarding the percentage of streamlines in each subdivision and the volume of the corresponding motor cortex, indicating that there is generally no clear relationship, and that reconstruction of CST somatotopy is still a large challenge. Overall, we conclude that while current tractography methods have made progress toward the well-known challenge of improving the reconstruction of the lateral projections of the CST, the overall problem of performing a comprehensive CST reconstruction, including clinically important projections in the lateral (hand and face areas) and medial portions (leg area), remains an important challenge for diffusion MRI tractography.
Keywords: corticospinal tract; diffusion magnetic resonance imaging; motor cortex; somatotopic organization; tractography.
© 2023 The Authors. Human Brain Mapping published by Wiley Periodicals LLC.
Conflict of interest statement
The authors declare no conflicts of interest.
Figures


References
-
- Akter, M. , Hirai, T. , Sasao, A. , Nishimura, S. , Uetani, H. , Iwashita, K. , & Yamashita, Y. (2011). Multi‐tensor tractography of the motor pathway at 3T: A volunteer study. Magnetic Resonance in Medical Sciences, 10(1), 59–63. - PubMed
-
- Alexander, D. C. , & Barker, G. J. (2005). Optimal imaging parameters for fiber‐orientation estimation in diffusion MRI. NeuroImage, 27(2), 357–367. - PubMed
-
- Alexander, D. C. , Dyrby, T. B. , Nilsson, M. , & Zhang, H. (2019). Imaging brain microstructure with diffusion MRI: Practicality and applications. NMR in Biomedicine, 32(4), e3841. - PubMed
-
- Alexander, D. C. , & Seunarine, K. K. (2010). Mathematics of crossing fibers. In Diffusion MRI: theory, methods, and application. Oxford Academic.
-
- Assemlal, H.‐E. , Campbell, J. , Pike, B. , & Siddiqi, K. (2011). Apparent intravoxel fibre population dispersion (FPD) using spherical harmonics. Medical image computing and computer‐assisted intervention: MICCAI 2011—International conference on medical image computing and computer‐assisted intervention (Vol. 14, pp. 157–165). MICCAI. - PubMed
Publication types
MeSH terms
Grants and funding
- K24 MH116366/MH/NIMH NIH HHS/United States
- P41EB028741/NH/NIH HHS/United States
- R01NS125781/NH/NIH HHS/United States
- K24MH116366/NH/NIH HHS/United States
- HHSN261201500003C/CA/NCI NIH HHS/United States
- R01 MH112748/MH/NIMH NIH HHS/United States
- R01MH119222/NH/NIH HHS/United States
- R01 MH119222/MH/NIMH NIH HHS/United States
- R21 DA042271/DA/NIDA NIH HHS/United States
- R01 NS125307/NS/NINDS NIH HHS/United States
- R01NS125307/NH/NIH HHS/United States
- P41 EB015902/EB/NIBIB NIH HHS/United States
- P41EB015902/NH/NIH HHS/United States
- R01MH125860/NH/NIH HHS/United States
- R01MH111917/NH/NIH HHS/United States
- R21DA042271/NH/NIH HHS/United States
- R01CA235589/NH/NIH HHS/United States
- R01MH112748/NH/NIH HHS/United States
- R01AG042512/NH/NIH HHS/United States
- HHSN261201500003I/CA/NCI NIH HHS/United States
- R01 MH125860/MH/NIMH NIH HHS/United States
- R01 CA235589/CA/NCI NIH HHS/United States
- R01 NS125781/NS/NINDS NIH HHS/United States
- R01 AG042512/AG/NIA NIH HHS/United States
- R01 MH111917/MH/NIMH NIH HHS/United States
- P41 EB028741/EB/NIBIB NIH HHS/United States
LinkOut - more resources
Full Text Sources
Medical
Miscellaneous

