. 2023 Oct 3;64(13):6.
doi: 10.1167/iovs.64.13.6.

CRB1-Associated Retinal Dystrophy Patients Have Expanded Lewis Glycoantigen-Positive T Cells

Affiliations

CRB1-Associated Retinal Dystrophy Patients Have Expanded Lewis Glycoantigen-Positive T Cells

Lude Moekotte et al. Invest Ophthalmol Vis Sci. .

Abstract

Purpose: Eye inflammation may occur in patients with inherited retinal dystrophies (IRDs) and is seen frequently in IRDs associated with mutations in the CRB1 gene. The purpose of this study was to determine the types of inflammatory cells involved in IRDs, by deep profiling the composition of peripheral blood mononuclear cells of patients with a CRB1-associated IRD.

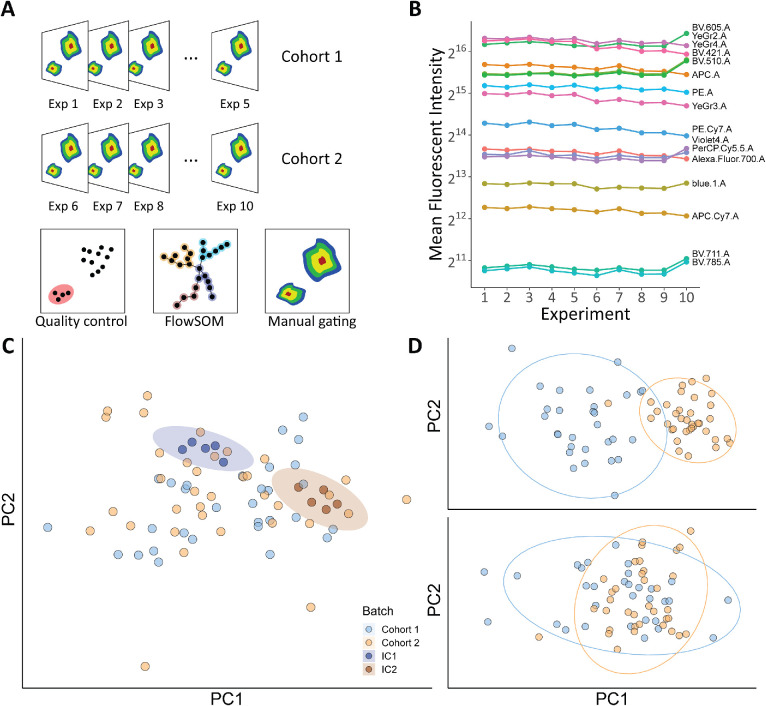
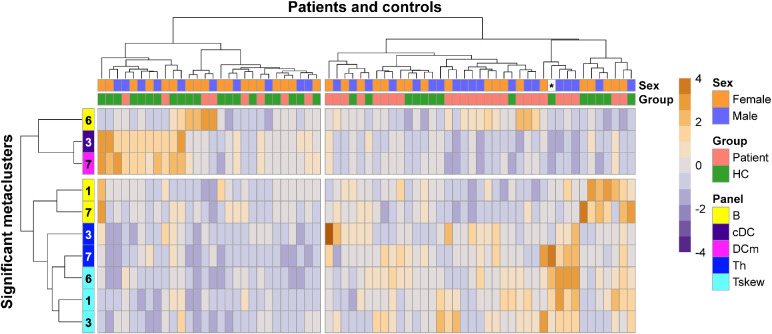
Methods: This study included 33 patients with an IRD with confirmed CRB1 mutations and 32 healthy controls. A 43-parameter flow cytometry analysis was performed on peripheral blood mononuclear cells isolated from venous blood. FlowSOM and manual Boolean combination gating were used to identify and quantify immune cell subsets.

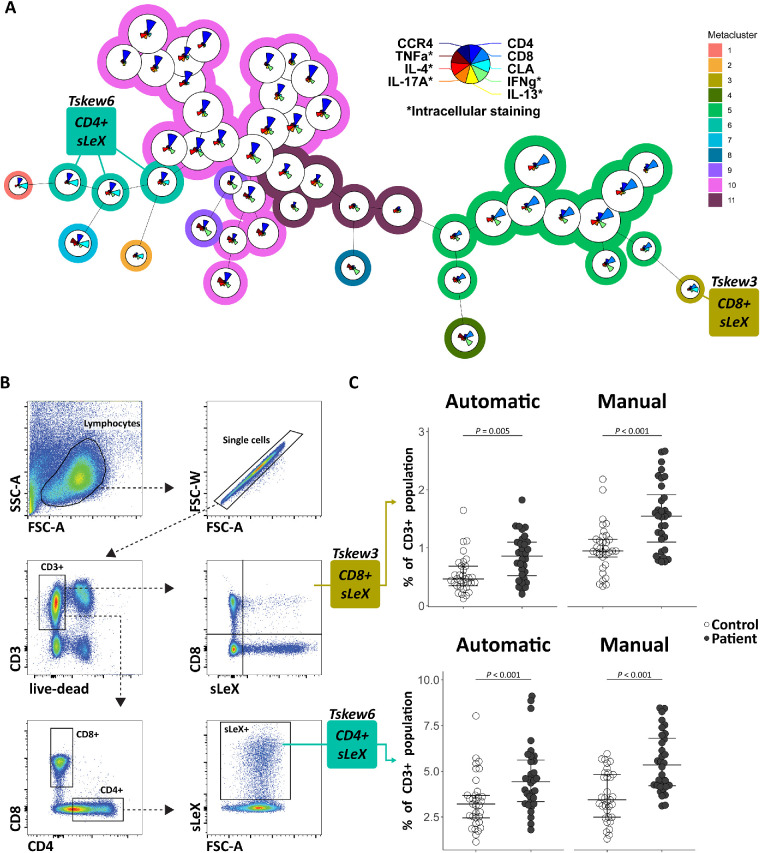
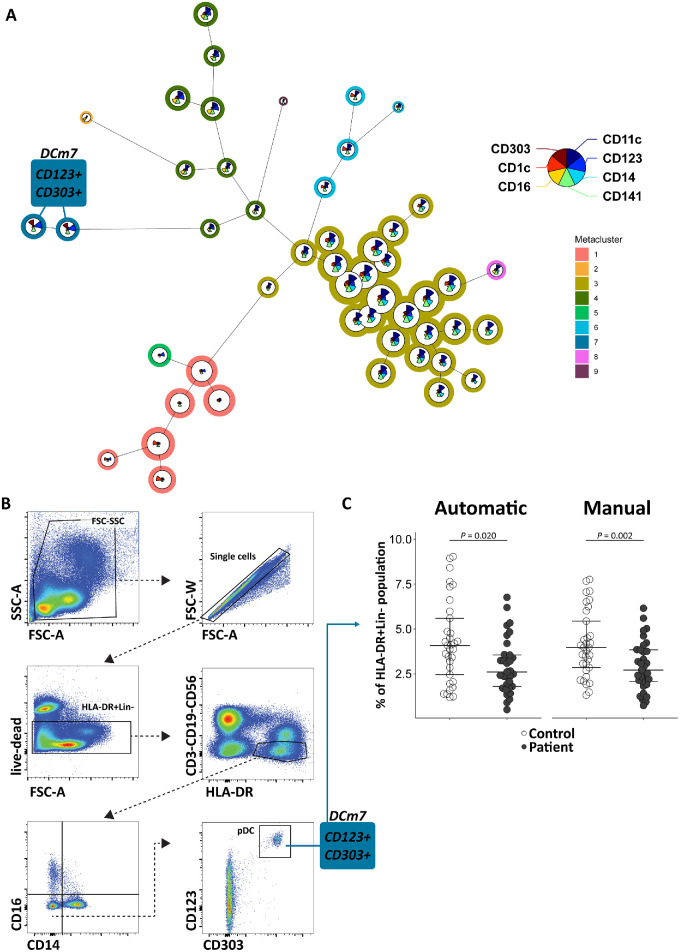
Results: Comparing patients with controls revealed a significant increase in patients in the abundance of circulating CD4+ T cells and CD8+ T cells that express sialyl Lewis X antigen. Furthermore, we detected a decrease in plasmacytoid dendritic cells and an IgA+CD24+CD38+ transitional B-cell subset in patients with an IRD.

Conclusions: Patients with a CRB1-associated IRD show marked changes in blood leukocyte composition, affecting lymphocyte and dendritic cell populations. These results implicate inflammatory pathways in the disease manifestations of IRDs.


Conflict of interest statement

Disclosure: L. Moekotte, None; J.J.W. Kuiper, None; S. Hiddingh, None; X.-T.-A. Nguyen, None; C.J.F. Boon, None; L.I. van den Born, None; J.H. de Boer, None; M.M. van Genderen, None

Figures

Figure 1.
Figure 1.
Study design and quality control. (A) The immune profiling was conducted by flow cytometry in frozen PBMCs of two cohorts of patients with a CRB1-associated IRDs and controls. After quality control, data from 10 flow cytometry experiments were combined for automatic gating by FlowSOM. The populations identified by FlowSOM were confirmed by manual gating. (B) Mean fluorescent intensities for (rainbow) calibration beads across the 10 experiments. The rainbow calibration beads demonstrated that the cytometry lasers performed consistently across multiple experiments. (C) The first two principal components of the manually gated data. The ellipse highlights the close cluster of the internal control samples used in the analysis of each cohort. (D) PCA of the median marker expression values (from flowSOM) before (top) and after (bottom) batch correction. Exp, experiment, IC, internal control.
Figure 2.
Figure 2.
FlowSOM metaclusters with significant changes. Heatmap of unsupervised clustering of all statistically significant (Padj < 0.05) FlowSOM metaclusters identified in this study, divided in four based on hierarchical clustering for visualization purposes. Heatmap colors represent the changes in proportion from a relatively low proportion (in purple blue) to a higher proportion (in dark orange). Dendrograms indicating the clustering relationships (Euclidean distance and Ward2's method) between disease groups and leukocyte populations are shown to the left and above the heatmap. Sex of one control, indicated by an asterisk (*), is missing. A higher proportion of T cells and a lower proportion of B cells and dendritic cells in patients can be appreciated. cDC, conventional dendritic cell panel; DCm, dendritic cell mononuclear panel; HC, healthy control; Th, T helper panel with extracellular staining; Tskew, T helper panel with intracellular staining.
Figure 3.
Figure 3.
CRB1-associated IRDs are characterized by an increase in Lewis Antigen-positive T cells. (A) The FlowSOM tree for the T helper cell panel in patients and controls (combined). Metaclusters of CD8+ and CD4+ T cells expressing the sialyl Lewis X Antigen/CLA epitope are highlighted. The size of the pie chart is relative to the cluster size (ie, median percentage cells in the CD3+ gate). The star charts visualize the relative surface/intracellular marker expression used to distinguish the clusters. Metacluster colors are shown as background color of the clusters. (B) The manual gating strategy to identify the significant populations found in the FlowSOM tree. (C) The abundance of cells in patients and controls. Benjamini–Hochberg post hoc adjusted P values are from the likelihood-ratio test corrected for age and sex. Median and interquartile range are indicated by bars. CCR4, CC chemokine receptor type 4; CD, cluster of differentiation; CLA, cutaneous lymphocyte antigen; IFNg, interferon gamma; IL, interleukin; sLeX, sialyl Lewis X antigen; TNF-a, tumor necrosis factor alpha.
Figure 4.
Figure 4.
pDCs are decreased in CRB1-associated IRDs. (A) The FlowSOM tree for the mononuclear myeloid panel in patients and controls (combined). Metacluster of pDCs is highlighted. The size of the pie chart is relative to the cluster size (ie, median percentage cells in the HLA-DR+Lin gate). The star charts visualize the relative surface marker expression used to distinguish the clusters. Metacluster colors are shown as background color of the clusters. (B) The manual gating strategy to identify the significant populations found in the FlowSOM tree. (C) The abundance of cells in patients and controls. Benjamini–Hochberg post hoc adjusted P values are from the likelihood ratio test corrected for age and sex. Median and interquartile range are indicated by bars. CD, cluster of differentiation.

Similar articles

Cited by

  • Elevated Plasma Complement Factors in CRB1-Associated Inherited Retinal Dystrophies.
    Moekotte L, de Boer JH, Hiddingh S, de Ligt A, Nguyen XT, Hoyng CB, Inglehearn CF, McKibbin M, Lamey TM, Thompson JA, Chen FK, McLaren TL, AlTalbishi A, Panneman DM, Boonen EGM, Banfi S, Bocquet B, Meunier I, De Baere E, Koenekoop R, Oldak M, Rivolta C, Roberts L, Ramesar R, Strupaite-Šileikiene R, Kohl S, Farrar GJ, van Vugt M, van Setten J, Roosing S, van den Born LI, Boon CJF, van Genderen MM, Kuiper JJW. Moekotte L, et al. Invest Ophthalmol Vis Sci. 2025 Feb 3;66(2):55. doi: 10.1167/iovs.66.2.55. Invest Ophthalmol Vis Sci. 2025. PMID: 39982393 Free PMC article.

References

    1. Verbakel SK, van Huet RAC, Boon CJF, et al. .. Non-syndromic retinitis pigmentosa. Prog Retin Eye Res. 2018; 66: 157–186. - PubMed
    1. Hartong DT, Berson EL, Dryja TP.. Retinitis pigmentosa. Lancet. 2006; 368(9549): 1795–1809. - PubMed
    1. Hamel C. Retinitis pigmentosa. Orphanet J Rare Dis. 2006; 1(1): 40. - PMC - PubMed
    1. Heath Jeffery RC, Mukhtar SA, McAllister IL, Morgan WH, Mackey DA, Chen FK. Inherited retinal diseases are the most common cause of blindness in the working-age population in Australia. Ophthalmic Genet. 2021; 42(4): 431–439. - PMC - PubMed
    1. Liew G, Michaelides M, Bunce C.. A comparison of the causes of blindness certifications in England and Wales in working age adults (16-64 years), 1999-2000 with 2009-2010. BMJ Open. 2014; 4(2): e004015. - PMC - PubMed

Publication types