. 2023 Oct 31;42(10):113188.
doi: 10.1016/j.celrep.2023.113188. Epub 2023 Oct 3.

Melanocortin-3 receptor expression in AgRP neurons is required for normal activation of the neurons in response to energy deficiency

Affiliations

Melanocortin-3 receptor expression in AgRP neurons is required for normal activation of the neurons in response to energy deficiency

Yijun Gui et al. Cell Rep. .

Abstract

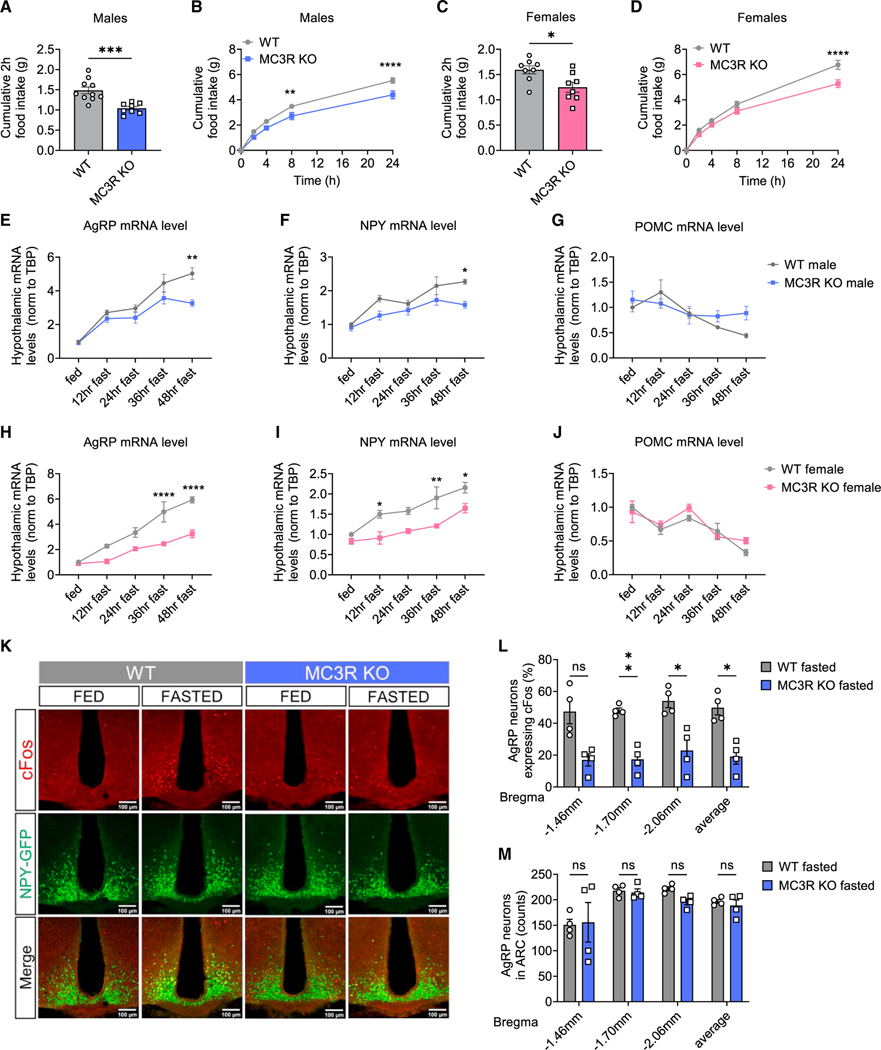
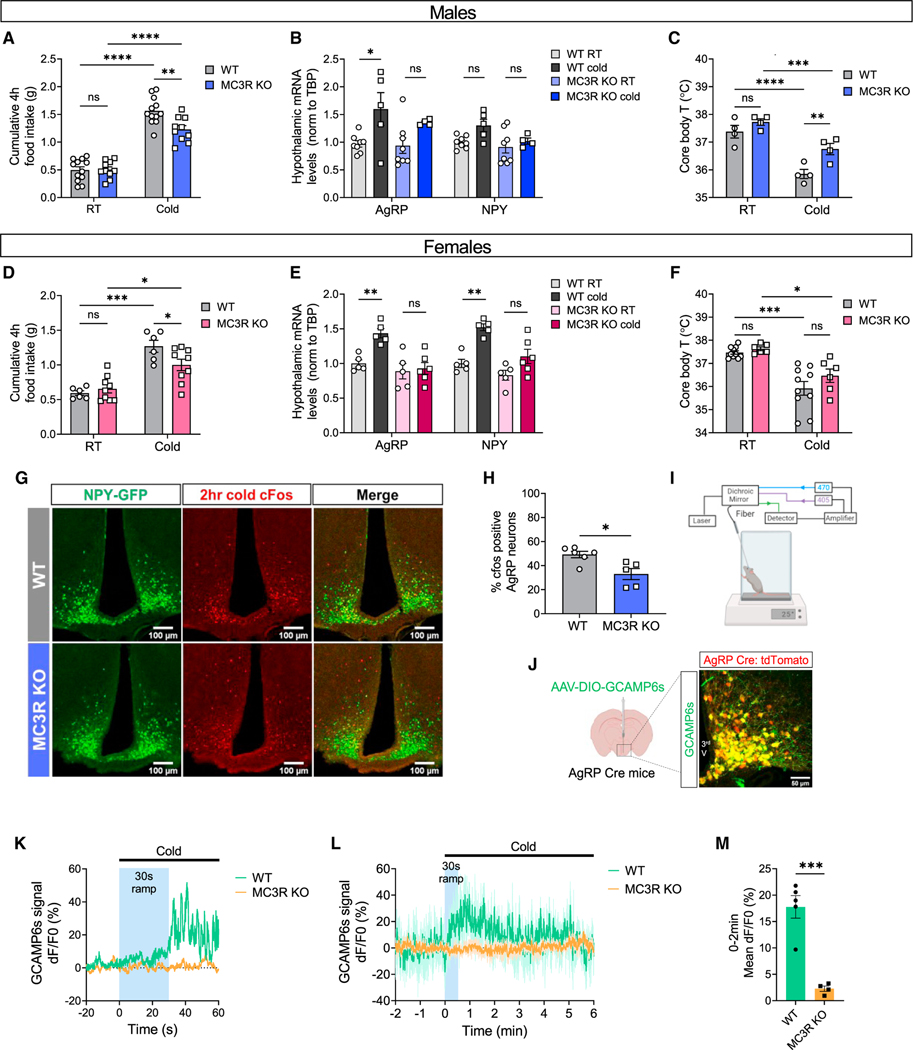
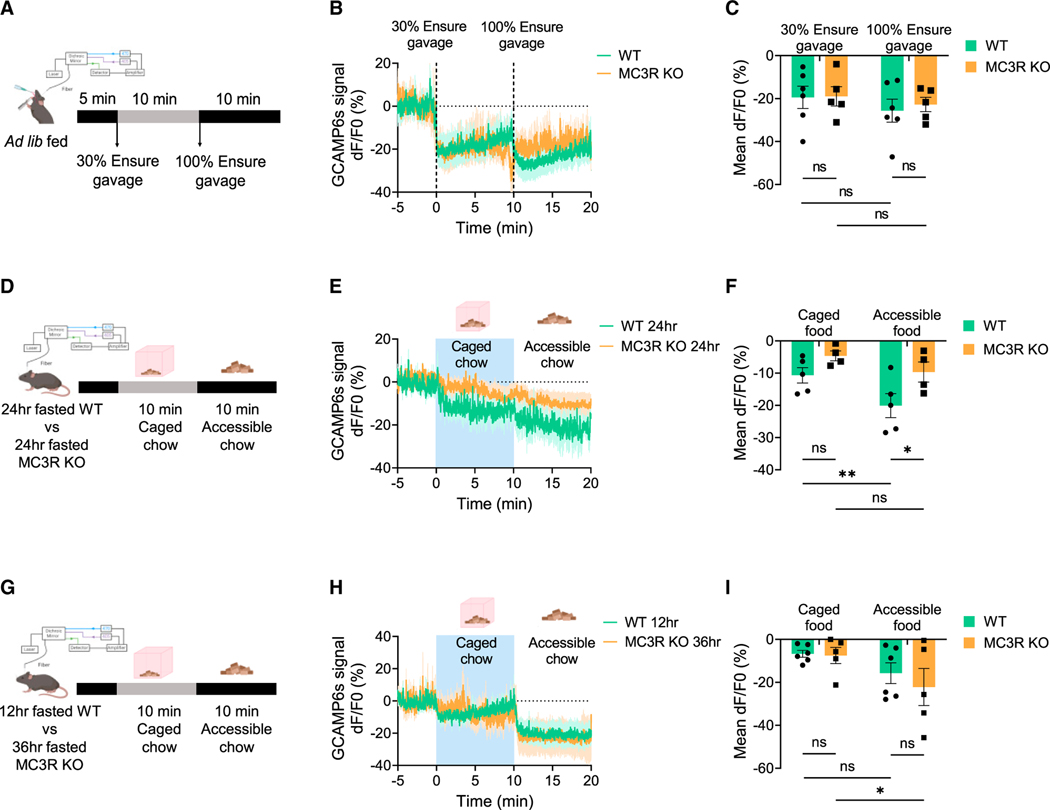
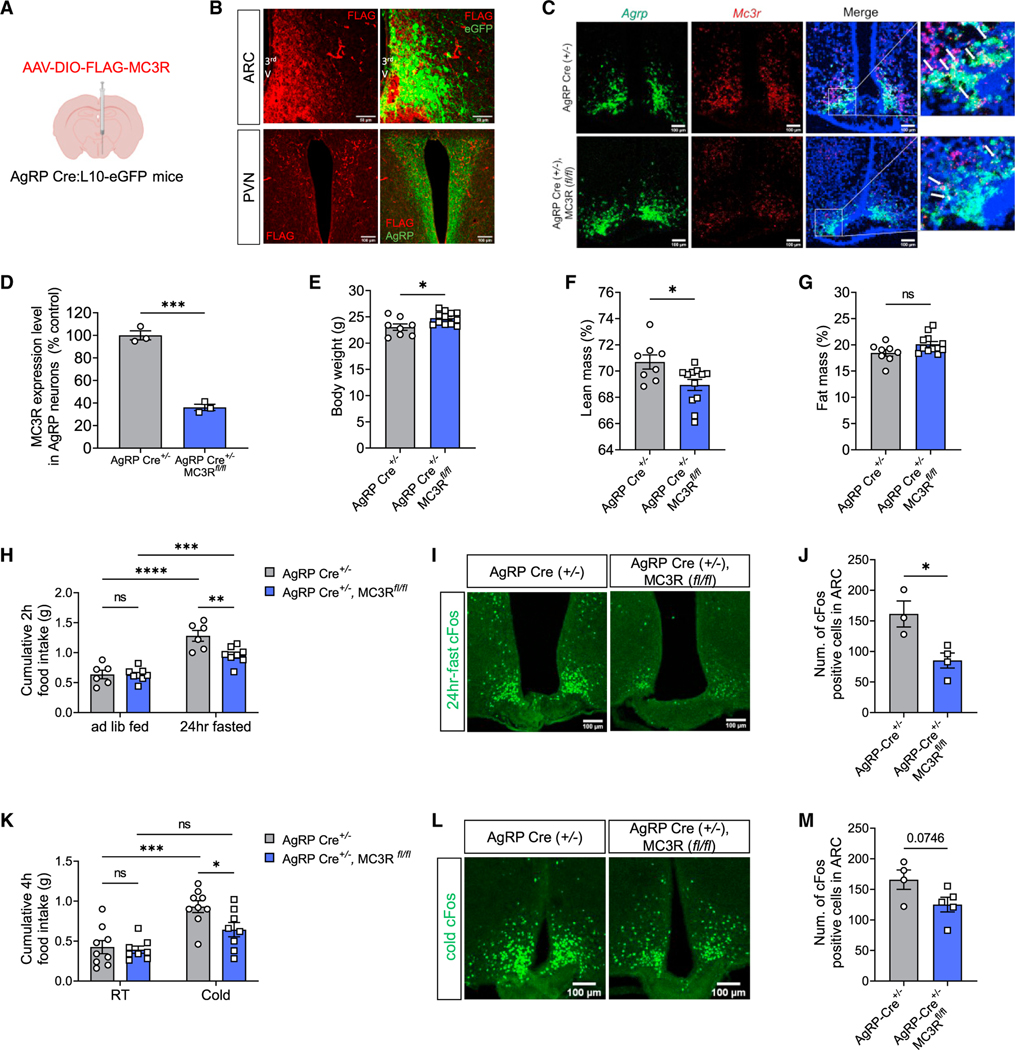
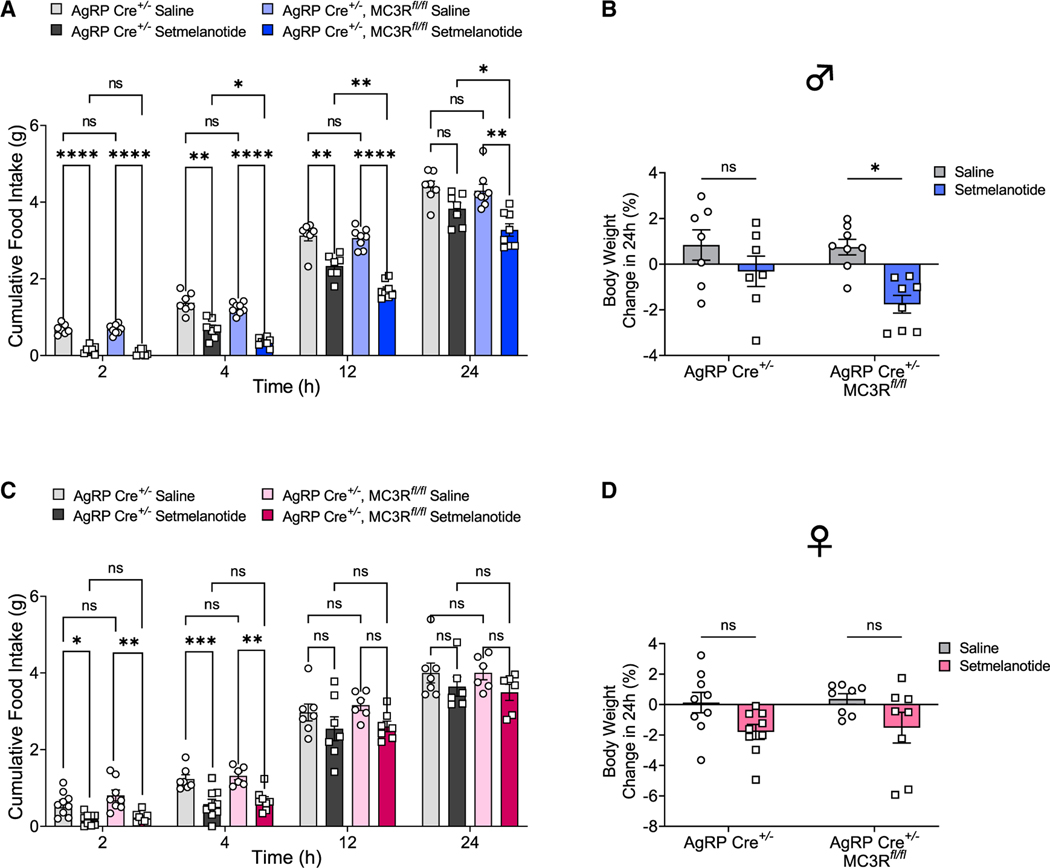
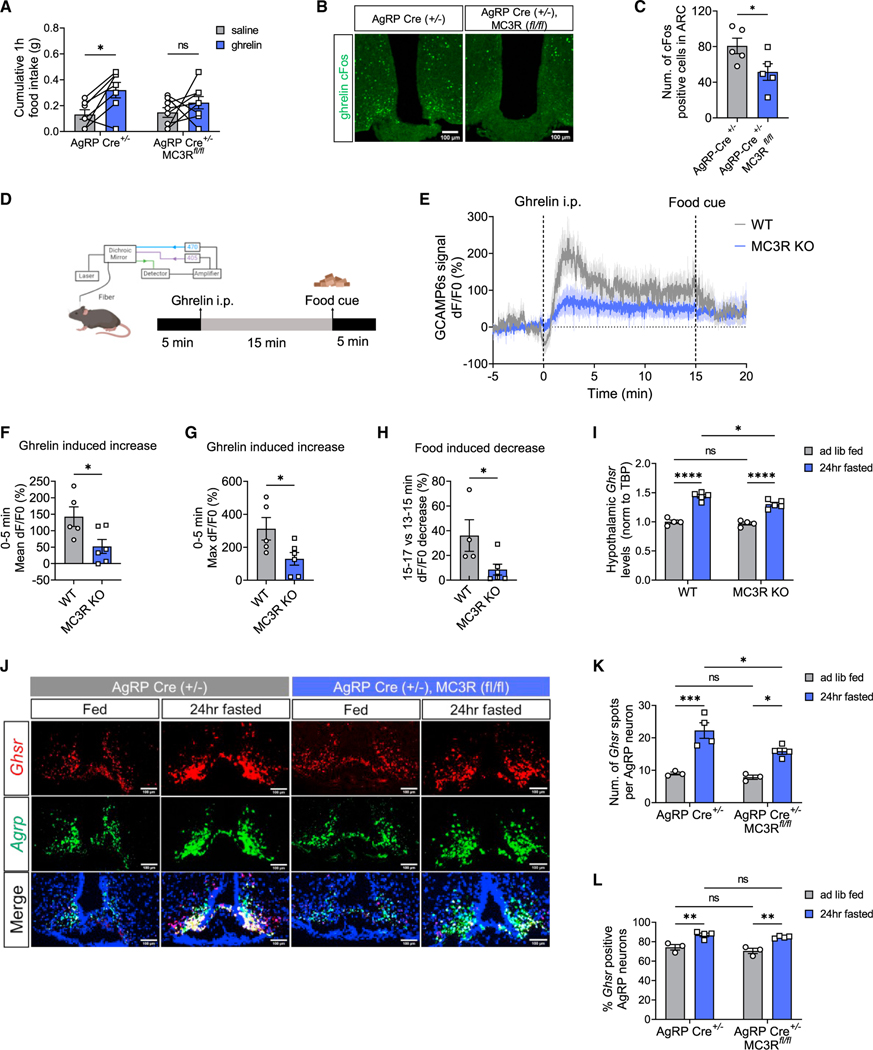
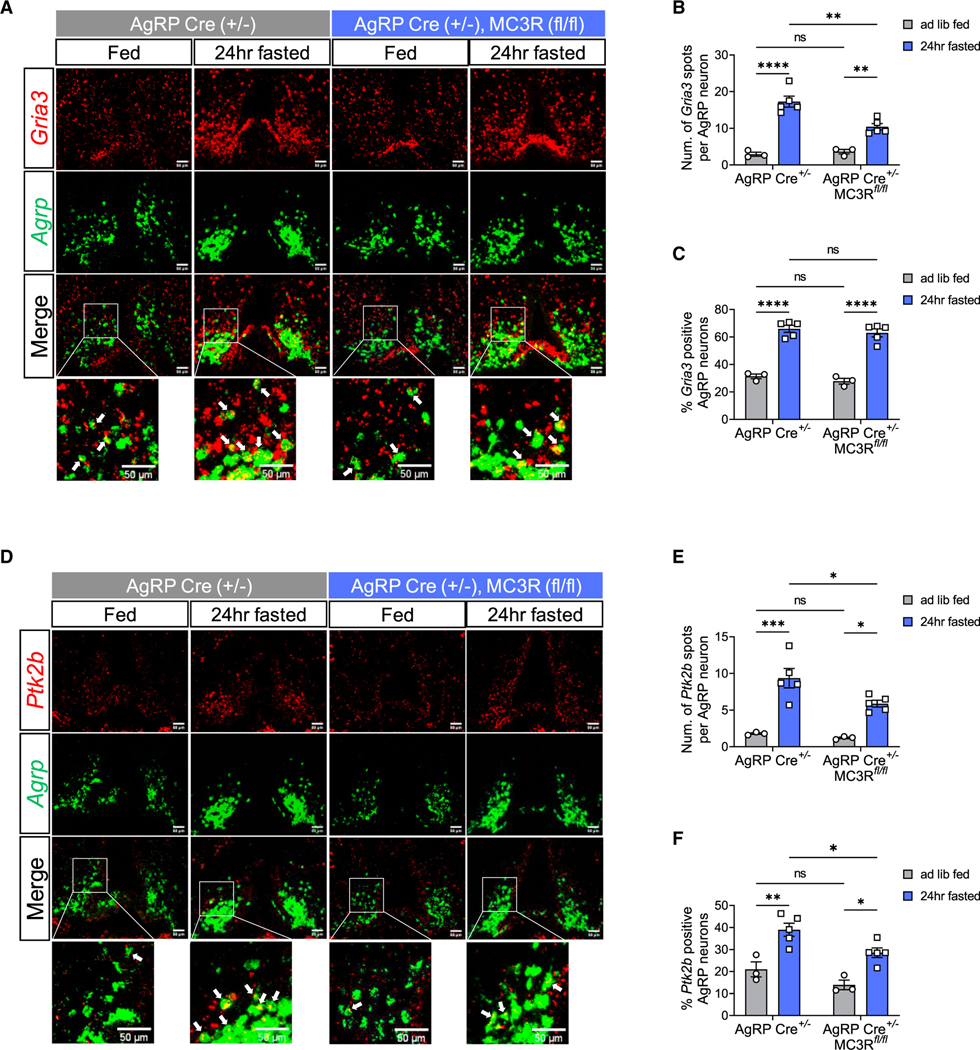
The melanocortin-3 receptor (MC3R) is a negative regulator of the central melanocortin circuitry via presynaptic expression on agouti-related protein (AgRP) nerve terminals, from where it regulates GABA release onto secondary MC4R-expressing neurons. However, MC3R knockout (KO) mice also exhibit defective behavioral and neuroendocrine responses to fasting. Here, we demonstrate that MC3R KO mice exhibit defective activation of AgRP neurons in response to fasting, cold exposure, or ghrelin while exhibiting normal inhibition of AgRP neurons by sensory detection of food in the ad libitum-fed state. Using a conditional MC3R KO model, we show that the control of AgRP neuron activation by fasting and ghrelin requires the specific presence of MC3R within AgRP neurons. Thus, MC3R is a crucial player in the responsiveness of the AgRP soma to both hormonal and neuronal signals of energy need.

Keywords: AgRP; CP: Metabolism; CP: Neuroscience; fasting; food intake; ghrelin.


Conflict of interest statement

Declaration of interests R.D.C., P.S., and the University of Michigan have equity in Courage Therapeutics, and R.D.C. serves on the board of the company. R.D.C. and P.S. have patents filed related to drug development based on the MC3R.

Figures

Figure 1.
Figure 1.. MC3R is required for the activation of AgRP neurons by fasting
(A‒D) 2- (A and C) and 24-h (B and D) food intake of WT and MC3R KO male and female mice following a 24-h fast (n = 8–10 mice for all groups). (E‒J) qPCR analysis of hypothalamic AGRP, NPY, and POMC mRNA levels in WT and MC3R KO male and female mice over a 48-h-fasting time course (n = 3–9 mice for all groups). (K‒M) Representative images of GFP and cFos immunostaining, and quantifications of the percentage of cFos-positive GFP cells and the number of GFP cells in the ARC of 24-h-fasted WT and MC3R KO NPY-GFP male mice. Scale bar, 100 μm (n = 4 mice for all groups). Data are plotted as mean, and all error bars represent the SEM. ns, non-significant; *p < 0.05; **p < 0.01; ***p < 0.001; ****p < 0.0001 in unpaired Student’s t test and two-way ANOVA with Sidak’s post hoc test.
Figure 2.
Figure 2.. MC3R is required for the activation of AgRP neurons in response to cold
(A and D) 4-h food intake of WT and MC3R KO male and female mice under room temperature (RT; 22°C) or cold exposure (4°C) (n = 6–12 mice for all groups). (B, C, E, and F) qPCR analysis of hypothalamic AGRP and NPY mRNA levels (B and E) and measurement of rectal temperature (C and F) in WT and MC3R KO male and female mice under RT or following 4-h cold exposure (n = 4–10 mice for all groups). (G and H) Representative images of GFP and cFos immunostaining, and quantifications of the percentage of cFos-positive GFP cells in the ARC of WT and MC3R KO NPY-GFP male mice following 2-h cold exposure. Scale bar, 100 mm (n = 5–6 mice for each group). (I) Schematic showing the setup of fiber photometry on a cold plate. (J) Validation of Cre-dependent GCAMP6s viral expression in AgRP Cre:tdTomato mice. Scale bar, 50 μm. (K) Representative calcium signal traces from one WT mouse and one MC3R KO male mouse in response to cold exposure for 60 s. −20 to 0 s, 22°C; 0 to 60 s, 12°C, with 30-s temperature ramp. (L and M) Traces and quantifications of averaged dF/F0 (%) GCaMP6s signal in AgRP neurons in WT and MC3R KO male mice during prolonged cold exposure. −2 to 0 min, 22°C; 0 to 6 min, 12°C, with 30-s temperature ramp (n = 5 mice for WT and n = 4 for MC3R KO groups). Data are plotted as mean, and all error bars represent the SEM. ns, non-significant; *p < 0.05; **p < 0.01; ***p < 0.001; ****p < 0.0001 in unpaired Student’s t test and two-way ANOVA with Sidak’s post hoc test.
Figure 3.
Figure 3.. MC3R is not required for the inhibition of AgRP neurons by sensory detection of nutrients or food cues
(A) Schematic showing the setup of fiber photometry in ad lib-fed male mice in response to 30% or 100% Ensure gavage. (B and C) Traces and quantifications of averaged dF/F0 (%) GCaMP6s signal in AgRP neurons in ad lib-fed WT or MC3R KO male mice in response to 30% or 100% Ensure gavage (n = 5–6 mice for each group). (D) Schematic showing the setup of fiber photometry in 24-h-fasted WT or MC3R KO male mice in response to caged or accessible food cues. (E and F) Traces and quantifications of averaged dF/F0 (%) GCaMP6s signal in AgRP neurons in 24-h-fasted WT or MC3R KO male mice in response to caged or accessible food cues (n = 4–5 mice for each group). (G) Schematic showing the setup of fiber photometry in 12-h-fasted WT or 36-h-fasted MC3R KO male mice in response to caged or accessible food cues. (H and I) Traces and quantifications of averaged dF/F0 (%) GCaMP6s signal in AgRP neurons in 12-h-fasted WT or 36-h-fasted MC3R KO male mice in response to food cues (n = 5–6 mice for each group). Data are plotted as mean, and all error bars represent the SEM. ns, non-significant; *p < 0.05; **p < 0.01 in two-way ANOVA with Sidak’s post hoc test.
Figure 4.
Figure 4.. MC3R deletion in AgRP neurons impairs energy deficiency sensing
(A and B) Validation of Cre-dependent MC3R-FLAG viral expression in AgRP Cre:L10-EGFP mice by immunostaining against FLAG, EGFP, and AgRP. Scale bar, 50 μm for the ARC and 100 μm for the PVN. (C and D) RNAscope analysis of Mc3r and Agrp mRNA expression, and quantifications of the percentage of AgRP-positive cells coexpressing MC3R in the ARC of AgRP-Cre and AgRP-specific MC3R KO male mice. Scale bar, 100 μm (n = 3 mice for each group). (E‒G) Body weight and body composition of AgRP-Cre and AgRP-specific MC3R KO male mice (n = 8 mice for AgRP-Cre and n = 12 for AgRP-specific MC3R KO groups). (H) 2-h food intake of AgRP-Cre and AgRP-specific MC3R KO male mice following a 24-h fast (n = 6 mice for AgRP-Cre and n = 8 for AgRP-specific MC3R KO groups). (I and J) Representative images of cFos immunostaining, and quantifications of cFos-positive cell number in the ARC of 24-h-fasted AgRP-Cre and AgRP-specific MC3R KO male mice. Scale bar, 100 μm (n = 3 mice for AgRP-Cre and n = 4 for AgRP-specific MC3R KO groups). (K) 4-h food intake of AgRP-Cre and AgRP-specific MC3R KO male mice under RT (22°C) or cold exposure (4°C) (n = 9 mice for AgRP-Cre and n = 8 for AgRP-specific MC3R KO groups). (L and M) Representative images of cFos immunostaining, and quantifications of cFos-positive cell number in the ARC of cold-treated AgRP-Cre and AgRP-specific MC3R KO male mice. Scale bar, 100 μm (n = 4 mice for AgRP-Cre and n = 5 for AgRP-specific MC3R KO groups). Data are plotted as mean, and all error bars represent the SEM. ns, non-significant; *p < 0.05; **p < 0.01; ***p < 0.001; ****p < 0.0001 in unpaired Student’s t test and two-way ANOVA with Sidak’s post hoc test.
Figure 5.
Figure 5.. MC3R regulates downstream MC4R-mediated anorexigenic activity thorough its action in AgRP neurons
(A and B) Food intake and percentage change of 24-h body weight in AgRP-Cre and AgRP-specific MC3R KO male mice given saline or setmelanotide injection (2 mg/kg, i.p.) (n = 7–8 mice for each group). (C and D) Food intake and percentage change of 24-h body weight in AgRP-Cre and AgRP-specific MC3R KO female mice given saline or setmelanotide injection (2 mg/kg, i.p.) (n = 8–9 mice for each group). Data are plotted as mean, and all error bars represent the SEM. ns, non-significant; *p < 0.05; **p < 0.01; ***p < 0.001; ****p < 0.0001 in two-way ANOVA with Sidak’s post hoc test.
Figure 6.
Figure 6.. MC3R is required for the orexigenic action of ghrelin on AgRP neurons
(A) 1-h food intake of AgRP-Cre and AgRP-specific MC3R KO male mice given saline or ghrelin injection (1.6 mg/kg, i.p.) (n = 7–8 mice for all groups). (B and C) Representative images of cFos immunostaining, and quantifications of cFos-positive cell number in the ARC of AgRP-Cre and AgRP-specific MC3R KO male mice in response to saline or ghrelin injection. Scale bar, 100 μm (n = 4–5 mice for each group). (D) Schematic showing the time course of ghrelin injection and food presence in fiber photometry experiment (E‒H) Traces and quantifications of averaged dF/F0 (%) GCaMP6s signal in AgRP neurons in WT and MC3R KO male mice in response to ghrelin and food cue (n = 4–5 mice for all groups). (I) qPCR analysis of hypothalamic GHSR mRNA levels in fed versus 24-h-fasted WT and MC3R KO male mice (n = 3–5 mice for all groups). (J‒L) RNAscope analysis of Agrp and Ghsr mRNA expression, and quantifications of the number of Ghsr transcripts in each AgRP neuron and the percentage of AgRP neurons coexpressing Ghsr in the ARC of fed versus 24-h-fasted AgRP-Cre and AgRP-specific MC3R KO male mice. Scale bar, 100 μm (n = 3–4 mice for all groups). Data are plotted as mean, and all error bars represent the SEM. ns, non-significant; *p < 0.05; **p < 0.01; ***p < 0.001; ****p < 0.0001 in unpaired Student’s t test and two-way ANOVA with Sidak’s post hoc test.
Figure 7.
Figure 7.. MC3R is required for excitatory synapse-associated gene expression in AgRP neurons
(A‒C) RNAscope analysis of Agrp and Gria3 mRNA expression, and quantifications of the number of Gria3 transcripts in each AgRP neuron and the percentage of AgRP neurons coexpressing Gria3 in the ARC of fed versus 24-h-fasted AgRP-Cre and AgRP-specific MC3R KO male mice. Scale bar, 50 μm (n = 3–5 mice for all groups). (D‒F) RNAscope analysis of Agrp and Ptk2b mRNA expression, and quantifications of the number of Ptk2b transcripts in each AgRP neuron and the percentage of AgRP neurons coexpressing Ptk2b in the ARC of fed versus 24-h-fasted AgRP-Cre and AgRP-specific MC3R KO male mice. Scale bar, 50 μm (n = 3–5 mice for all groups). Data are plotted as mean, and all error bars represent the SEM. ns, non-significant; *p < 0.05; **p < 0.01; ***p < 0.001; ****p < 0.0001 in unpaired Student’s t test and two-way ANOVA with Sidak’s post hoc test.

Update of

References

    1. Cone RD (2005). Anatomy and regulation of the central melanocortin system. Nat. Neurosci 8, 571–578. - PubMed
    1. Huszar D, Lynch CA, Fairchild-Huntress V, Dunmore JH, Fang Q, Berkemeier LR, Gu W, Kesterson RA, Boston BA, Cone RD, et al. (1997). Targeted disruption of the melanocortin-4 receptor results in obesity in mice. Cell 88, 131–141. - PubMed
    1. Yeo GS, Farooqi IS, Aminian S, Halsall DJ, Stanhope RG, and O’Rahilly S. (1998). A frameshift mutation in MC4R associated with dominantly inherited human obesity. Nat. Genet 20, 111–112. - PubMed
    1. Vaisse C, Clement K, Guy-Grand B, and Froguel P. (1998). A frameshift mutation in human MC4R is associated with a dominant form of obesity. Nat. Genet 20, 113–114. - PubMed
    1. Tallam LS, da Silva AA, and Hall JE (2006). Melanocortin-4 receptor mediates chronic cardiovascular and metabolic actions of leptin. Hypertension 48, 58–64. - PubMed

Publication types