. 2023 Oct 4;18(10):e0292225.
doi: 10.1371/journal.pone.0292225. eCollection 2023.

Moderate intensity continuous versus high intensity interval training: Metabolic responses of slow and fast skeletal muscles in rat

Affiliations

Moderate intensity continuous versus high intensity interval training: Metabolic responses of slow and fast skeletal muscles in rat

Morgane Pengam et al. PLoS One. .

Abstract

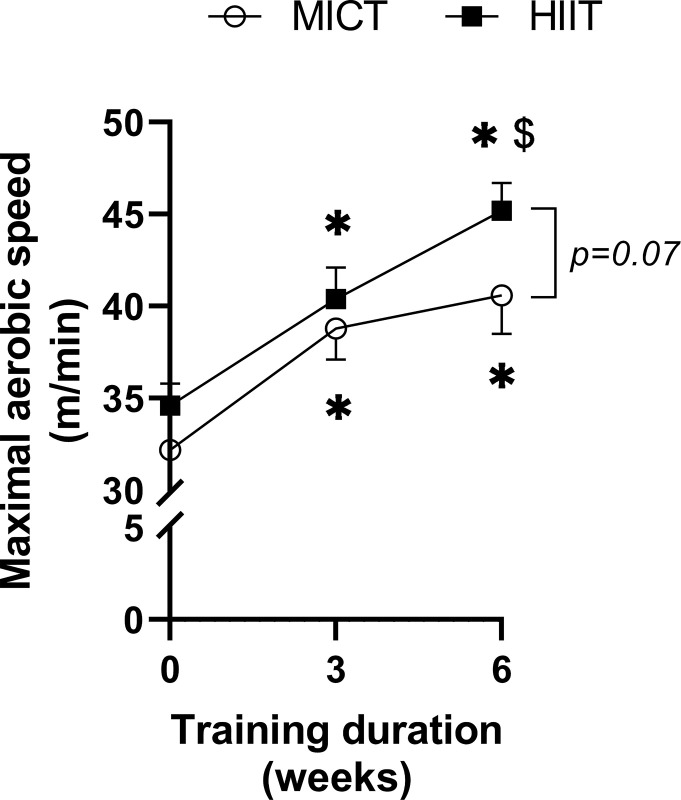
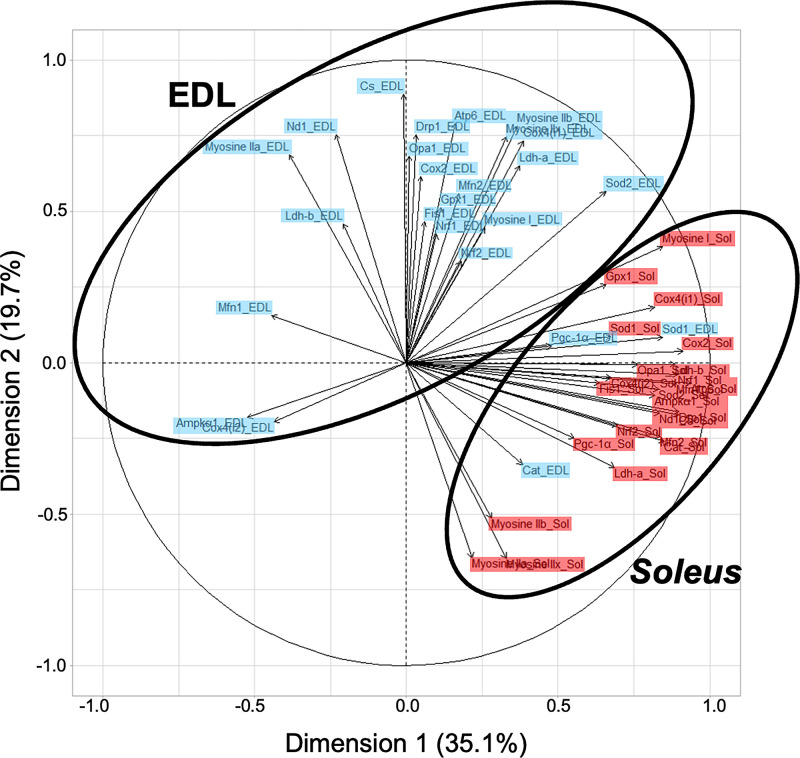
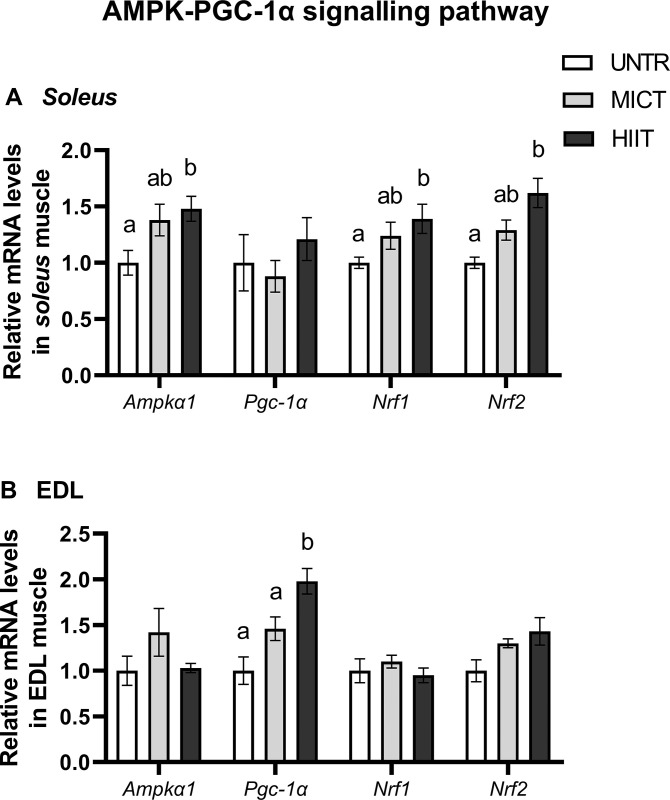
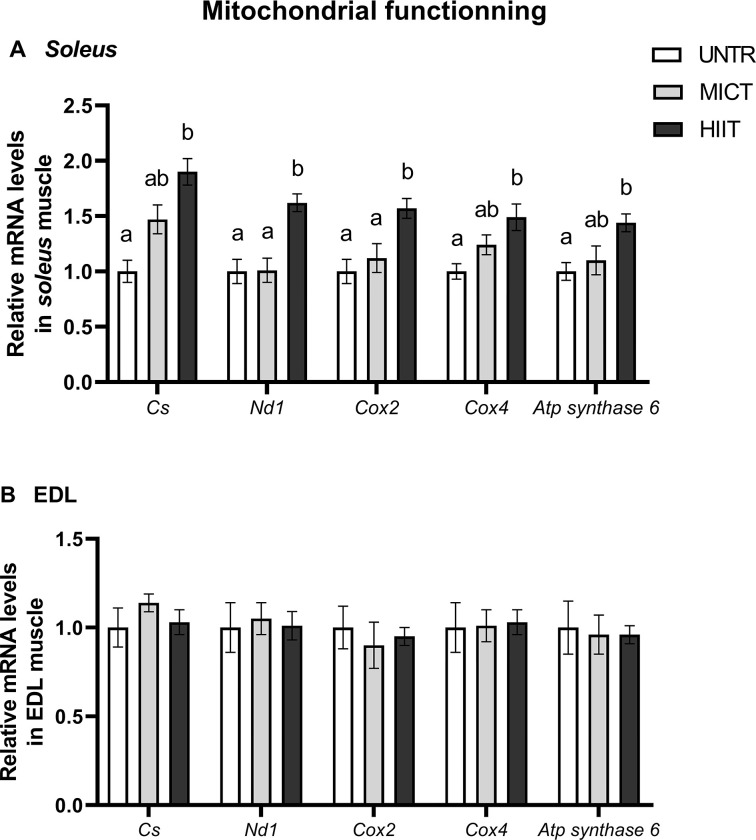
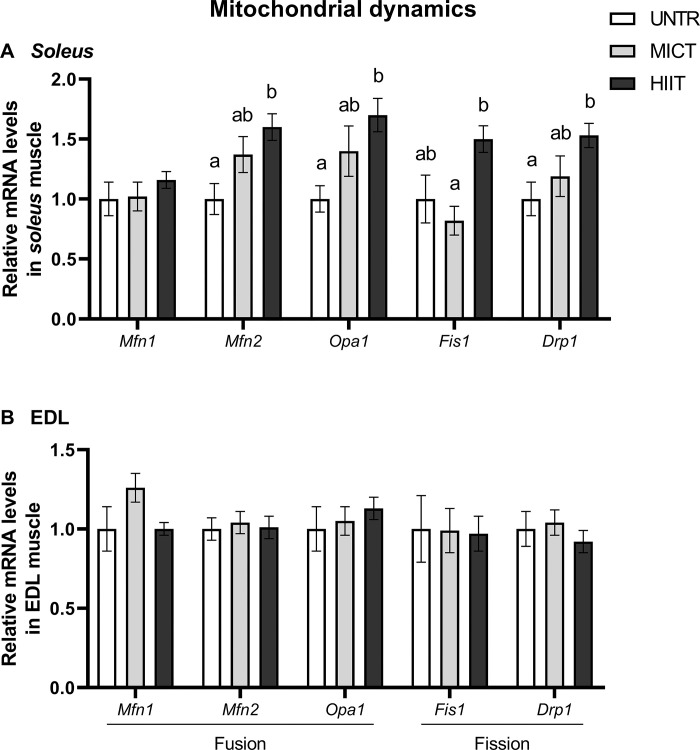
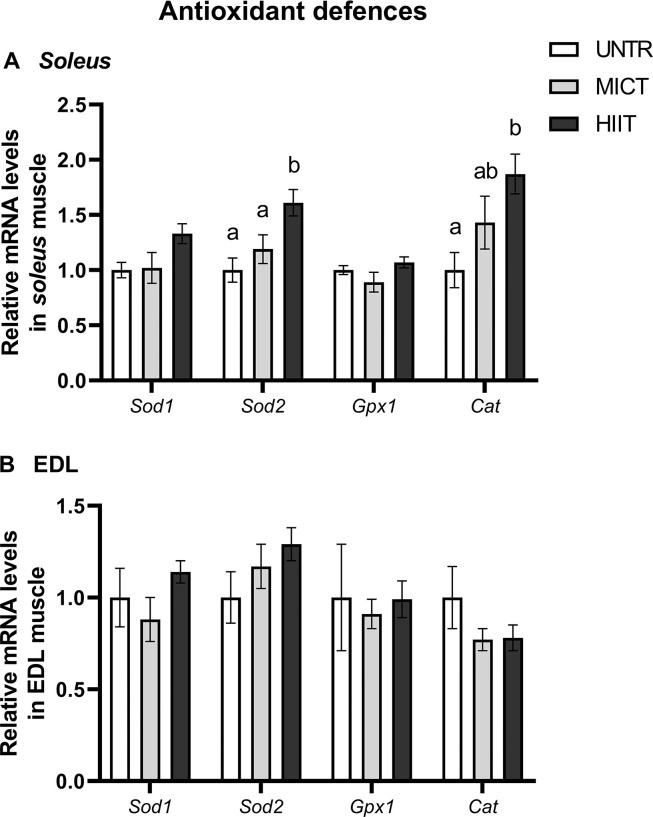
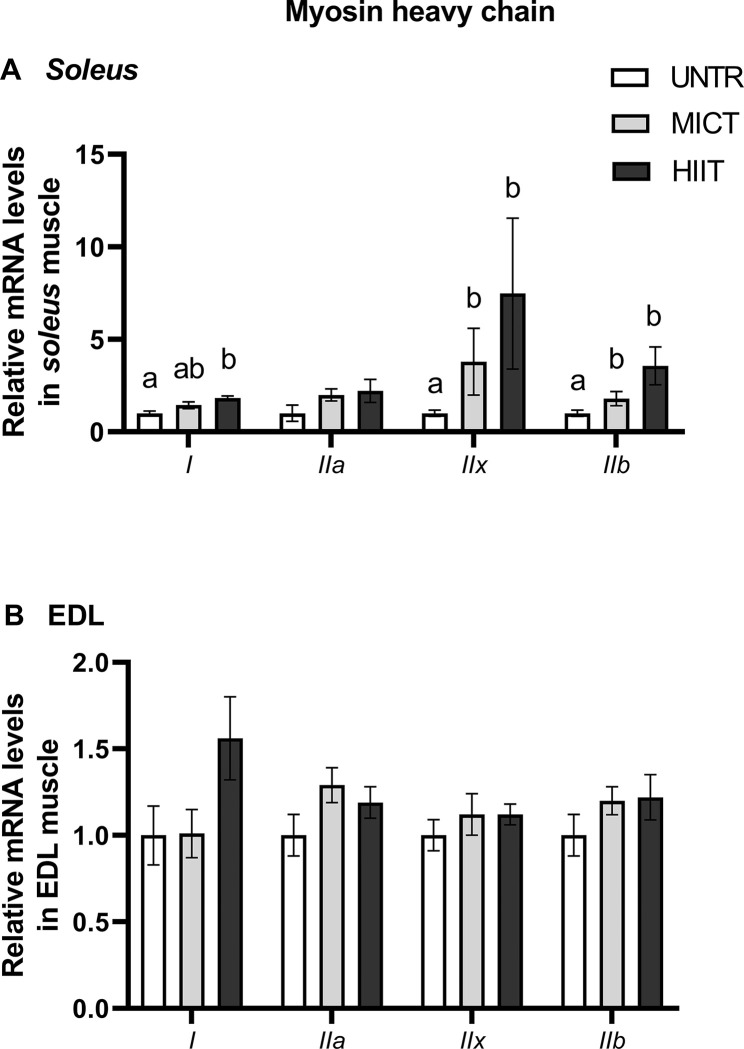
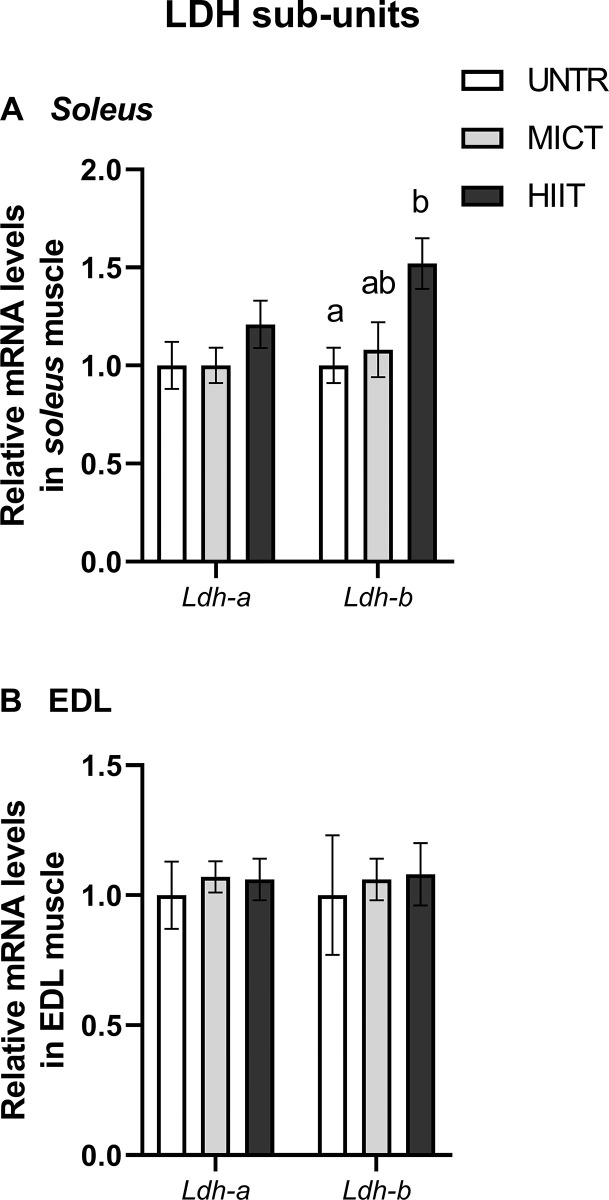
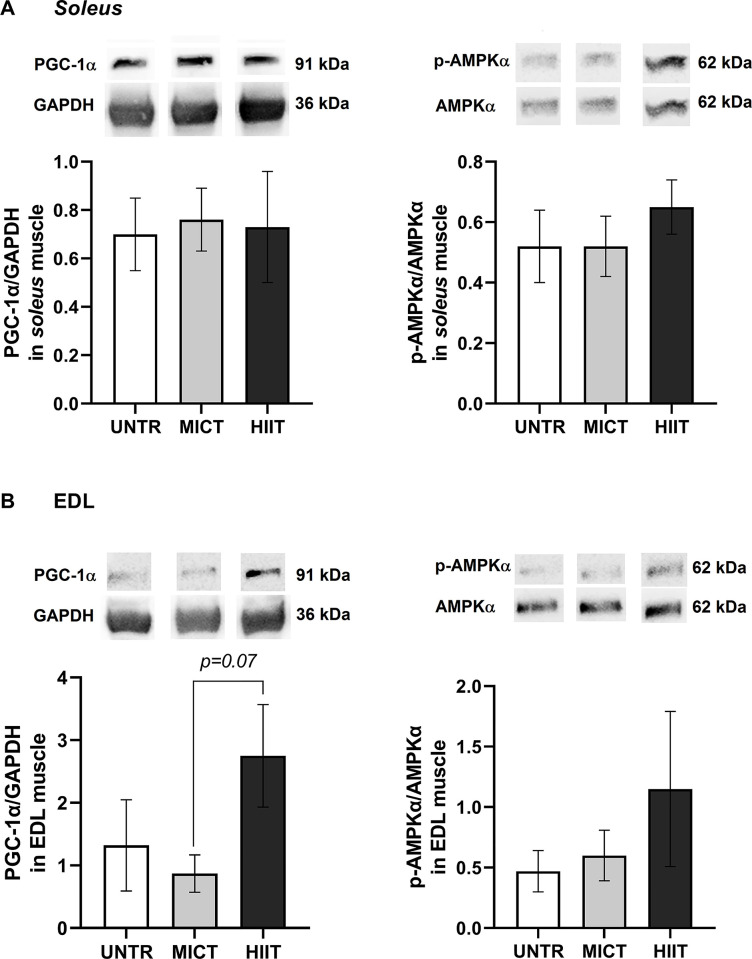
The healthy benefits of regular physical exercise are mainly mediated by the stimulation of oxidative and antioxidant capacities in skeletal muscle. Our understanding of the cellular and molecular responses involved in these processes remain often uncomplete particularly regarding muscle typology. The main aim of the present study was to compare the effects of two types of exercise training protocol: a moderate-intensity continuous training (MICT) and a high-intensity interval training (HIIT) on metabolic processes in two muscles with different typologies: soleus and extensor digitorum longus (EDL). Training effects in male Wistar rats were studied from whole organism level (maximal aerobic speed, morphometric and systemic parameters) to muscle level (transcripts, protein contents and enzymatic activities involved in antioxidant defences, aerobic and anaerobic metabolisms). Wistar rats were randomly divided into three groups: untrained (UNTR), n = 7; MICT, n = 8; and HIIT, n = 8. Rats of the MICT and HIIT groups ran five times a week for six weeks at moderate and high intensity, respectively. HIIT improved more than MICT the endurance performance (a trend to increased maximal aerobic speed, p = 0.07) and oxidative capacities in both muscles, as determined through protein and transcript assays (AMPK-PGC-1α signalling pathway, antioxidant defences, mitochondrial functioning and dynamics). Whatever the training protocol, the genes involved in these processes were largely more significantly upregulated in soleus (slow-twitch fibres) than in EDL (fast-twitch fibres). Solely on the basis of the transcript changes, we conclude that the training protocols tested here lead to specific muscular responses.


Conflict of interest statement

The authors have declared that no competing interests exist.

Figures

Fig 1
Fig 1. Effect of MICT and HIIT on maximal aerobic speed (MAS) as a function of training duration.
Values of MAS are means ± SEM. In a same experimental group (MICT or HIIT), * indicates a significant difference from the MAS before starting the training (p < 0.05) and $ indicates a significant difference from the MAS after three weeks of training (p < 0.05). No significant differences were observed between MICT and HIIT.
Fig 2
Fig 2. Principal component analysis (PCA) performed using all mRNA levels studied in soleus (in red, n = 21) and EDL (in blue, n = 21) muscles of the MICT and HIIT groups.
See Table 1 for more details.
Fig 3
Fig 3
Effects of MICT and HIIT on Ampkα1, Pgc-1α, Nrf1 and Nrf2 mRNA levels in soleus (A) and EDL (B) muscles. UNTR: n = 6; MICT: n = 7; HIIT: n = 8. Results are expressed as fold change compared with UNTR, which is set at 1. Results are means ± SEM. Bars with different letters indicate groups that are significantly different (p < 0.05).
Fig 4
Fig 4
Effects of MICT and HIIT on citrate synthase (Cs), NADH dehydrogenase 1 (Nd1), cytochrome c oxidase (Cox) 2 and 4 and Atp synthase 6 mRNA levels in soleus (A) and EDL (B) muscles. UNTR: n = 6; MICT: n = 7; HIIT: n = 8. Results are expressed as fold change compared with UNTR, which is set at 1. Results are means ± SEM. Bars with different letters indicate groups that are significantly different (p < 0.05).
Fig 5
Fig 5
Effects of MICT and HIIT on mRNA levels related to mitochondrial fusion: mitofusin (Mfn) 1 and 2 and optic atrophy protein (Opa1); and fission: fission protein 1 (Fis1) and dynamin-related protein 1 (Drp1) in soleus (A) and EDL (B) muscles. UNTR: n = 6; MICT: n = 7; HIIT: n = 8. Results are expressed as fold change compared with UNTR, which is set at 1. Results are means ± SEM. Bars with different letters indicate groups that are significantly different (p < 0.05).
Fig 6
Fig 6
Effects of MICT and HIIT on mRNA levels related to antioxidant defences, superoxide dismutase (Sod) 1 and 2, glutathione peroxidase 1 (Gpx1) and catalase (Cat), in soleus (A) and EDL (B) muscles. UNTR: n = 6; MICT: n = 7; HIIT: n = 8. Results are expressed as fold change compared with UNTR, which is set at 1. Results are means ± SEM. Bars with different letters indicate groups that are significantly different (p < 0.05).
Fig 7
Fig 7
Effects of MICT and HIIT on myosin heavy chain I, IIa, IIx and IIb mRNA levels in soleus (A) and EDL (B) muscles. UNTR: n = 6; MICT: n = 7; HIIT: n = 8. Results are expressed as fold change compared with UNTR, which is set at 1. Results are means ± SEM. Bars with different letters indicate groups that are significantly different (p < 0.05).
Fig 8
Fig 8
Effects of MICT and HIIT on lactate dehydrogenase (Ldh)-a and -b subunit mRNA levels in soleus (A) and EDL (B) muscles. UNTR: n = 6; MICT: n = 7; HIIT: n = 8. Results are expressed as fold changes compared with UNTR, which is set at 1. Results are means ± SEM. Bars with different letters indicate groups that are significantly different (p < 0.05).
Fig 9
Fig 9
Effects of MICT and HIIT on PGC-1α and p-AMPKα/AMPKα ratio protein contents in soleus (A) and EDL (B) muscles. PGC-1α was normalized with GAPDH. Soleus: UNTR: n = 7; MICT: n = 6 and HIIT: n = 8. EDL: UNTR: n = 6; MICT: n = 7 and HIIT: n = 8. Results are means ± SEM. No significant differences were observed between groups.

Similar articles

Cited by

References

    1. Dupas J, Feray A, Guernec A, Pengam M, Inizan M, Guerrero F, et al.. Effect of personalized moderate exercise training on Wistar rats fed with a fructose enriched water. Nutr Metab (Lond). 2018;15: 69. doi: 10.1186/s12986-018-0307-6 - DOI - PMC - PubMed
    1. Weston KS, Wisløff U, Coombes JS. High-intensity interval training in patients with lifestyle-induced cardiometabolic disease: a systematic review and meta-analysis. Br J Sports Med. 2014;48: 1227–1234. doi: 10.1136/bjsports-2013-092576 - DOI - PubMed
    1. Prasun P. Mitochondrial dysfunction in metabolic syndrome. Biochimica et Biophysica Acta (BBA)—Molecular Basis of Disease. 2020;1866: 165838. doi: 10.1016/j.bbadis.2020.165838 - DOI - PubMed
    1. Summermatter S, Shui G, Maag D, Santos G, Wenk MR, Handschin C. PGC-1α Improves Glucose Homeostasis in Skeletal Muscle in an Activity-Dependent Manner. Diabetes. 2013;62: 85–95. doi: 10.2337/db12-0291 - DOI - PMC - PubMed
    1. MacInnis MJ, Gibala MJ. Physiological adaptations to interval training and the role of exercise intensity. The Journal of Physiology. 2017;595: 2915–2930. doi: 10.1113/JP273196 - DOI - PMC - PubMed

Publication types