Nuclear ERK1/2 signaling potentiation enhances neuroprotection and cognition via Importinα1/KPNA2
- PMID: 37792911
- PMCID: PMC10630888
- DOI: 10.15252/emmm.202215984
Nuclear ERK1/2 signaling potentiation enhances neuroprotection and cognition via Importinα1/KPNA2
Abstract
Cell signaling is central to neuronal activity and its dysregulation may lead to neurodegeneration and cognitive decline. Here, we show that selective genetic potentiation of neuronal ERK signaling prevents cell death in vitro and in vivo in the mouse brain, while attenuation of ERK signaling does the opposite. This neuroprotective effect mediated by an enhanced nuclear ERK activity can also be induced by the novel cell penetrating peptide RB5. In vitro administration of RB5 disrupts the preferential interaction of ERK1 MAP kinase with importinα1/KPNA2 over ERK2, facilitates ERK1/2 nuclear translocation, and enhances global ERK activity. Importantly, RB5 treatment in vivo promotes neuroprotection in mouse models of Huntington's (HD), Alzheimer's (AD), and Parkinson's (PD) disease, and enhances ERK signaling in a human cellular model of HD. Additionally, RB5-mediated potentiation of ERK nuclear signaling facilitates synaptic plasticity, enhances cognition in healthy rodents, and rescues cognitive impairments in AD and HD models. The reported molecular mechanism shared across multiple neurodegenerative disorders reveals a potential new therapeutic target approach based on the modulation of KPNA2-ERK1/2 interactions.
Keywords: ERK signaling; KPNA2; cell penetrating peptide therapeutics; cognitive enhancement; neuroprotection.
© 2023 The Authors. Published under the terms of the CC BY 4.0 license.
Conflict of interest statement
MI, AP, RB, and SF declare a patent application for RB5 (WO/2019/102201).
Figures
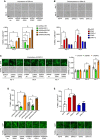
(Top panel) Representative images of the TUNEL assay in MEFs after knockdown of ERK1 or ERK2 (bottom panel) shRNA ERK1 and shRNAmir‐ERK1 decreased apoptosis, whereas shRNA or shRNAmir for ERK2 increased cell death at days 3 and 5 (n = 14–25 slides per group).
(Top panel) Representative images of the TUNEL assay in MEFs overexpressing ERK1, ERK2, or their chimeric constructs (bottom panel). Overexpression of ERK1 or ERK2 > 1 increased apoptosis at days 3 and 5. However, overexpression of ERK2 or ERK1 > 2 did not alter cell survival compared to controls (n = 9–12 slides per group).
(Left panel) Representative images of the TUNEL assay in cortical embryonic cultures after knockdown of ERK1 or ERK2 (right panel). The shRNA ERK2 group increased cell death at days 5 and 7. In contrast, shRNA ERK1 reduced apoptosis only at day 7 (n = 6 slides per group).
TUNEL assay performed on striatal slices of adult mice after knockdown of ERK1 or ERK2. ERK2 knockdown enhanced cell death, while ERK1 knockdown slightly reduced apoptosis (n = 4 mice per group).
TUNEL assay performed on striatal slices of adult mice overexpressing ERK1, ERK2, or their chimeric constructs. Striatal overexpression of ERK1 or ERK2 > 1 enhanced apoptosis. In contrast, mice overexpressing ERK2 or ERK1 > 2 showed levels of apoptosis comparable to eGFP controls (n = 6 mice per group).
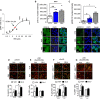
- A
Logarithmic dose‐response curve of RB5 activation of ERK (expressed as arbitrary units, AU) in fresh striatal slices from adult mice treated with different doses of RB5. RB5 enhanced pERK with an EC50 of 3.4 μM. Data were obtained from n = 8–12 slices per group.
- B, C
HEK293 cells were treated with 50 μM RB5, FBS 20% (positive control) for 15 min or untreated (CTR, negative control). Cells were processed for ERK1/2 (B) and phospho‐ERK1/2 immunofluorescence (C). Data have been obtained from two independent experiments (n = 6–9 slides per group) (B, top panel). Both RB5 and FBS induced ERK1/2 translocation into the nucleus. (B, bottom panel) Representative images of ERK1/2 immunofluorescence. (C, top panel) Both RB5 and FBS induced phospho‐ERK1/2 translocation into the nucleus. (C, bottom panel) Representative images of phospho‐ERK1/2 immunofluorescence. Scale bar: 20 μm.
- D, E
(top panels) Representative merged images showing histone AcH3 phosphorylation (D) and ribosomal S6 protein phosphorylation (E) in ex vivo acute slices pretreated for 1 h with 50 μM Scramble (SCR) or RB5 peptide and stimulated for 10 min with glutamate (GLU, 100 μM) or Vehicle (Veh). Red: NeuN. Green: pAcH3, pS6. Scale bar: 50 μm. (D, bottom panel) RB5 enhanced glutamate‐induced AcH3 phosphorylation but (E, bottom panel) prevented glutamate‐mediated S6 activation. Data were obtained from two independent experiments (n = 9–19 slices per group).
- F, G
(top panels) Representative merged images showing pAcH3 (F), and pS6 (G) on slices from ERK1−/− mice pretreated ex‐vivo for 1 h with SCR or RB5 peptide (50 μM) and stimulated with glutamate or vehicle for 10 min. Red: NeuN. Green: pAcH3, pS6. Scale bar: 50 μm. (F, bottom panel) In response to glutamate, pAcH3 is enhanced in ERK1−/− slices (two independent experiments, n = 11 slices) (G, bottom panel). Glutamate‐mediated pS6 enhancement is prevented in ERK1−/− mice (two independent experiments, n = 8–15 slices).
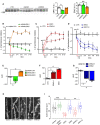
- A
Western blot analysis of striatal extracts obtained from adult mice after knockdown of ERK1 or ERK2. shRNA ERK1 and shRNA ERK2 specifically reduced ERK1 and ERK2 protein levels, respectively (n = 5 mice per group).
- B–G
Spontaneous rotational behavior measured after knockdown or overexpression of ERK1 and ERK2, or their chimeric constructs, 2 weeks (2w) post‐LV injection (n = 13–29 mice per group). (B) Control mice (bilateral striatal injection of ctr shRNA) showed an equal number of 180° rotations to either side. Unilateral expression of shRNA ERK1 (combined with contralateral ctr shRNA injection) induced net contralateral rotations (negative values), whereas shRNA ERK2 induced increased ipsilateral rotations (positive values). (E) Area under the curve (AUC) analysis over 10 days. (C) Mice unilaterally overexpressing ERK1 or ERK2 > 1 showed increased ipsilateral rotations (positive values). (F) AUC analysis over 10 days. (D) Mice overexpressing ERK2 or ERK1 > 2 showed net contralateral rotations (negative values) compared to control mice (G) AUC analysis over 10 days.
- H
Representative images of dendritic spines on striatal neurons after knockdown or overexpression of ERK1, ERK2, or their chimeric constructs.
- I
Neurons of mice overexpressing ERK1 or ERK2 > 1 showed decreased spine density, while mice overexpressing ERK1 > 2 and mice with ERK1 downregulated showed increased spine density. Data were obtained from 3 to 9 mice per group. The mean for each group is represented by the solid diamonds, the median by the horizontal bars in the box plot, the box upper and lower edges are the 75% limits and the whiskers are the 90% limits.

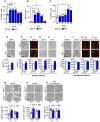
- A, B
HEK293 cells were treated with RB5 50 μM, or FBS 20% (positive control) for 15 min, or untreated (CTR, negative control). Data were obtained from two independent experiments (n = 12 independent samples per group). RB5 treatment significantly increased ERK1 and ERK2 phosphorylation (A, left panel) with no effect on total ERK1 and ERK2 levels (B, left panel). (A, B, right panels) Representative Western blots of pERK1/2 and total ERK1/2.
- C, D
HEK293 cells were treated with RB5 50 μM or anisomycin 5 μM (AN) as a positive control for 30 min or untreated cells (CTR, negative control). Data were obtained from two independent experiments (n = 12 independent samples per group). RB5 treatment did not affect either phospho‐JNK p54 and p46 (C, left panel) or total JNK p54 and p46 levels (D, left panel). (C, D, right panels) Representative Western blots of phospho‐JNKs and total JNKs.
- A
p‐ERK‐positive cells in dorsal striatum induced by a single dose of RB5 (20 mg/kg, i.p.) at different time points. Scramble (SCR)‐injected mice (20 mg/kg, i.p.) were perfused after 1 h. RB5‐mediated enhancement of ERK phosphorylation lasted up to 6 h post injection (n = 5 mice per group).
- B
RB5 brain levels measured with mass spectrometry at different time points after a single administration (20 mg/kg i.p.). High levels of RB5 were detected up to 6 h (n = 3–5 mice per group).
- C
p‐ERK‐positive cells in the dorsal striatum induced by increasing doses of RB5 (1.5, 2.5, 5, 10, and 20 mg/kg, i.p.) 1 h after administration. SCR peptide was injected at 20 mg/kg, i.p. All mice were perfused after 1 h. RB5 caused an increase in ERK phosphorylation at both 10 and 20 mg/kg.
- D–L
(top panels) Representative images showing p‐ERK, nuclear ERK‐dependent markers, and cytoplasmic markers in the striata of mice 1 h after a single injection with RB5 or SCR peptide (20 mg/kg, i.p.). Red: NeuN. Green: pAcH3, pS6 (Ser235/236), pS6 (Ser240/244). (bottom panels) RB5 increased ERK phosphorylation (D) and promoted a selective activation of nuclear ERK‐dependent markers pMSK‐1 (E), pAcH3 (F), pELK (G), and c‐Fos (H). Differently, RB5 did not affect the phosphorylation of cytoplasmic proteins MEK‐1 (I) or Kv4.2 (J). RB5 slightly reduced ERK‐dependent phosphorylation of S6 (Ser235/236) (K), but had no effect on mTOR/TORC1‐dependent phosphorylation of S6 (Ser240/244) (L). Data were obtained from n = 14–16 mice per group.
- M–O
(top panels). Representative images of phosphorylation of ERK, AcH3, and S6 in the striata of ERK1−/− mice after a single RB5 injection (20 mg/kg, i.p.) (M, bottom panel). RB5 increased ERK phosphorylation in WT but not in ERK1−/− mice. (N, bottom panel) RB5 increased pAcH3 in WT mice. (O, bottom panel) RB5 treatment did not affect S6 (Ser235/236) phosphorylation in both WT and ERK1−/− mice (n = 8–10 mice per group).
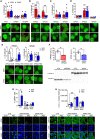
- A–E
HEK293 cells were transfected with tagged importins together with GFP, ERK1‐GFP, or ERK2‐GFP and processed for PLA. Data were obtained from 2 to 3 independent experiments (n = 5–9 slides per condition). Data are shown as number of dots/cells in ERK1‐or ERK2 transfected cells—number of dots/cells in GFP transfected cells. In all experiments, few aspecific interactions occurred between the importins and the GFP alone, but the number of interactions in ERK1 and ERK2‐transfected cells was significantly higher. (A–E) (bottom panels) Representative images of PLA (green: GFP, red: PLA interactions). (A, top panel) IPO7, KPNB1, and RanBP5 did not preferentially interact with ERK1 or ERK2. (B, top panel) KPNA2 and KPNA7 preferentially interacted with ERK1. (C, top panel) KPNA3 and KPNA4 did not show a preferential interaction with ERK isoforms. (D, top panel) KPNA1, KPNA5, and KPNA6 did not show a preferential interaction with ERK isoforms. (E) RB5 treatment (50 μM for 1 h) specifically prevented the interaction of KPNA2 with ERK1, while promoting the binding with ERK2. The interaction of KPNA5 with ERK1 and ERK2 was not affected by RB5 treatment.
- F
HEK293 cells were treated with siRNA KPNA2, siRNA IPO7 or not treated (CTR). Western blot analysis revealed an effective downregulation of KPNA2 and IPO7 induced by the respective siRNAs (n = 3 independent samples per group).
- G–H
Immunofluorescence analysis of HEK293 pretreated with siRNA KPNA2 and siRNA IPO7 (200 nM for 24 h) or not treated (CTR) and subsequently stimulated with RB5 (50 μM for 15 min). (G, top panel) RB5 failed to induce ERK1/2 activation upon KPNA2 or IPO7 downregulation. (H, top panel) Downregulation of KPNA2 enhanced ERK1/2 nuclear translocation. However, RB5 treatment did not further enhance ERK1/2 nuclear translocation (n = 4–6 slides per group).

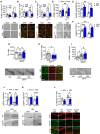
- A, B
(Bottom panels) Representative images of the TUNEL assay and cleaved caspase‐3 immunofluorescence (red: NeuN, green: cleaved caspase‐3) in the striatum of mice injected either with SCR or RB5 peptide (20 mg/kg, i.p., twice a day, 12 h interval) or with saline or 3‐NP (50 mg/kg, i.p., once a day) for seven consecutive days (top panels). Mice co‐treated with RB5 and 3‐NP showed reduced apoptotic levels (A) and diminished cleaved caspase‐3 levels (B). Data were obtained from n = 7–10 mice per group.
- C, D
(Bottom panels) Representative images of cleaved caspase‐3 and pERK immunofluorescence in WT and HdhQ111/+ mice injected with RB5 or SCR (20 mg/kg i.p.) for 8 days (top panels). HdhQ111/+ mice treated with RB5 showed diminished caspase‐3 levels (C) and a greater enhancement of ERK phosphorylation compared to WT (D). Data were obtained from 5 to 9 mice per group.
- E, F
RB5 rescued ERK activation in iPSCs‐derived HD MSNs. HD cells and isogenic controls (CTR) underwent differentiation and were treated with RB5 or SCR 50 μM for 30 min. Cells were processed for immunofluorescence for p‐ERK1/2 and CTIP2 (F) or DARPP‐32 (E). Data were obtained from two HD and two isogenic control lines (n = 5–6 slides per condition). (E) p‐ERK1/2 was upregulated in the presence of RB5 in both HD and control DARPP‐32+ neurons. pERK1/2 levels were reduced in HD neurons, which was rescued by RB5 treatment (F) RB5 induced ERK activation in both control and HD CTIP2+ neurons. p‐ERK1/2 levels were reduced in HD lines but were rescued by RB5 treatment.
- G–I
(Bottom panels) Representative images showing TH, TUNEL, and cleaved caspase‐3 after co‐treatment with MPTP (20 mg/kg i.p.) and RB5 or SCR (20 mg/kg i.p.) for 4 days. RB5 showed a protective effect on DA cells of the SN from MPTP toxicity (G, top panel) and a concomitant decrease of cleaved caspase‐3‐positive cells (H, top panel). MTPT caused an increase in ERK activation in both SCR and RB5‐treated mice in the dorsal striatum (I, top panel) that was further enhanced by RB5 treatment (n = 8–15 mice per group).
- J–L
(Bottom panels) Representative images showing pERK in CA1 and DG and cleaved caspase‐3 in DG of Tg2576 mice treated either with RB5 or SCR (20 mg/kg i.p.) for 7 days. RB5 enhanced ERK phosphorylation in both CA1 (J, top panel) and DG (K, top panel). In addition, RB5 reduced cleaved caspase‐3 levels in Tg2576 mice (L, top panel). Data were obtained from n = 6–9 mice per group.

- A, B
(Bottom panels) Representative images of the TUNEL assay in mice with in vivo striatal knockdown of ERK1 (A) or overexpression of ERK2 and ERK1 > 2 (B). (top panels) TUNEL assay performed after 21 days of sub chronic treatment with 3‐NP (50 mg/kg, i.p. once a day) or saline. shRNA ERK1 protected striatal neurons from 3‐NP‐induced apoptosis (A, top panel). Similarly, ERK2 or ERK1 > 2 overexpression protected against 3‐NP‐induced apoptosis (B, top panel). Data were obtained from n = 4–10 mice per group.
- C
(Bottom panel) Representative images of the TUNEL assay in the striatum of ERK1−/− mice injected either with saline or 3‐NP (50 mg/kg, i.p. once a day) for 21 days. (top panel) ERK1−/− mice were protected against the 3‐NP‐induced striatal neurotoxicity. Data were obtained from n = 9–13 mice per group.
- D
Representative images of pERK1/2 and DARRP‐32 immunofluorescence in HD lines and isogenic controls.
- E
Representative images of pERK1/2 and CTIP‐2 in HD lines and isogenic controls.
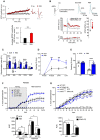
Intracellular dialysis of the RB5 peptide increased evoked synaptic currents at SC‐CA1 synapses, whereas the control peptide (SCR) had no effect. (Top panel) Time course of minute‐average EPSC amplitude at SC‐CA1 synapses in whole‐cell patch clamp recordings with RB5 (50 μM) or SCR peptide (50 μM) – (values normalized to the mean EPSC amplitude during the first minute of recording) (insets). Representative current traces from 3 min (black, 1) and 33 min time points (red, 2). (bottom panel) Average EPSC amplitude at 30–35 min, normalized to the first minute of recording. RB5 (n = 12 cells, four animals), SCR (n = 8 cells, four animals). Scale bars: 40 pA and 50 ms.
(Top left) Schematic representation of electrically stimulated glutamatergic cortical inputs to dSPNs. (Top right) Superimposed averaged recordings (10 traces) before and after the delivery of the HFS protocol. (bottom left) The HFS protocol (vertical bar) failed to induce plasticity in dSPNs when the RB5 peptide (50 μM) was applied intracellularly. The specificity of action of RB5 was confirmed because the control peptide (50 μM) had no effect on plasticity induction. Data are shown as a time course (mean ± s.e.m.) of normalized EPSP amplitudes and normalized Rinp. (bottom right) Scatterplot summary of the ratios of synaptic responses after (a; 20–30 min) and before (b; 5 min) the HFS.
RB5 enhanced NOR memory formation and maintenance for up to 5 days. The Discrimination Index (D.I.) of the RB5 group (20 mg/kg, i.p.) was higher than that of SCR group at 24 h. At 48 h D.I. of the SCR group dropped below chance level, while D.I. of the RB5 group was greatly above it. At 72 h, D.I. of the RB5 group remained higher than the SCR and above chance level. At 120 h, D.I. of RB5 group was still higher than the SCR and above the chance level. By 168 h, D.I. of the RB5 group reached chance level, indistinguishable from that of the SCR group (n = 7–22 mice per group).
RB5 enhanced acquisition of contextual fear memory in rats. Awake rats were infused bilaterally via an indwelling steel cannula aimed at the dorsal CA1 with either 2 mg/ml SCR peptide (n = 6) or RB5 (n = 5) 20 min prior to conditioning. STM and LTM were assessed by measuring the conditioned freezing behavior during a 2 min recall test 3 h and 2 days after training, respectively. RB5 administration had a profound effect on the freezing behavior of the rats. The freezing behavior of RB5 rats was increased compared to SCR rats in the Post US, STM, and LTM tests.
E) RB5 enhanced the acquisition of contextual fear memory in the Tg2576 mouse model of Alzheimer's Disease. 7 ‐month‐old Tg2576 mice and WT mice were treated for 1 h with either SCR (n = 7) or RB5 (20 mg/kg, i.p., n = 8) before contextual fear conditioning and tested for memory retention 24 h later. Contextual fear memory impairment in Tg2576 mice was fully rescued by RB5 treatment.
(Top panel) WT and zQ175 mice underwent daily 20‐min nose poke training for 10 consecutive days (days 1–10) on a simple fixed ratio (FR1) schedule of reinforcement. Starting from day 11, mice received one administration of RB5 (20 mg/kg. i.p.) 1 h before the nose poke training. RB5 treatment improved performance in both WT and zQ175 females. zQ175 RB5 (n = 7) zQ175 SCR (n = 8) WT RB5 (n = 7) WT SCR (n = 8). (Bottom panel) Area under the curve (AUC) analysis.
(top panel) WT and HdhQ111/+ mice injected at 2 months of age with either LV‐GFP or LV‐overexpressing ERK2 (ERK2 OE) underwent nose poke training at 18 months of age. Untreated HdhQ111/+ mice differed from the other three groups and poorly performed in this task, while HdhQ111/+‐treated mice were indistinguishable from the WT controls. Data were obtained from WT GFP (n = 10), WT ERK2 OE (n = 9), HdhQ111/+ GFP (n = 9), and HdhQ111/+ ERK2 OE (n = 8). (bottom panel) AUC analysis over 26 days.
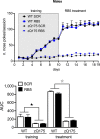

- A–D
After operant conditioning, brains from zQ175 females were processed for histological analysis (WT SCR n = 8, WT RB5 n = 7, zQ175 SCR n = 8, zQ175 RB5 n = 7). (A, bottom panel) RB5 induced ERK activation in both WT and zQ175 mice. (B, bottom panel) DARPP‐32 levels were unchanged in 7‐months old females. (C, bottom panel) Cleaved caspase‐3 levels were normalized by RB5 treatment in zQ175 females. (D, bottom panel) RB5 treatment did not change mutant huntingtin (mHtt) levels in zQ175 females. (A–D, top panels) Representative images. Blue: NeuN (C), DAPI (D). Red: cleaved caspase‐3 (C), mHtt (D).
- E–H
After operant conditioning, brains from HdhQ111/+ mice were processed for histological analysis (WT GFP n = 10, WT ERK2 n = 7, HdhQ111/+ GFP n = 9, HdhQ111/+ ERK2 n = 7). (E, bottom panel) ERK2 overexpression upregulated p‐ERK1/2 in both WT and mutant mice. (F, bottom panel) ERK2 overexpression rescued DARPP‐32 levels in HdhQ111/+ mice (G, bottom panel) Cleaved caspase‐3 levels were reduced by ERK2 overexpression. (H, bottom panel) HdhQ111/+ mice injected with ERK2‐GFP showed reduced levels of mHtt in comparison with HdhQ111/+ mice injected with GFP. (E‐H, top panels) Representative images. Blue: NeuN (G), DAPI (H). Red: cleaved caspase‐3 (G), mHtt (H).
References
-
- Anglada‐Huguet M, Giralt A, Perez‐Navarro E, Alberch J, Xifro X (2012) Activation of Elk‐1 participates as a neuroprotective compensatory mechanism in models of Huntington's disease. J Neurochem 121: 639–648 - PubMed
-
- Apostol BL, Illes K, Pallos J, Bodai L, Wu J, Strand A, Schweitzer ES, Olson JM, Kazantsev A, Marsh JL et al (2006) Mutant huntingtin alters MAPK signaling pathways in PC12 and striatal cells: ERK1/2 protects against mutant huntingtin‐associated toxicity. Hum Mol Genet 15: 273–285 - PubMed
-
- Atkins CM, Selcher JC, Petraitis JJ, Trzaskos JM, Sweatt JD (1998) The MAPK cascade is required for mammalian associative learning. Nat Neurosci 1: 602–609 - PubMed
-
- Bezard E, Gross CE, Qin L, Gurevich VV, Benovic JL, Gurevich EV (2005) L‐DOPA reverses the MPTP‐induced elevation of the arrestin2 and GRK6 expression and enhanced ERK activation in monkey brain. Neurobiol Dis 18: 323–335 - PubMed
Publication types
MeSH terms
Substances
Grants and funding
LinkOut - more resources
Full Text Sources
Molecular Biology Databases
Miscellaneous

