. 2023 Oct 4;25(12 Suppl 2):iv1-iv99.
doi: 10.1093/neuonc/noad149.

CBTRUS Statistical Report: Primary Brain and Other Central Nervous System Tumors Diagnosed in the United States in 2016-2020

Affiliations

CBTRUS Statistical Report: Primary Brain and Other Central Nervous System Tumors Diagnosed in the United States in 2016-2020

Quinn T Ostrom et al. Neuro Oncol. .

Abstract

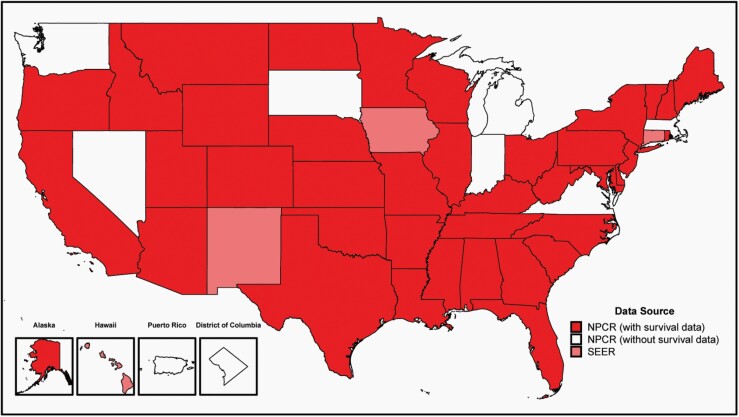
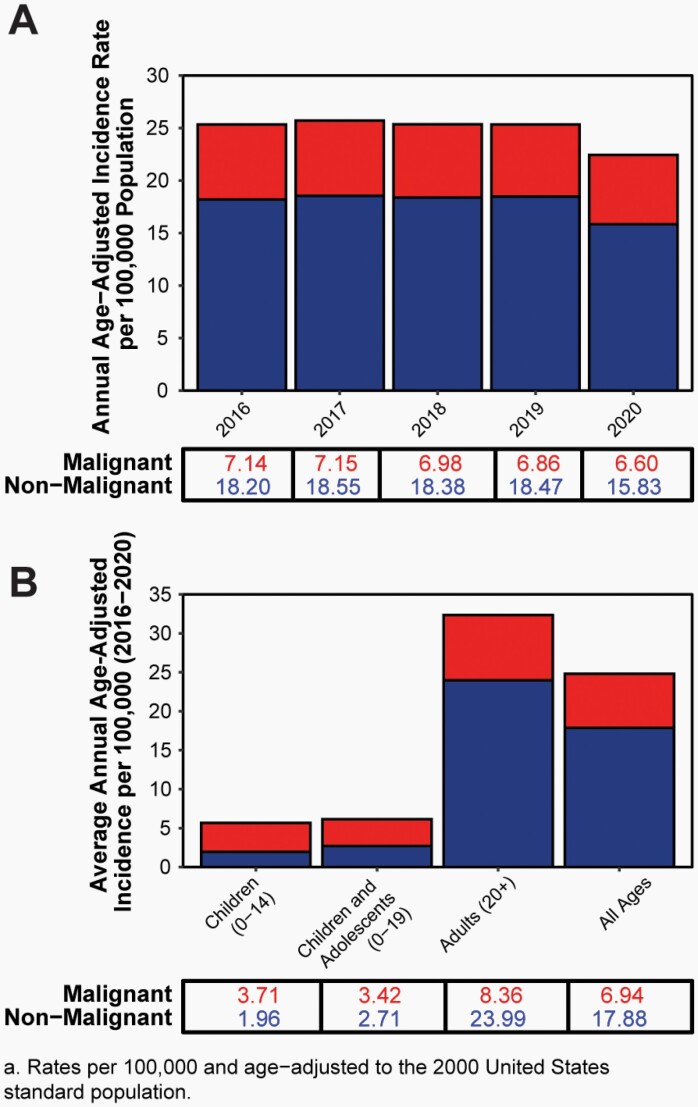
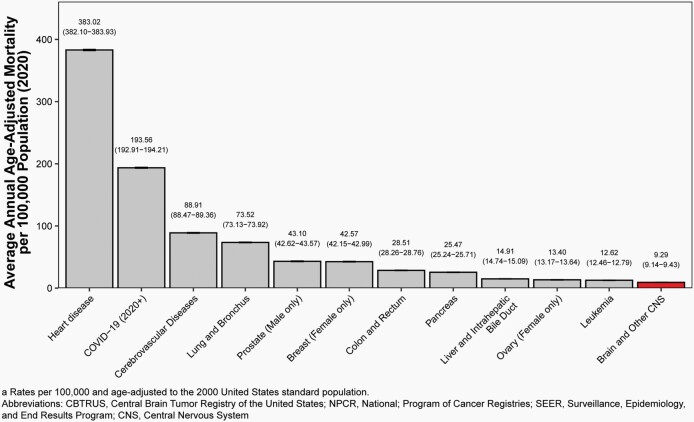
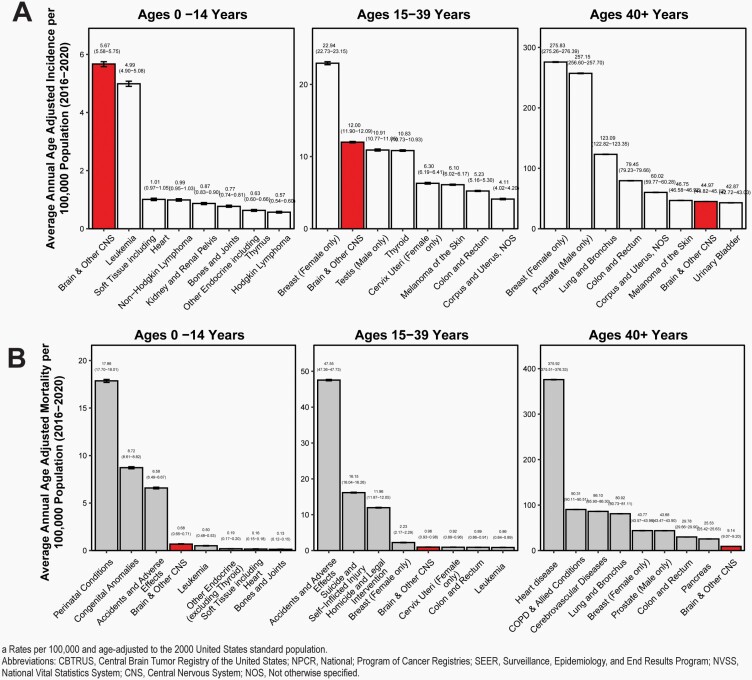
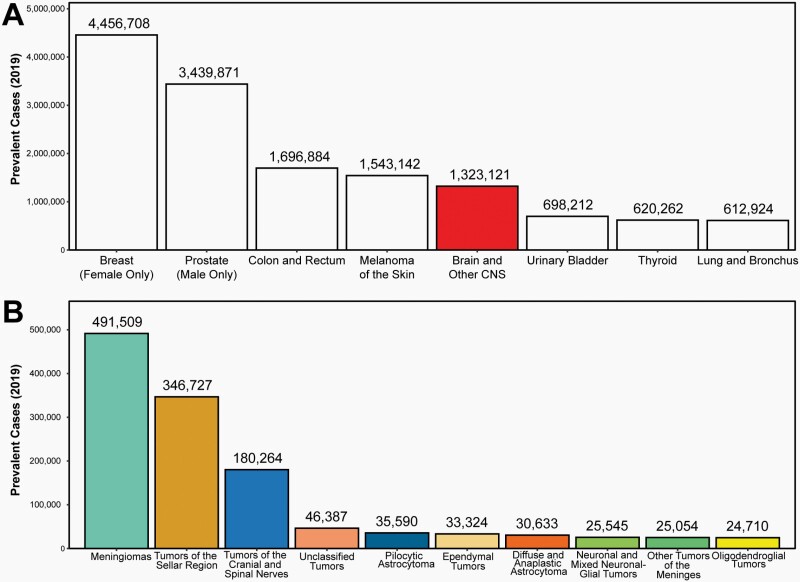
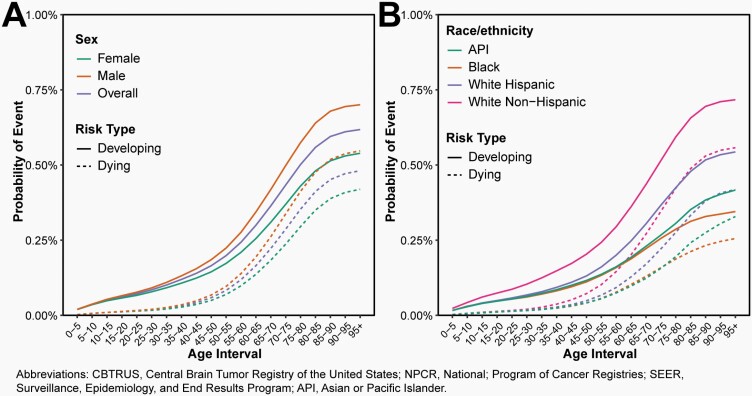
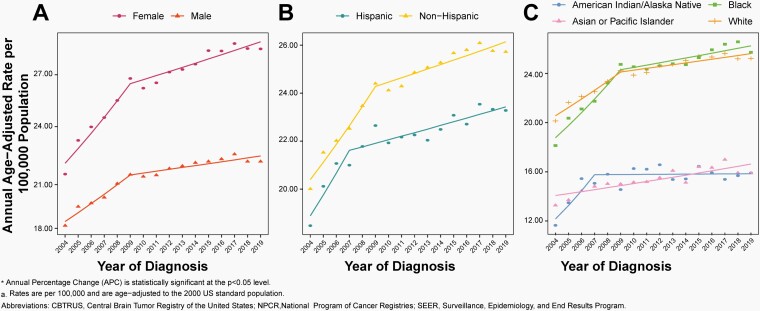
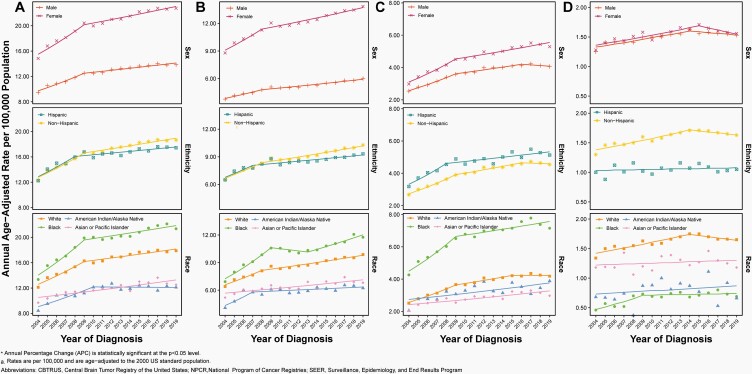
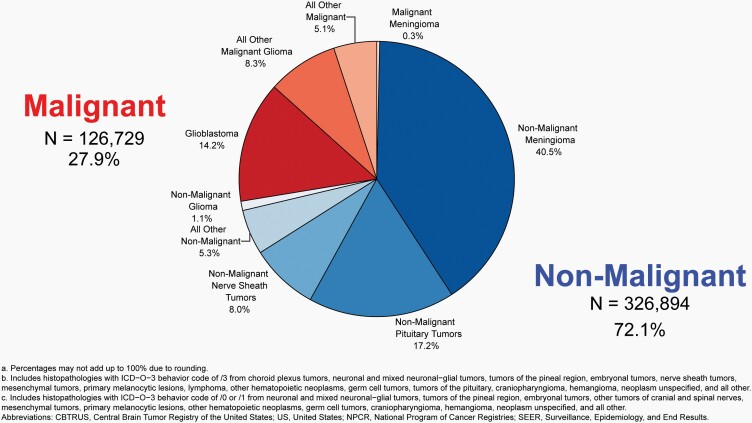
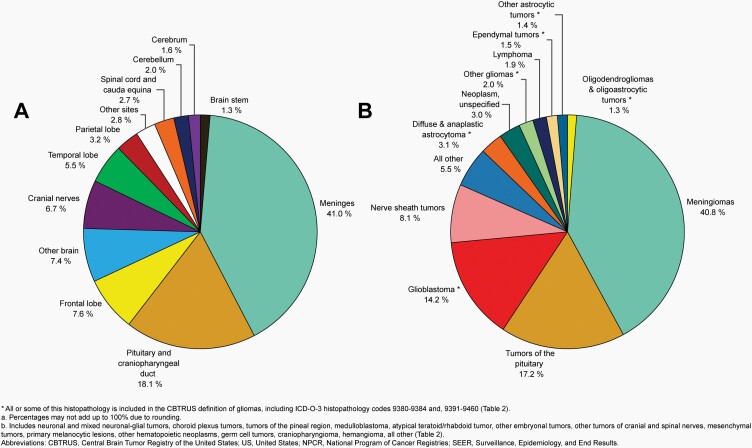
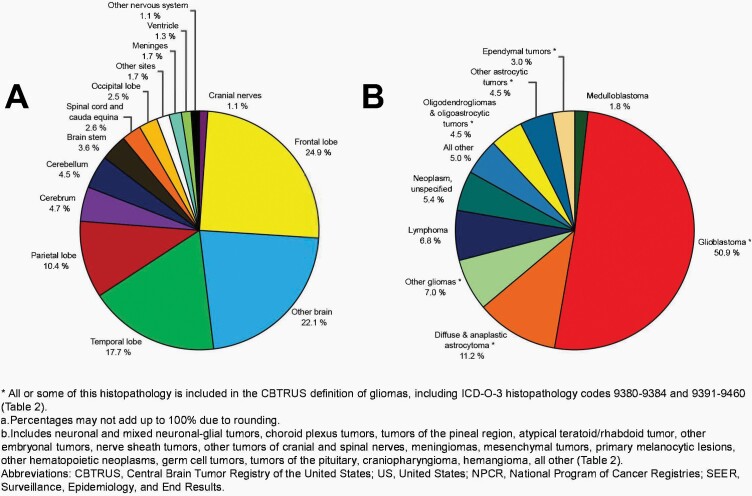
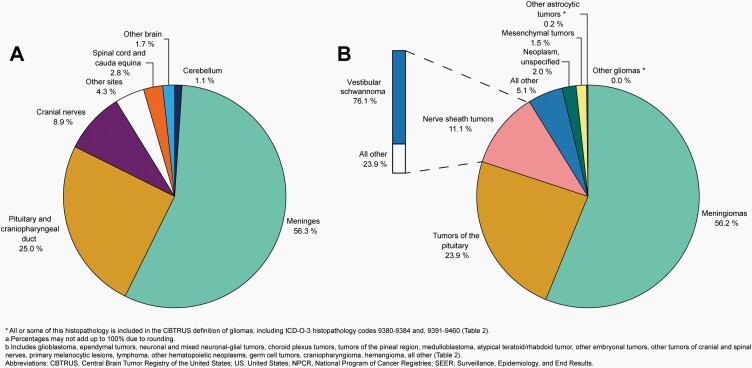
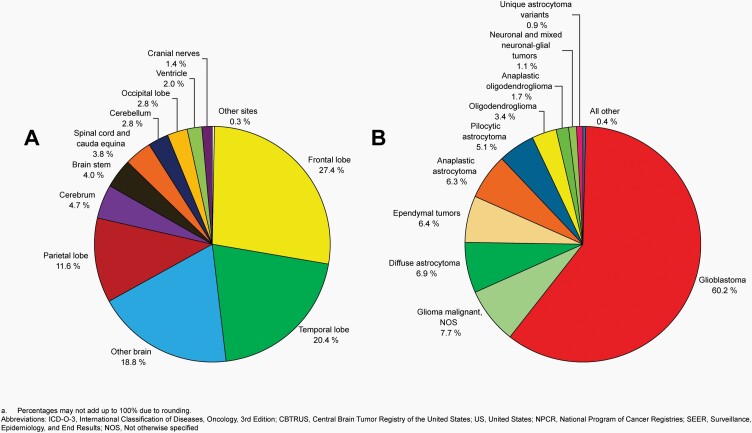
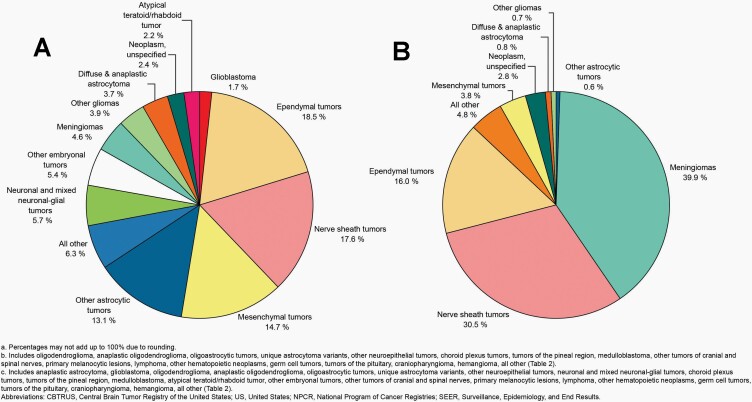
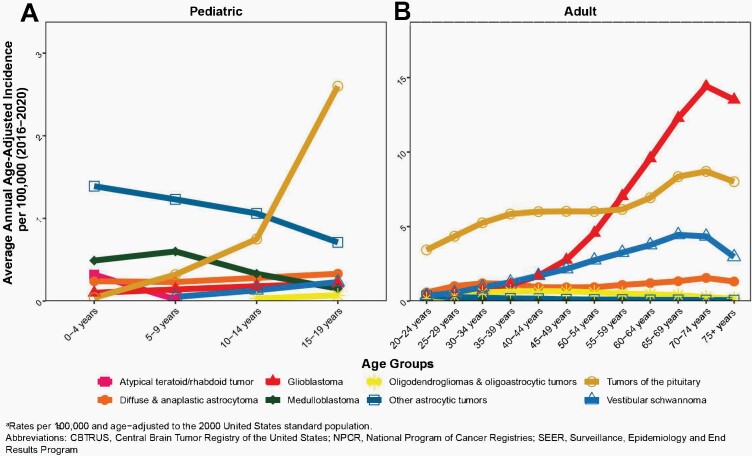
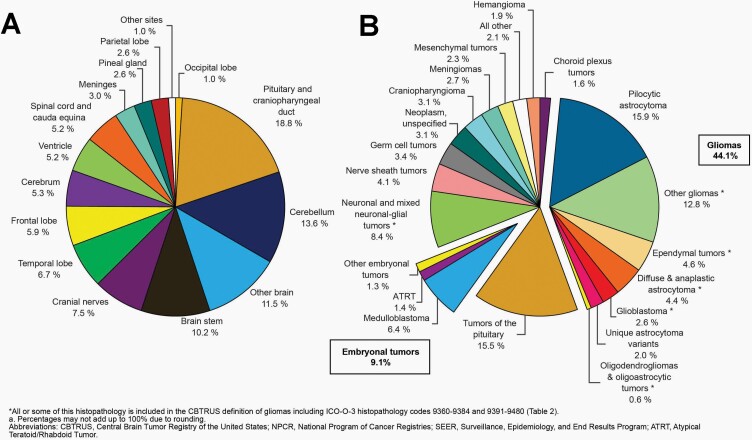
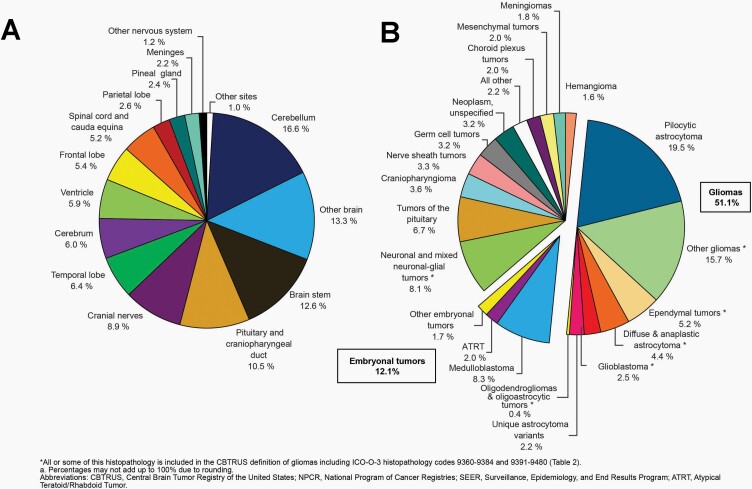
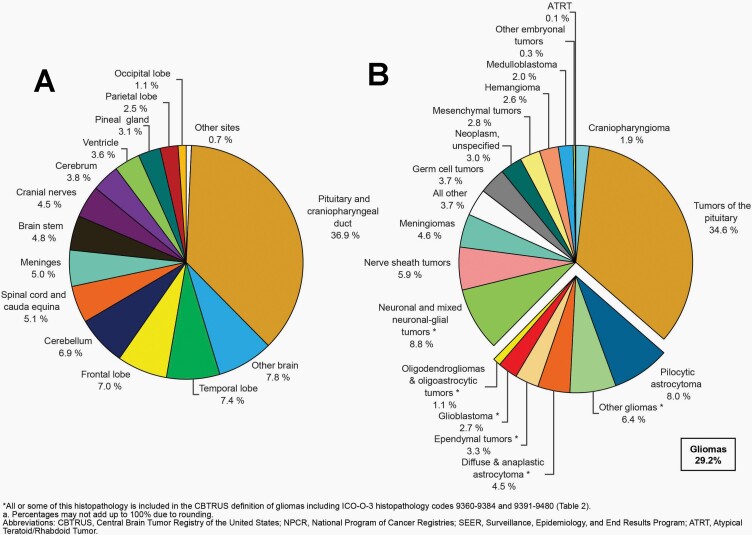
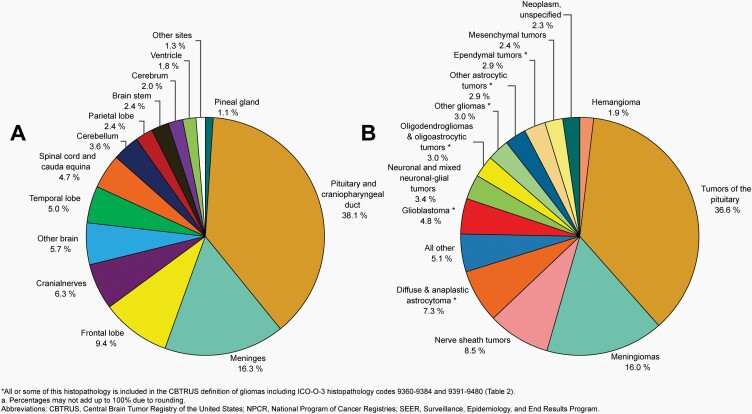
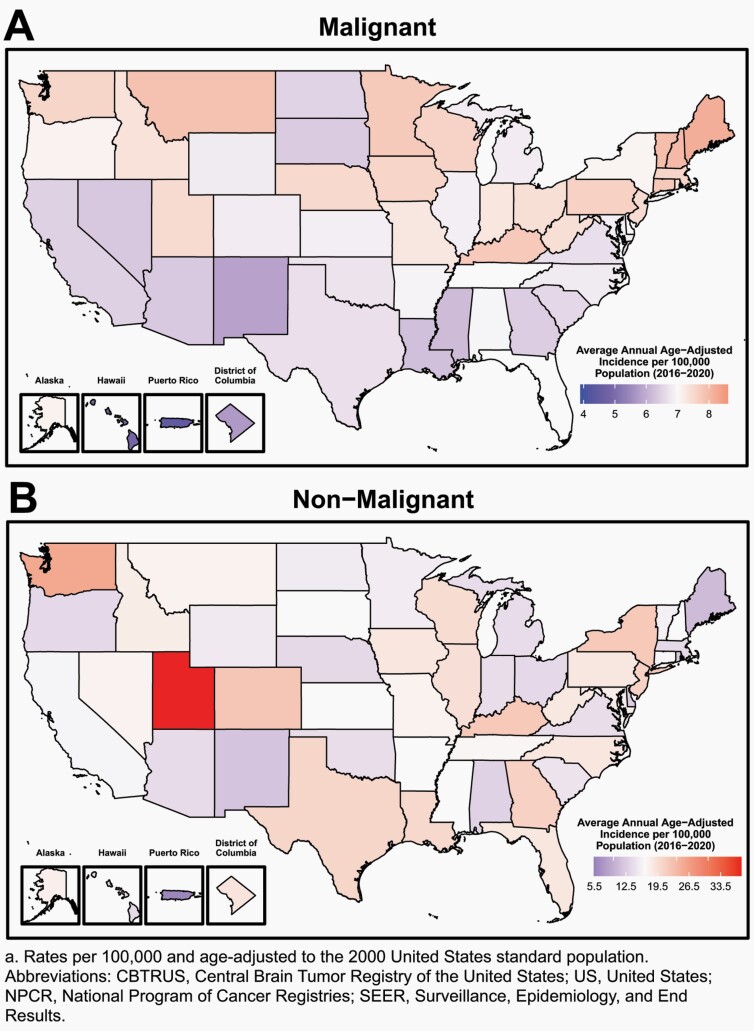
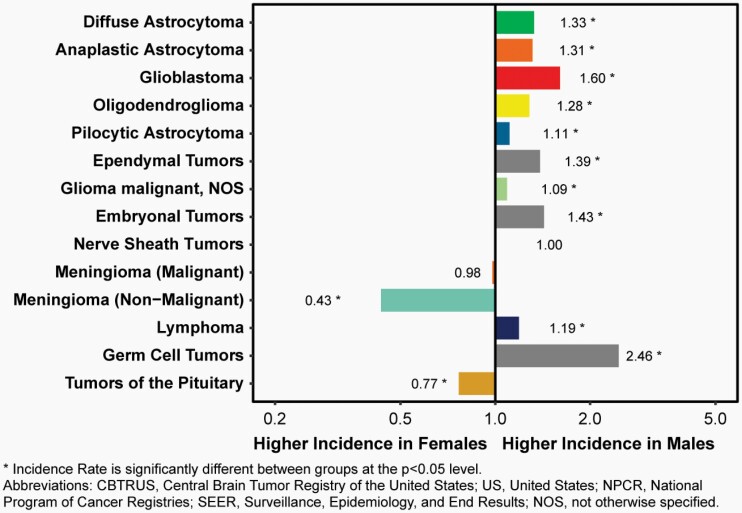
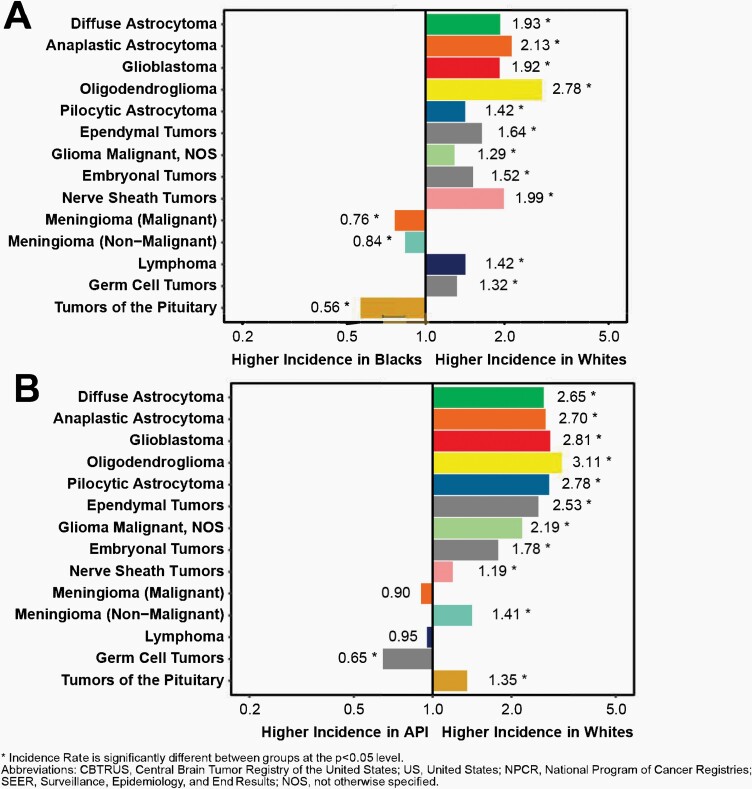
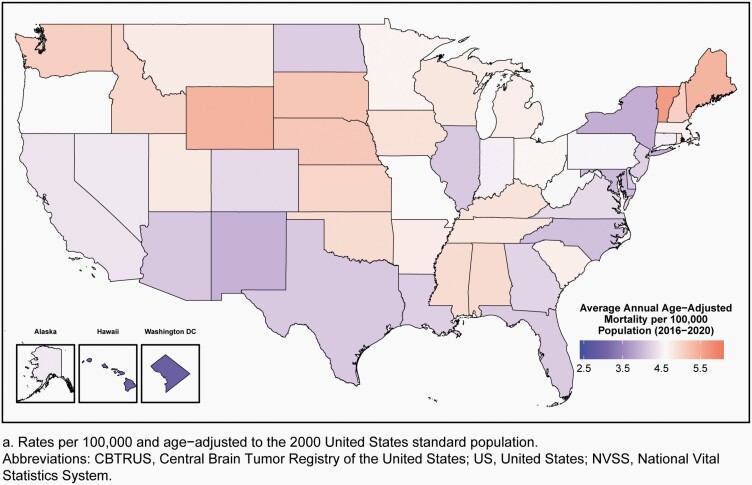
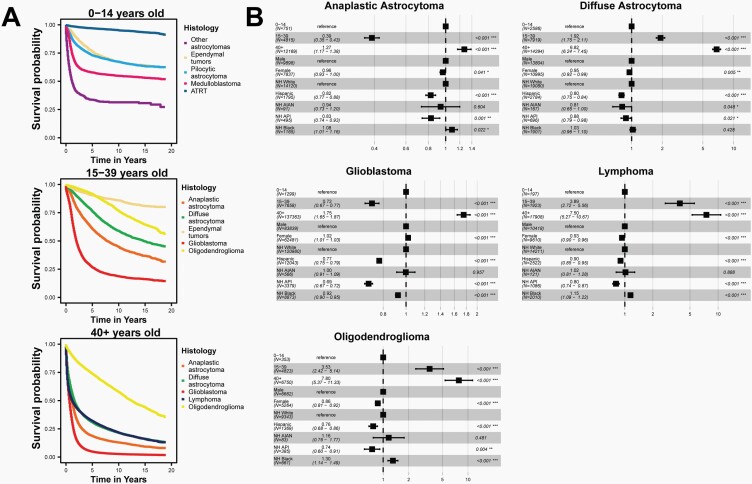
The Central Brain Tumor Registry of the United States (CBTRUS), in collaboration with the Centers for Disease Control and Prevention and the National Cancer Institute, is the largest population-based registry focused exclusively on primary brain and other central nervous system (CNS) tumors in the United States (US) and represents the entire US population. This report contains the most up-to-date population-based data on primary brain tumors available and supersedes all previous CBTRUS reports in terms of completeness and accuracy. All rates are age-adjusted using the 2000 US standard population and presented per 100,000 population. The average annual age-adjusted incidence rate (AAAIR) of all malignant and non-malignant brain and other CNS tumors was 24.83 per 100,000 population (malignant AAAIR=6.94 and non-malignant AAAIR=17.88). This overall rate was higher in females compared to males (27.85 versus 21.62 per 100,000) and non-Hispanic persons compared to Hispanic persons (25.24 versus 22.61 per 100,000). Gliomas accounted for 26.3% of all tumors. The most commonly occurring malignant brain and other CNS histopathology was glioblastoma (14.2% of all tumors and 50.9% of all malignant tumors), and the most common predominantly non-malignant histopathology was meningioma (40.8% of all tumors and 56.2% of all non-malignant tumors). Glioblastomas were more common in males, and meningiomas were more common in females. In children and adolescents (ages 0-19 years), the incidence rate of all primary brain and other CNS tumors was 6.13 per 100,000 population. There were 86,030 deaths attributed to malignant brain and other CNS tumors between 2016 and 2020. This represents an average annual mortality rate of 4.42 per 100,000 population and an average of 17,206 deaths per year. The five-year relative survival rate following diagnosis of a malignant brain and other CNS tumor was 35.7%, for a non-malignant brain and other CNS tumor the five-year relative survival rate was 91.8%.


Figures

Fig. 1
Fig. 1
Availability by Central Cancer Registry for SEER and NPCR Incidence Data (2016-2020) and Survival Data (2001-2019)
Fig. 2
Fig. 2
Overview of CBTRUS Data Edits Workflow, CBTRUS Statistical Report: US Cancer Statistics—NPCR and SEER, 2016-2020
Fig. 3
Fig. 3
A) Annual Age-Adjusted Incidence Ratesa of All Primary Brain and Other Central Nervous System Tumors by Year and Behavior, B) Average Annual Age-Adjusted Incidence Rates of All Primary Brain and Other Central Nervous System Tumors by Age Group at Diagnosis and Behavior, CBTRUS Statistical Report: US Cancer Statistics—NPCR and SEER, 2016-2020
Fig. 4
Fig. 4
Annual Delay- and Age-Adjusted Incidence Rates per 100,000 and Percent Change from 2019 to 2020 by Cancer Site, CBTRUS Statistical Report: SEER 2019-2020
Fig. 5
Fig. 5
Age-Adjusted Mortality Ratesa with 95% Confidence Intervals of All Primary Brain and Other Central Nervous System Tumors in Comparison to the Top Eight Causes of Cancer Death and Top Three Non-Cancer Causes of Death (COD) for Older Adults Ages 40+ Years, CBTRUS Statistical Report: US Cancer Statistics—NPCR and SEER, 2020
Fig. 6
Fig. 6
A) Average Annual Age-Adjusted Incidence Ratesa with 95% Confidence Intervals of All Primary Brain and Other Central Nervous System Tumors in Comparison to the Top Eight Highest Incidence Cancers and B) Average Annual Age-Adjusted Mortality with 95% Confidence Intervals of All Primary Brain and Other Central Nervous System Tumors in Comparison to the Top Five Causes of Cancer Death and Top Three Non-Cancer Causes of Death for Children Ages 0-14 Years, Adolescents and Young Adults Ages 15-39 Years, and Older Adults Ages 40+ Years, CBTRUS Statistical Report: US Cancer Statistics—NPCR and SEER, 2016-2020; and NVSS, 2016-2020
Fig. 7
Fig. 7
Estimated Prevalent Cases in the United States in 2019 for A) the Seven Most Prevalent Cancers B) by the Ten Most Prevalent Brain and Other Central Nervous System Histopathologies, CBTRUS Statistical Report: US Cancer Statistics—NPCR and SEER, 1975-2019 (varying)
Fig. 8
Fig. 8
Lifetime Risk of Developing or Dying of a Primary Malignant Brain and Other Central Nervous System Tumor by Five-Year Age Group A) Overall and by Sex and by B) Race and Ethnicity, CBTRUS Statistical Report: US Cancer Statistics—SEER, 2016-2018
Fig. 9
Fig. 9
A) Completeness of the Brain Molecular Marker Variablea by Year of Diagnosis and B) Proportion of Individuals with Incomplete Data and Annual Percent Change in Incompleteness, for Selected Histopathologies by ICD-O-3 Code, CBTRUS Statistical Report: US Cancer Statistics—NPCR and SEER, 2018-2020
Fig. 10
Fig. 10
Frequency of IDH Mutationsa by WHO Grade for Selected Astrocytoma Histopathologiesb, CBTRUS Statistical Report: US Cancer Statistics—NPCR and SEER, 2018-2020
Fig. 11
Fig. 11
Annual Age-Adjusted Incidence Ratesa of All Primary Malignant and Non-Malignantb Brain and Other Central Nervous System Tumors and Incidence Trends by A) Sex, B) Ethnicity, and C) Race, CBTRUS Statistical Report: US Cancer Statistics - NPCR and SEER, 2004-2019
Fig. 12
Fig. 12
Annual Age-Adjusted Incidence Ratesa of Malignant Primary Brain and Other Central Nervous System Tumors and Incidence Trends by Sex, Ethnicity, and Race A) Overall and Among Selected Malignant Histopathologies; B) Glioblastoma and C) Primary CNS, Lymphoma, CBTRUS Statistical Report: US Cancer Statistics—NPCR and SEER, 2000-2019
Fig. 13
Fig. 13
Annual Age-Adjusted Incidence Ratesa of Non-Malignant Primary Brain and Other Central Nervous System Tumors and Incidence Trends by Sex, Ethnicity, and Race A) Overall and Among Selected Non-Malignant Histopathologies; B) Meningioma, C) Tumors of the Pituitary, and D) Vestibular Schwannoma, CBTRUS Statistical Report: US Cancer Statistics—NPCR and SEER, 2004-2019
Fig. 14
Fig. 14
Distributiona of Primary Brain and Other Central Nervous System Tumors by Behavior (Five-Year Total=453,623; Annual Average Cases=90,725), CBTRUS Statistical Report: US Cancer Statistics—NPCR and SEER, 2016-2020
Fig. 15
Fig. 15
Distributiona of All Primary Brain and Other Central Nervous System Tumors (Malignant and Non-Malignant Combined; Five-Year Total=453,623; Annual Average Cases=90,725), by A) Site and B) Histopathology, CBTRUS Statistical Report: US Cancer Statistics—NPCR and SEER, 2016-2020
Fig. 16
Fig. 16
Distributiona of Malignant Primary Brain and Other Central Nervous System Tumors (Five-Year Total=126,729; Annual Average Cases=25,346), by A) Site and B) Histopathology, CBTRUS Statistical Report: US Cancer Statistics—NPCR and SEER, 2016-2020
Fig. 17
Fig. 17
Distributiona of All Non-Malignant Primary Brain and Other Central Nervous System Tumors (Five-Year Total=326,894; Annual Average Cases=65,379), by A) Site and B) Histopathology, CBTRUS Statistical Report: US Cancer Statistics—NPCR and SEER, 2016-2020
Fig. 18
Fig. 18
Distributiona of Primary Brain and Other Central Nervous System Gliomas (ICD-O-3 histopathology codes 9380-9384 and 9391-9460) (Five-Year Total=107,201; Annual Average Cases=21,440) by A) Site and B) Histopathology Subtypes, CBTRUS Statistical Report: US Cancer Statistics—NPCR and SEER, 2016-2020
Fig. 19
Fig. 19
Distributiona of Primary Spinal Cord, Spinal Meninges, and Cauda Equina Tumors by Histopathology in A) Children and Adolescents (Ages 0-19 Years, Five-Year Total=1,392; Annual Average Cases=278) and B) Adults (Ages 20+ Years, Five-Year Total=18,718; Annual Average Cases=3,744), CBTRUS Statistical Report: US Cancer Statistics - NPCR and SEER, 2016-2020
Fig. 20
Fig. 20
Average Annual Age-Adjusted Incidence Ratesa of Brain and Other Central Nervous System Tumors by Selected Histopathologies and Age Group at Diagnosis A) Ages 0-19 Years and B) Ages 20+ Years, CBTRUS Statistical Report: US Cancer Statistics—NPCR and SEER, 2016-2020
Fig. 21
Fig. 21
Distributiona in Children and Adolescents (Ages 0-19 Years) of Primary Brain and Other Central Nervous System Tumors (Five-Year Total=24,999; Annual Average Cases=5,000) by A) Site and B) Histopathology Subtypes, CBTRUS Statistical Report: US Cancer Statistics—NPCR and SEER, 2016-2020
Fig. 22
Fig. 22
Distributiona in Children and Adolescents (Ages 0-14 Years) of Primary Brain and Central Nervous System Tumors (Five-Year Total=17,136; Annual Average Cases=3,427) by A) Site and B) Histopathology Subtypes, CBTRUS Statistical Report: US Cancer Statistics - NPCR and SEER, 2016-2020
Fig. 23
Fig. 23
Distributiona in Children and Adolescents (Ages 15-19 Years) of Primary Brain and Central Nervous System Tumors (Five-Year Total=7,863; Annual Average Cases=1,573) by A) Site and B) Histopathology Subtypes, CBTRUS Statistical Report: US Cancer Statistics—NPCR and SEER, 2016-2020
Fig. 24
Fig. 24
Distributiona in Adolescents and Young Adults (Ages 15-39 Years) of Primary Brain and Other Central Nervous System Tumors (Five-Year Total=64,238; Annual Average Cases=12,848) by A) Site and B) Histopathology Subtypes, CBTRUS Statistical Report: US Cancer Statistics—NPCR and SEER, 2016-2020
Fig. 25
Fig. 25
Average Annual Age-Adjusted Incidence Ratesa of A) Malignant and B) Non-Malignant Primary Brain and Other Central Nervous System Tumors by Central Cancer Registry, CBTRUS Statistical Report: US Cancer Statistics—NPCR and SEER, 2016-2020
Fig. 26
Fig. 26
Incidence Rate Ratios by Sex (Males:Females) for Selected Primary Brain and Other Central Nervous System Tumor Histopathologies, CBTRUS Statistical Report: US Cancer Statistics—NPCR and SEER, 2016-2020
Fig. 27
Fig. 27
Incidence Rate Ratios by Race (White:Black and White:Asian Or Pacific Islander [API]) for Selected Primary Brain and Other Central Nervous System Tumor Histopathologies, CBTRUS Statistical Report: US Cancer Statistics—NPCR and SEER, 2016-2020
Fig. 28
Fig. 28
Average Annual Age-Adjusted Mortality Ratesa for Malignant Primary Brain and Other Central Nervous System Tumors by Central Cancer Registry, CBTRUS Statistical Report: NVSS, 2016-2020
Fig. 29
Fig. 29
A) Kaplan-Meier Survival Curves for the Five Most Common Histopathologies within Age Group at Diagnosis (Ages 0-14, 15-39 and 40+ Years) and B) Hazard Ratios and 95% Confidence Intervals for Sex, Age at Diagnosis, Race, and Ethnicity for the Five Most Common Histopathologies Overall, National Data provided by CDC’s NPCR, 2001-2019

References

    1. Kruchko C, Ostrom QT, Gittleman H, Barnholtz-Sloan JS.. The CBTRUS story: providing accurate population-based statistics on brain and other central nervous system tumors for everyone. Neuro Oncol. 2018; 20(3):295-298. - PMC - PubMed
    1. Louis DN OH, Wiestler OD, Cavanee WK, ed WHO Classification of Tumours of the Central Nervous System. Lyon, France: International Agency for Research on Cancer; 2016.
    1. Waite KA, Cioffi G, Kruchko C, et al. . Aligning the Central Brain Tumor Registry of the United States (CBTRUS) histology groupings with current definitions. Neurooncol. Pract. 2022; 9(4):317-327. - PMC - PubMed
    1. Centers for Disease Control and Prevention (CDC). National Program of Cancer Registries Cancer Surveillance System Rationale and Approach.1999; http://www.cdc.gov/cancer/npcr/pdf/npcr_css.pdf. Accessed July 21, 2020.
    1. Cancer Registries Amendment Act, 102nd Cong. § 515 (1992). https://www.govinfo.gov/content/pkg/STATUTE-106/pdf/STATUTE-106-Pg3372.pdf. Accessed July 21, 2020.

Publication types