

Head-to-head comparison of BAM15, semaglutide, rosiglitazone, NEN, and calorie restriction on metabolic physiology in female db/db mice
- PMID: 37793464
- PMCID: PMC10908303
- DOI: 10.1016/j.bbadis.2023.166908
Head-to-head comparison of BAM15, semaglutide, rosiglitazone, NEN, and calorie restriction on metabolic physiology in female db/db mice
Abstract
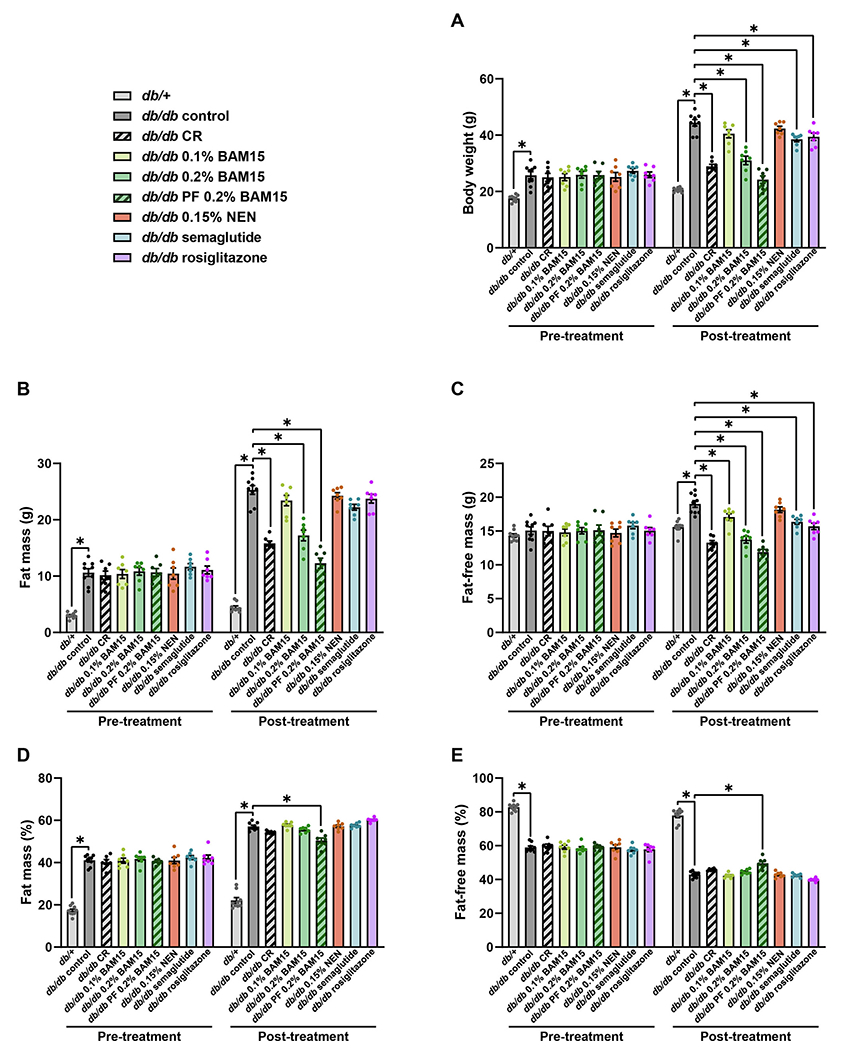
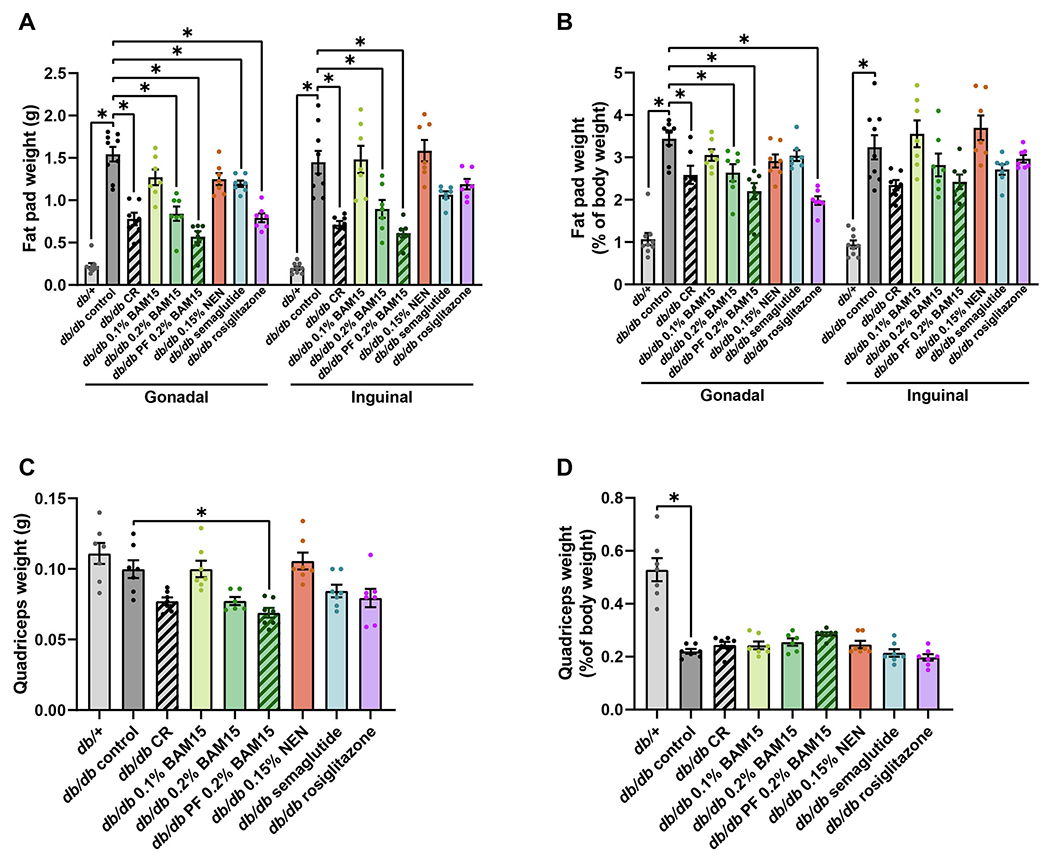
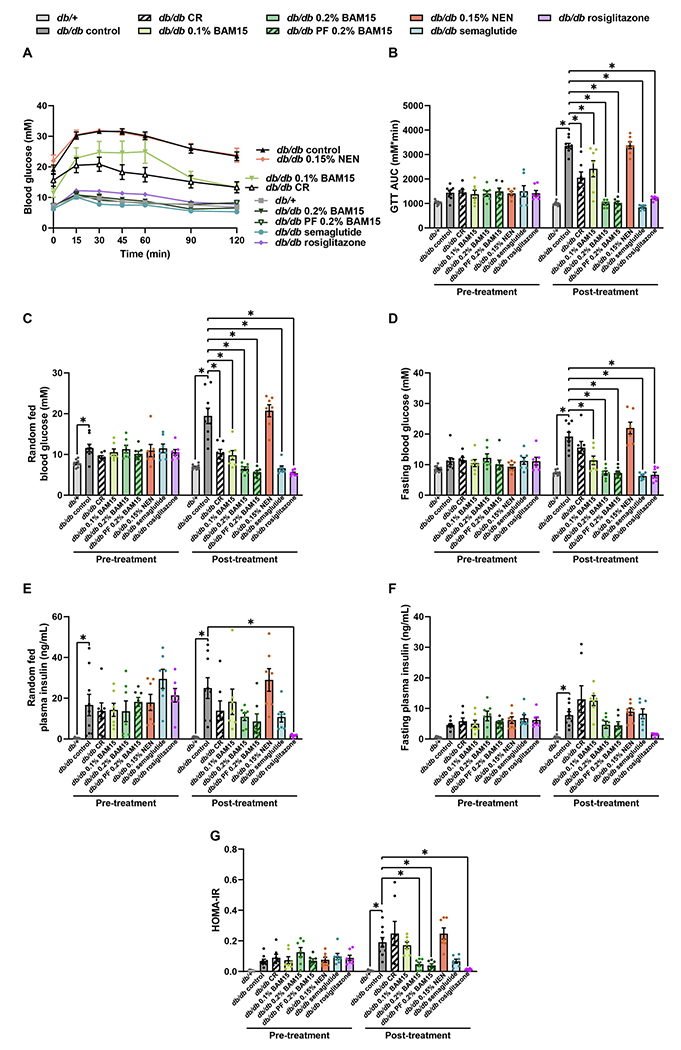
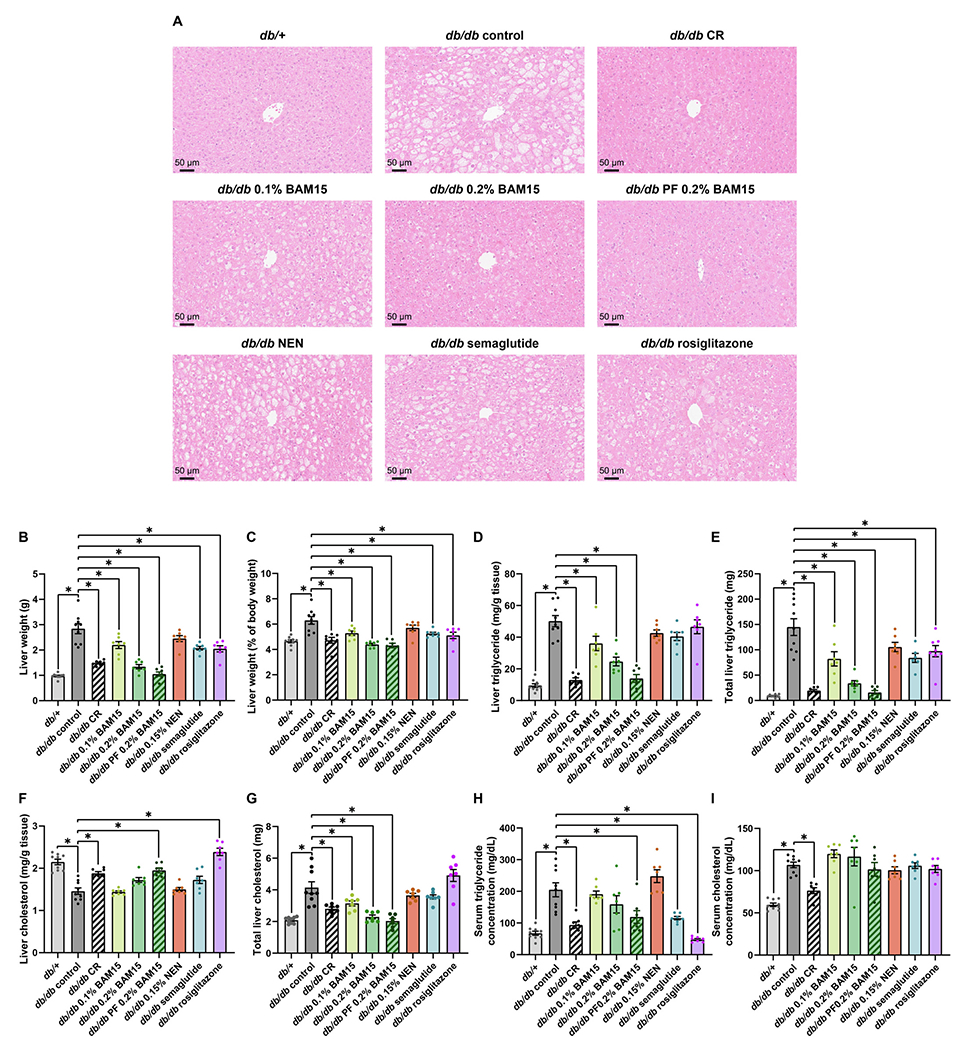
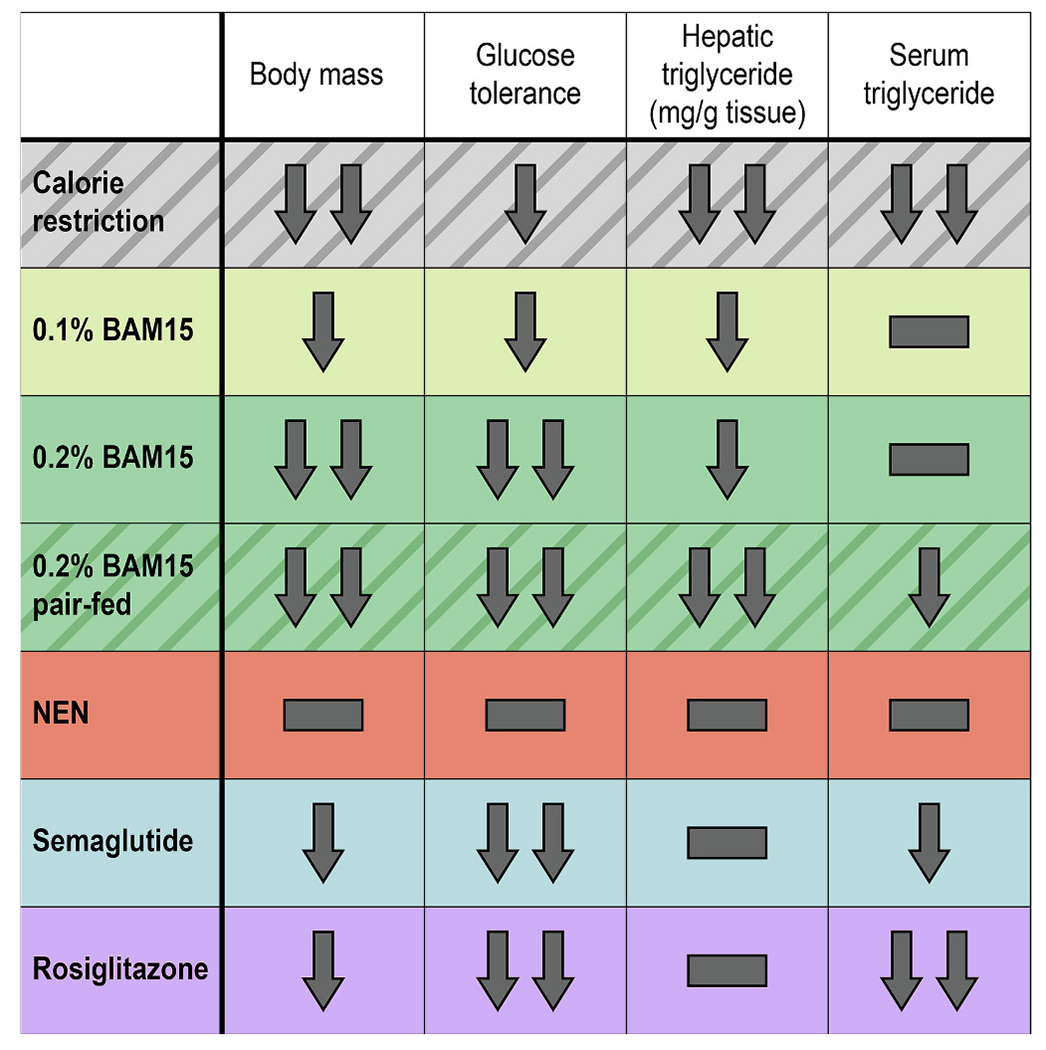
Metabolic disorders such as type 2 diabetes, fatty liver disease, hyperlipidemia, and obesity commonly co-occur but clinical treatment options do not effectively target all disorders. Calorie restriction, semaglutide, rosiglitazone, and mitochondrial uncouplers have all demonstrated efficacy against one or more obesity-related metabolic disorders, but it currently remains unclear which therapeutic strategy best targets the combination of hyperglycaemia, liver fat, hypertriglyceridemia, and adiposity. Herein we performed a head-to-head comparison of 5 treatment interventions in the female db/db mouse model of severe metabolic disease. Treatments included ∼60 % calorie restriction (CR), semaglutide, rosiglitazone, BAM15, and niclosamide ethanolamine (NEN). Results showed that BAM15 and CR improved body weight and liver steatosis to levels superior to semaglutide, NEN, and rosiglitazone, while BAM15, semaglutide, and rosiglitazone improved glucose tolerance better than CR and NEN. BAM15, CR, semaglutide, and rosiglitazone all had efficacy against hypertriglyceridaemia. These data provide a comprehensive head-to-head comparison of several key treatment strategies for metabolic disease and highlight the efficacy of mitochondrial uncoupling to correct multiple facets of the metabolic disease milieu in female db/db mice.
Keywords: Calorie restriction; Diabetes; GLP-1; Mitochondrial uncoupling; Obesity.
Copyright © 2023 The Authors. Published by Elsevier B.V. All rights reserved.
Conflict of interest statement
Declaration of competing interest The authors declare the following financial interests/personal relationships which may be considered as potential competing interests: Kyle Hoehn reports financial support was provided by National Institutes of Health and National Health and Medical Research Council. Kyle Hoehn reports a relationship with Uncoupler Therapeutics, Inc. that includes: board membership and equity or stocks. Kyle Hoehn reports a relationship with Life Biosciences, Inc. that includes: equity or stocks. Kyle Hoehn has a patent via University of Virginia. Webster Santos reports financial support was provided by National Institutes of Health. Webster Santos reports a relationship with Uncoupler Therapeutics, Inc. that includes: board membership and equity or stocks. Webster Santos reports a relationship with Life Biosciences, Inc. that includes: equity or stocks.
Figures
References
-
- Silva M, Diniz LM, Santos J, Reis EA, Mata ARD, Araójo VE, et al. Drug utilization and factors associated with polypharmacy in individuals with diabetes mellitus in Minas Gerais, Brazil, Cien Saude Colet. 23 (2018) 2565–2574. - PubMed
-
- Novo Nordisk, Ozempic® (Semaglutide) Approved in the US, Bagsvaerd, Denmark, Novo Nordisk, 2017.
-
- Wilding JPH, Batterham RL, Calanna S, Davies M, Van Gaal LF, Lingvay I, et al. Once-weekly semaglutide in adults with overweight or obesity, N. Engl. J. Med 384 (2021) 989–1002. - PubMed
Publication types
MeSH terms
Substances
Grants and funding
LinkOut - more resources
Full Text Sources
Medical
Miscellaneous
