

Interactive effects of ambient fine particulate matter and ozone on daily mortality in 372 cities: two stage time series analysis
- PMID: 37793695
- PMCID: PMC10548261
- DOI: 10.1136/bmj-2023-075203
Interactive effects of ambient fine particulate matter and ozone on daily mortality in 372 cities: two stage time series analysis
Abstract
Objective: To investigate potential interactive effects of fine particulate matter (PM2.5) and ozone (O3) on daily mortality at global level.
Design: Two stage time series analysis.
Setting: 372 cities across 19 countries and regions.
Population: Daily counts of deaths from all causes, cardiovascular disease, and respiratory disease.
Main outcome measure: Daily mortality data during 1994-2020. Stratified analyses by co-pollutant exposures and synergy index (>1 denotes the combined effect of pollutants is greater than individual effects) were applied to explore the interaction between PM2.5 and O3 in association with mortality.
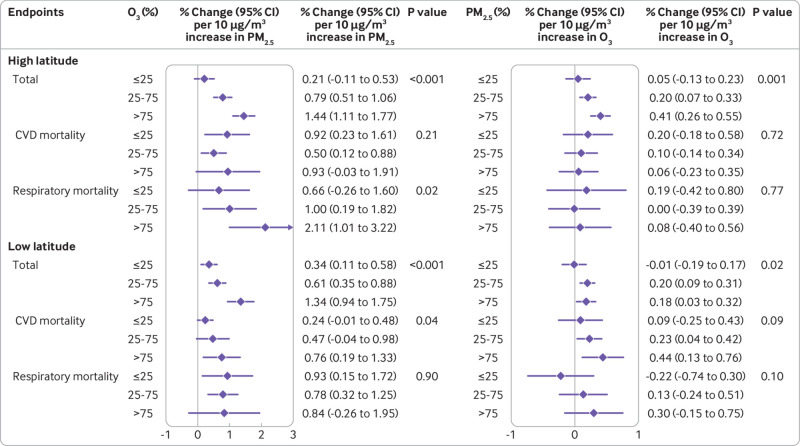
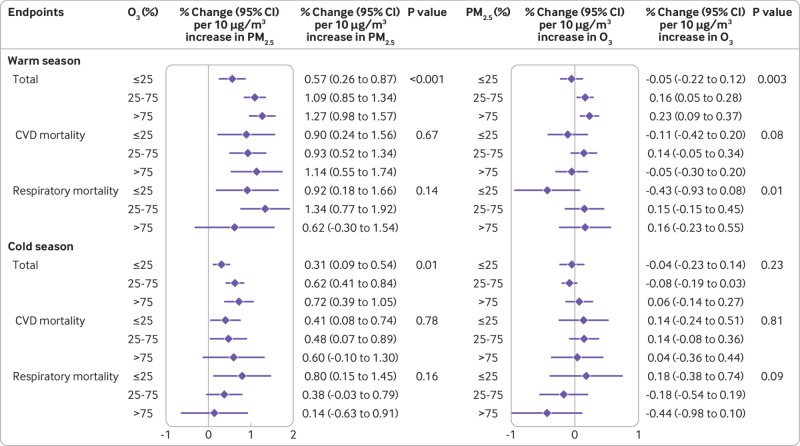
Results: During the study period across the 372 cities, 19.3 million deaths were attributable to all causes, 5.3 million to cardiovascular disease, and 1.9 million to respiratory disease. The risk of total mortality for a 10 μg/m3 increment in PM2.5 (lag 0-1 days) ranged from 0.47% (95% confidence interval 0.26% to 0.67%) to 1.25% (1.02% to 1.48%) from the lowest to highest fourths of O3 concentration; and for a 10 μg/m3 increase in O3 ranged from 0.04% (-0.09% to 0.16%) to 0.29% (0.18% to 0.39%) from the lowest to highest fourths of PM2.5 concentration, with significant differences between strata (P for interaction <0.001). A significant synergistic interaction was also identified between PM2.5 and O3 for total mortality, with a synergy index of 1.93 (95% confidence interval 1.47 to 3.34). Subgroup analyses showed that interactions between PM2.5 and O3 on all three mortality endpoints were more prominent in high latitude regions and during cold seasons.
Conclusion: The findings of this study suggest a synergistic effect of PM2.5 and O3 on total, cardiovascular, and respiratory mortality, indicating the benefit of coordinated control strategies for both pollutants.
© Author(s) (or their employer(s)) 2019. Re-use permitted under CC BY-NC. No commercial re-use. See rights and permissions. Published by BMJ.
Conflict of interest statement
Competing interests: All authors have completed the ICMJE uniform disclosure form at URL www.icmje.org/disclosure-of-interest/ and declare: support from the National Natural Science Foundation of China and the Italian Ministry of University and Research; no financial relationships with any organizations that might have an interest in the submitted work in the previous three years; no other relationships or activities that could appear to have influenced the submitted work.
Figures
Comment in
-
Protecting populations from the health harms of air pollution.BMJ. 2023 Oct 4;383:2020. doi: 10.1136/bmj.p2020. BMJ. 2023. PMID: 37793680 No abstract available.
References
-
- GBD 2017 Causes of Death Collaborators . Global, regional, and national age-sex-specific mortality for 282 causes of death in 195 countries and territories, 1980-2017: a systematic analysis for the Global Burden of Disease Study 2017. Lancet 2018;392:1736-88. 10.1016/S0140-6736(18)32203-7. - DOI - PMC - PubMed