. 2023 Oct 4;14(1):6185.
doi: 10.1038/s41467-023-41927-x.

TET2 lesions enhance the aggressiveness of CEBPA-mutant acute myeloid leukemia by rebalancing GATA2 expression

Affiliations

TET2 lesions enhance the aggressiveness of CEBPA-mutant acute myeloid leukemia by rebalancing GATA2 expression

Elizabeth Heyes et al. Nat Commun. .

Abstract

The myeloid transcription factor CEBPA is recurrently biallelically mutated (i.e., double mutated; CEBPADM) in acute myeloid leukemia (AML) with a combination of hypermorphic N-terminal mutations (CEBPANT), promoting expression of the leukemia-associated p30 isoform, and amorphic C-terminal mutations. The most frequently co-mutated genes in CEBPADM AML are GATA2 and TET2, however the molecular mechanisms underlying this co-mutational spectrum are incomplete. By combining transcriptomic and epigenomic analyses of CEBPA-TET2 co-mutated patients with models thereof, we identify GATA2 as a conserved target of the CEBPA-TET2 mutational axis, providing a rationale for the mutational spectra in CEBPADM AML. Elevated CEBPA levels, driven by CEBPANT, mediate recruitment of TET2 to the Gata2 distal hematopoietic enhancer thereby increasing Gata2 expression. Concurrent loss of TET2 in CEBPADM AML induces a competitive advantage by increasing Gata2 promoter methylation, thereby rebalancing GATA2 levels. Of clinical relevance, demethylating treatment of Cebpa-Tet2 co-mutated AML restores Gata2 levels and prolongs disease latency.


Conflict of interest statement

The authors declare no competing interests.

Figures
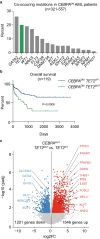
Fig. 1
Fig. 1. TET2 mutations impair outcome for patients with CEBPA-mutant AML.
a Frequency of co-occurring mutations in CEBPADM AML cases, data aggregated from published cohorts–, (321–557 cases; detailed in Supplemental Table 1). b Overall survival of CEBPADM patients with wild-type (TET2WT; 84 patients) or mutated TET2 (TET2MUT; 35 patients). The data were analyzed by Mantel-Cox Log-rank test. c Volcano plot depicting differentially expressed genes dependent on TET2 mutational status in the cohort of CEBPA-mutant patients in the Beat AML dataset (TET2WT 11 and TET2MUT 5 patients). Differential analysis was performed with DESeq2 (P < 0.05). Source data are provided as a Source Data file.
Fig. 2
Fig. 2. TET2 deficiency accelerates Cebpa-mutant AML.
a Schematic representation of generation of Tet2-knockout clones with CRISPR/Cas9. The illustration was created with BioRender.com. b Proliferative outgrowth of Cebpap30/p30 cells with Tet2 indels. c Volcano plot depicting differentially expressed genes dependent on the Tet2 mutational status in Cebpap30/p30 cells (Tet2WT 7 and Tet2MUT 5 clones). Differential analysis was performed with DESeq2 (P < 0.05). d Experimental setup for evaluating the effect of Tet2-deficiency (Tet2Δ/Δ) in CebpaDM AML initiation in vivo. The illustration was created with BioRender.com. e Myeloid (Mac1+) contribution of donor-derived blood and bone marrow (BM) cells evaluated after BM transplantation and Cre-LoxP recombination. (Blood samples: Week 12; 6 mice per group. Week 24; CebpaΔ/p30Tet2+/+ and Cebpa+/ΔTet2Δ/Δ 6 mice per group and Cebpa+/ΔTet2Δ/Δ 3 mice. Week 36; 3 mice per group. BM samples: 3 mice per group.) Data are presented as mean±SEM and analyzed by one-way-ANOVA followed by Dunnett’s multiple comparisons correction. f Survival of lethally irradiated recipient mice after BM transplantation and Cre-LoxP recombination (CebpaΔ/p30Tet2+/+ 12 mice, CebpaΔ/p30Tet2Δ/Δ 14 mice, and Cebpa+/-Tet2Δ/Δ 14 mice). The data were analyzed by Mantel-Cox Log-rank test. g Volcano plot depicting differentially expressed genes dependent on Tet2 deficiency status in CebpaΔ/p30 leukemic blasts (samples from 3 mice per group). Differential analysis was performed with DESeq2 (P < 0.05). h Frequency of proliferating (Ki67+) cells in BM of moribund recipient mice (specimens from 3 mice per group). Data are presented as mean±SEM and analyzed by a two-tailed unpaired t-test. Source data are provided as a Source Data file.
Fig. 3
Fig. 3. Loss of TET2 leads to reduced Gata2 levels in Cebpa-mutant AML.
a Conserved targets of the CEBPA-TET2 axis visualized in a Venn-diagram of downregulated genes in CEBPA-TET2 co-mutated AML overlaid with corresponding data from Tet2-deficient in vivo and in vitro models of CebpaDM AML (P = 0.0264 vs. number of overlapping genes expected by random distribution assessed by Wilson/Brown binominal test). b Heatmap of differentially accessible regions assessed by assay for transposase-accessible chromatin sequencing (ATAC-seq; FDR < 0.05), and c genomic distribution of downregulated peaks (FDR < 0.05, Log2FC < 0) upon Tet2 mutation (4 clones per group). Differential analysis was performed with DiffBind and region enrichment analysis with GREAT. d Representative genome wide DNA-methylation status in leukemic blasts from the in vivo model assessed by whole genome bisulfite sequencing (WGBS) showing frequency of methyl-cytosine (mC) across the transcription start site (TSS) ±1000 base pairs, gene body scaled to 4000 base pairs, and transcription termination site (TES) ±1000 base pairs. Methylation analysis was performed with Bismark and visualized using deepTools. e Median and interquartile range of percent mC at promoters of down- (n = 172), not expressed (n = 6539), not differentially expressed (not DE; n = 14759) and up-regulated (n = 57) genes (averaged data generated from 2 CebpaΔ/p30Tet2+/+ and 3 CebpaΔ/p30Tet2Δ/Δ mice). Whiskers indicates max–min and data were analyzed by two-tailed unpaired t-test. f Promoter DNA methylation of conserved target genes in leukemic blast (samples from 2 CebpaΔ/p30Tet2+/+ and 3 CebpaΔ/p30Tet2Δ/Δ mice). Data are presented as mean±SEM. The data were log-transformed and analyzed by two-tailed unpaired t-test. g Gata2 variant mRNA expression in CebpaΔ/p30Tet2Δ/Δ and CebpaΔ/p30Tet2+/+ leukemic blasts (samples from 3 mice per group). Data are presented as mean ± SEM. The data were log-transformed and analyzed by a two-tailed unpaired t-test. h Schematic genomic view of the Gata2 locus, including representative examples of assay for transposase-accessible chromatin using sequencing (ATAC-seq) in Cebpap30/p30 cells. Source data are provided as a Source Data file.
Fig. 4
Fig. 4. Moderate Gata2 reduction increases competitiveness of Cebpa-mutant AML.
a Experimental setup for evaluating the effect of Gata2 knockdown, via short hairpin RNA (shRNA) mediated silencing, on Cebpap30/p30 leukemic cells in a competitive in vivo assay. The illustration was created with BioRender.com. b Gata2 mRNA in Cebpap30/p30 leukemic cells prior to transplantation. c Representative flow cytometry profiles of input and output of shControl (no knockdown), shGata2A (low knockdown), and shGata2D (high knockdown). d Competitive advantage of targeting shRNA (GFP+) vs. non-targeting shRNA (YFP+) cells in vivo assessed as by flow cytometry (Control 4, shGata2A 4, shGata2B 4, shGata2C 4, and shGata2D 3 mice). Data are presented as mean±SEM. Data were log-transformed and analyzed by one-way-ANOVA followed by Dunnett’s multiple comparisons correction. e Experimental setup for Gata2 CRISPR/Cas9 mutagenesis in Cebpap30/p30 cells, and outgrowth of heterozygous mutated clones. Percentages of Gata2 mutated clones are indicated. f Growth curve of Cebpap30/p30 clones with Gata2 mutation (Cebpap30/p30Gata2+/MUT, n = 10) or wild type Gata2 (Cebpap30/p30Gata2+/+, n = 3). Data are presented as mean±SEM and analyzed by two-tailed unpaired t-test. Red lines mark individual mutated clones. g Presence or absence of GATA2 mutations (GATA2MUT) in CEBPA double mutated (CEBPADM) AML cases with or without TET2 mutations (TET2MUT) in aggregated data from published cohorts–,,, (detailed in Supplemental Table 2a). Data were analyzed by Wilson/Brown binominal test. Source data are provided as a Source Data file.
Fig. 5
Fig. 5. Increased CEBPA p30 binding to the Gata2 distal hematopoietic enhancer drives expression of Gata2 via TET2.
a Gata2 mRNA expression in mouse Cebpap30/p30 leukemic granulocyte/monocyte progenitors (GMPs) vs normal GMPs (samples from 4 Cebpa+/+ and 2 Cebpap30/p30 mice) and, b CEBPA binding to the Gata2 distal hematopoietic enhancer (G2DHE; −77 kb) region (samples from 2 mice per group), data from Jakobsen et al.. Data are presented as mean ± SEM. Differential analysis was performed with DESeq2 (P < 0.05). c Schematic genomic view of the Gata2 distal hematopoietic enhancer (G2DHE), including normalized chromatin immunoprecipitation sequencing (ChIP-seq) signal of CEBPA (data from Heyes et al.), TET2 and H3K27Ac (data from Heyes et al.), as well as assay for transposase-accessible chromatin using sequencing (ATAC-seq) in Cebpap30/p30 cells without (light blue) and with (green) mutation in Tet2. d Gata2 mRNA levels in response to targeting of the G2DHE by CRISPR-Cas9 in Cebpap30/p30 cells in vitro using indicated sgRNAs and e the averaged change in Gata2 mRNA levels of the 12 deletions (averaged data from 2 separate experiments). Data are presented as median ± range and analyzed by two-tailed Wilcoxon signed-rank test. f Experimental setup for evaluating the effects of Cebpa knockout on Gata2 V2 mRNA expression and DNA methylation of the CpG island at the promoter of Gata2 V2 in MLL-fusion driven AML (iMLL-AF9). The illustration was created with BioRender.com. g Gata2 V2 mRNA expression (leukemic cell lines generated from 2 separate mice were assayed on 2 separate days in 2–3 technical replicates each). Data are presented as mean ± SEM and the individual cell lines are indicated by circles or squares. Data were log-transformed and analyzed by two-tailed unpaired t-test. h DNA methylation of the Gata2 V2 promoter CpG-island (2 separate leukemic cell lines). Data are presented as median±range and the individual cell lines are indicated by circles or squares. i Experimental setup for evaluating the effects of Cebpa knockdown on TET2 binding to the G2DHE in Cebpap30/p30 cells with inducible expression of shRNA targeting Cebpa and control (Renilla), respectively. The illustration was created with BioRender.com. j TET2 binding to the G2DHE assessed by ChIP-qPCR (3 replicates per condition). Data are presented as mean±SEM and analyzed by two-tailed unpaired t-test. k Frequency of GATA2 and/or TET2 mutations (GATA2MUT and TET2MUT, respectively) in CEBPA high expressing (CEBPAHIGH; 45 cases) vs. CEBPA low expressing (CEBPALOW; 61 cases) AML cases, data from Beat AML cohort. The distributions of GATA2WTTET2WT vs. GATA2MUT and/or TET2MUT cases were analyzed by Wilson/Brown binominal test. Source data are provided as a Source Data file.
Fig. 6
Fig. 6. Demethylating treatment restores Gata2 expression and prolongs survival in TET2-deficient Cebpa-mutant AML.
a Experimental setup for evaluating the effect of short-term 5-azacytidine (5-AZA) treatment in vivo. Recipient mice were sub-lethally irradiated and transplanted with leukemic BM from moribund secondary recipient mice. Three individual CebpaΔ/p30Tet2Δ/Δ clones (A–C) and two CebpaΔ/p30Tet2+/+ clones (A–B) were used, respectively. The illustration was created with BioRender.com. b Expansion of myeloid (Mac1+) donor-derived cells in bone marrow (BM) assessed by flow cytometry, and c Gata2 mRNA expression in sorted leukemic blasts by qPCR assessed 24 hours after the last of three injections of 5-AZA or vehicle (samples from 3 mice per clone and 6 and 9 mice per group, for CebpaΔ/p30Tet2+/+ and CebpaΔ/p30Tet2Δ/Δ, respectively). Dot plots showing individual mice for separate clones and bar graphs shows mean ± SEM for each group. Data were analyzed by Kruskal–Wallis test followed by Dunn’s correction for multiple comparisons. d Experimental setup for evaluating the effect of 5-AZA treatment on AML progression in vivo. The illustration was created with BioRender.com. e Survival of sub-lethally irradiated tertiary recipient mice after transplantation of leukemic BM from moribund secondary recipient mice (clone A from both genotypes) in response to intermittent 5-AZA treatment (5-AZA treated groups 8 mice and vehicle-treated groups 4 mice). The data were analyzed by Mantel–Cox Log-rank test. Source data are provided as a Source Data file.
Fig. 7
Fig. 7. TET2 lesions enhance the aggressiveness of CEBPA-mutant AML by rebalancing GATA2 expression.
a Model of Gata2 differential expression as a consequence of (I) elevated CEBPA p30 due to the hypermorphic effect of the CEBPANT, (II) TET2 deficiency and, (III) CEBPA deficiency. b Schematic illustration of two strategies for CEBPADM AML to rebalance GATA2 levels by (I) loss-of-function mutations in TET2 and (II) loss-of-function mutations in one GATA2 allele. The illustrations were created with BioRender.com.

References

    1. Tyner JW, et al. Functional genomic landscape of acute myeloid leukaemia. Nature. 2018;562:526–531. doi: 10.1038/s41586-018-0623-z. - DOI - PMC - PubMed
    1. Ohlsson E, Schuster MB, Hasemann M, Porse BT. The multifaceted functions of C/EBPalpha in normal and malignant haematopoiesis. Leukemia. 2016;30:767–775. doi: 10.1038/leu.2015.324. - DOI - PubMed
    1. Fasan A, et al. The role of different genetic subtypes of CEBPA mutated AML. Leukemia. 2014;28:794–803. doi: 10.1038/leu.2013.273. - DOI - PubMed
    1. Papaemmanuil E, et al. Genomic classification and prognosis in acute myeloid leukemia. N. Engl. J. Med. 2016;374:2209–2221. doi: 10.1056/NEJMoa1516192. - DOI - PMC - PubMed
    1. Ahn JS, et al. Normal karyotype acute myeloid leukemia patients with CEBPA double mutation have a favorable prognosis but no survival benefit from allogeneic stem cell transplant. Ann. Hematol. 2016;95:301–310. doi: 10.1007/s00277-015-2540-7. - DOI - PubMed

Publication types

MeSH terms