. 2023 Oct 4;14(1):6090.
doi: 10.1038/s41467-023-41768-8.

Intravenous administration of BCG in mice promotes natural killer and T cell-mediated antitumor immunity in the lung

Affiliations

Intravenous administration of BCG in mice promotes natural killer and T cell-mediated antitumor immunity in the lung

Eduardo Moreo et al. Nat Commun. .

Abstract

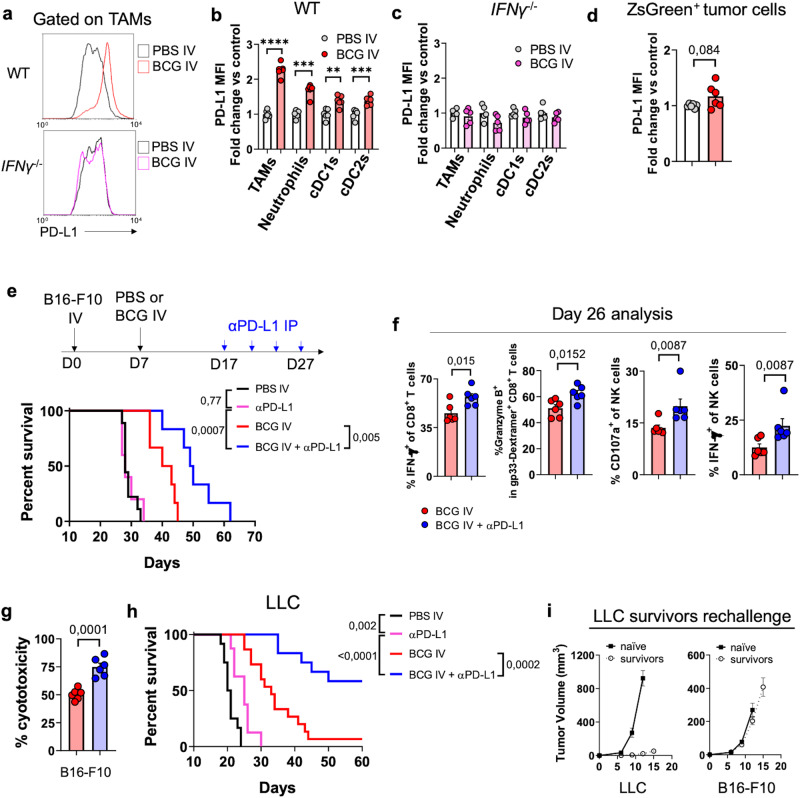
Intravesical administration of Bacillus Calmette-Guérin (BCG) was one of the first FDA-approved immunotherapies and remains a standard treatment for bladder cancer. Previous studies have demonstrated that intravenous (IV) administration of BCG is well-tolerated and effective in preventing tuberculosis infection in animals. Here, we examine IV BCG in several preclinical lung tumor models. Our findings demonstrate that BCG inoculation reduced tumor growth and prolonged mouse survival in models of lung melanoma metastasis and orthotopic lung adenocarcinoma. Moreover, IV BCG treatment was well-tolerated with no apparent signs of acute toxicity. Mechanistically, IV BCG induced tumor-specific CD8+ T cell responses, which were dependent on type 1 conventional dendritic cells, as well as NK cell-mediated immunity. Lastly, we also show that IV BCG has an additive effect on anti-PD-L1 checkpoint inhibitor treatment in mouse lung tumors that are otherwise resistant to anti-PD-L1 as monotherapy. Overall, our study demonstrates the potential of systemic IV BCG administration in the treatment of lung tumors, highlighting its ability to enhance immune responses and augment immune checkpoint blockade efficacy.


Conflict of interest statement

The authors declare no competing interests.

Figures

Fig. 1
Fig. 1. Intravenous BCG administration delays the growth of B16-F10 lung metastases.
a Schematic diagram showing treatment strategy. b Survival curve of B16-F10 tumor-bearing mice treated with IV PBS (n = 13) or BCG (n = 18) at day 7, pooled from three independent experiments. c Survival curve of B16-F10 tumor-bearing mice treated with IV PBS (n = 6) or BCG (n = 6) at day 14, from one experiment. d Representative H&E images of tissue sections from tumor-bearing lungs of PBS (n = 4) or BCG (n = 6) -treated mice at day 20 after tumor cell inoculation and quantification of the tumor area, number of tumor nodules and average area per tumor nodule in lung cross-sections, representative of two independent experiments. Scale bars correspond to 1 mm in length. e Number of clonogenic colonies in single cell suspensions from tumor-bearing lungs shown in (d) (n = 4 mice for PBS IV and n = 6 for BCG IV, from one experiment). f Survival curve of B16-F10 tumor-bearing mice treated with IV PBS (n = 9), SC BCG (n = 6), IN BCG (n = 6) or IV BCG (n = 6), from one experiment. g Survival curve of B16-F10 tumor-bearing mice treated with IV PBS (n = 6), heat-killed IV BCG (n = 5) or different doses of live IV BCG (n = 6 mice/group), from one experiment. P values were calculated using two-tailed unpaired Student’s t test at a 95 % CI (d, e) or log-rank (Mantel-Cox) test (b, c, f, g). Data depicted as mean ± SEM (d, e). PBS phosphate-buffered saline, IV intravenous, SC subcutaneous, IN intranasal, HK heat-killed.
Fig. 2
Fig. 2. The adaptive immune system is required for IV BCG antitumoral efficacy.
a Survival curve of B16-F10 tumor-bearing perforin (Perf−/−) or IFN-γ deficient (IFNγ−/−) mice treated with IV BCG at day 7, n = 11 mice for IFNγ−/− PBS IV, n = 11 for IFNγ−/− BCG IV, n = 8 for Perf−/− PBS IV, n = 6 for Perf−/− BCG IV, pooled from two independent experiments. b Survival curve of B16-F10 tumor-bearing mice receiving CD4+ or CD8+ T cell depleting antibodies and treated with IV BCG at day 7, n = 6 mice per group, from one experiment. P values were calculated using log-rank (Mantel-Cox) test (a, b). PBS phosphate-buffered saline, IV intravenous, IP intraperitoneal, WT wild-type, IFNγ interferon gamma, Perf perforin.
Fig. 3
Fig. 3. Stimulation of T cell function in the lung by IV BCG.
a Schematic diagram showing treatment strategy for (be). b, c IFN-γ or IL-2 expression by lung CD8+ or CD4+ T cells in B16-F10 tumor bearing mice at day 20, n = 9 mice/group for IFN- γ and n = 5 for IL-2, pooled from two independent experiments. d Expression of Granzyme B on lung tissue-infiltrating CD8+ T cells; representative contour plots for the identification of lung-tissue infiltrating CD8+ T cells (CD45 IV-) and for Granzyme B expression are shown, n = 6 mice/group, pooled from two independent experiments. e Expression of T-bet and GATA3 on lung tissue-infiltrating CD4+ T cells, n = 6 mice/group, pooled from two independent experiments. f Schematic diagram showing treatment strategy for panels (gj). g, h Quantification of CD44+ gp33-specific CD8+ T cells in the lungs and spleens of mice bearing B16-F10.gp33 lung tumors at day 20. Representative contour plots are shown. Lung (g): n = 10 mice/group, pooled from two independent experiments. Spleen (h): n = 5 mice/group, from one experiment. i Granzyme B expression by gp33-specific CD8+ T cells in the lung, n = 5 mice/group, from one experiment. j Cytotoxicity exerted by splenocytes isolated from mice bearing B16-F10.gp33 lung tumors against target B16-F10-ZsGreenLuc or LLC-ZsGreenLuc tumor cells. Percentage cytotoxicity was calculated in reference to luminescence emitted by cells without splenocytes, n = 6 mice/group, from one experiment. k Schematic diagram showing experimental setup and follow-up of B16-F10 tumor growth in Rag1−/− mice reconstituted with splenocytes from the indicated donor mice, n = 4 BCG IV (tumor-free), n = 6 tumor-bearing + PBS IV, n = 6 tumor-bearing + BCG IV. P values were calculated using two-tailed unpaired Student’s t-test at a 95 % CI (be, gj) or two-way ANOVA (k). Data depicted as mean ±  SEM (be, gk). PBS phosphate-buffered saline, IV intravenous, SC subcutaneous.
Fig. 4
Fig. 4. Batf3-dependent cDC1s are required for IV BCG efficacy against B16-F10 lung metastases.
a Schematic diagram showing treatment strategy for (ae) and absolute number and frequency of cDC1s in the lung (n = 18 mice per group, pooled from three independent experiments). b Flow cytometry quantification of CD86, CD40 and XCR1 mean fluorescence intensity (MFI) on lung cDC1s (n = 11 mice/group for CD86, n = 9 mice/group for CD40 and n = 14 mice/group for XCR1, pooled from four independent experiments). c IL-12 expression by lung cDC1s after ex vivo restimulation (n = 6 mice per group, from one experiment). d Absolute number of cDC1s in the lung-draining mediastinal lymph node (mLN) (n = 9 mice per group, pooled from two independent experiments). e CD86, CD40 and XCR1 expression by mLN cDC1s (n = 6 mice per group, pooled from two independent experiments). f Schematic diagram showing treatment strategy for (fi) and quantification of B16-F10-gp33 lung surface metastases (n = 8 mice/group for WT mice and n = 10 mice/group for Batf3−/−, pooled from two independent experiments). g Lung CD8+ T frequency in B16-F10-gp33 lung tumor bearing mice (n = 6 mice/group for WT mice and n = 10 mice/group for Batf3−/−, pooled from two independent experiments). h Quantification of CD44+ gp33-specific CD8+ T cells in the lungs. Representative contour plots are shown. n = 6 mice/group for WT mice and n = 10 mice/group for Batf3−/− mice, pooled from two independent experiments. i Cytotoxicity exerted by splenocytes isolated from the indicated groups of mice bearing B16-F10-gp33 lung tumors against target B16-F10-ZsGreenLuc or LLC-ZsGreenLuc tumor cells. n = 6 mice/group, from one experiment. j Therapeutic efficacy of IV BCG in Batf3−/− mice bearing B16-F10 lung tumors (n = 7 mice/group, pooled from two independent experiments). P values were calculated using two-tailed unpaired Student’s t test at a 95 % CI (ae), one-way ANOVA with Bonferroni multiple-comparison test (fi) or log-rank (Mantel-Cox) test (j). Data is depicted as mean ± SEM (ai). PBS phosphate-buffered saline, IV intravenous, cDC1s type 1 conventional dendritic cells, mLN mediastinal lymph node.
Fig. 5
Fig. 5. IV BCG boosts NK cell antitumor function.
a Schematic diagram showing treatment strategy for panels (a, b) and NK cell frequency in the lungs (n = 6 mice/group, from one experiment representative of three independent experiments). b Quantification of Granzyme B, IFN-γ, CD107a and CD11b expression in lung NK cells (n = 6 mice/group, from one experiment representative of three independent experiments). c Schematic diagram showing experimental setup and in vitro cytotoxicity of purified lung NK cells against target B16-F10 tumor cells, pooled from three independent experiments with n = 2 mice per condition. d Survival curve of WT or Perf−/− mice bearing B16-F10-B2m−/− lung metastases (n = 6 mice for WT and n = 5 for Perf−/− mice, from one experiment). e Survival curves of mice bearing B16-F10 lung metastases (n = 12 mice for PBS IV and BCG IV and n = 6 mice for BCG IV + NK depletion, pooled from two independent experiments). P values were calculated using two-tailed unpaired Student’s t test at a 95 % CI (ac) or log-rank (Mantel-Cox) test (d, e). Data is depicted as mean ± SEM. PBS phosphate-buffered saline, IV intravenous, B2m Beta-2 microglobulin, Perf perforin, NK natural killer, GZMB granzyme B, IP intraperitoneal.
Fig. 6
Fig. 6. BCG-stimulated NK cells modulate adaptive immune responses in the lung.
a Schematic diagram showing treatment strategy for (ah) and quantification of lung surface B16-F10-gp33 metastases at day 20 (n = 6 mice/group, representative of two independent experiments). b Quantification of CD44+ gp33-specific CD8+ T cells in the lung (n = 6 mice/group, from one experiment). c Splenocytes were isolated from mice treated as in (a) and their cytotoxicity against B16-F10-ZsGreenLuc cells tested in an in vitro assay (n = 6 mice/group, from one experiment). d IFN-γ expression by lung CD4+ and CD8+ T cells following ex vivo restimulation (n = 6 mice/group, from one experiment). e Absolute number and frequency of cDC1s in the lungs (n = 18 mice/group for PBS IV and BCG IV and n = 12 for BCG IV + NK depletion, pooled from three independent experiments). f CCL5 expression by lung NK cells at day 20 (n = 12 mice/group, pooled from two independent experiments). g CCL5 protein concentration in lung homogenates (n = 6 mice/group, from one experiment). h, Schematic diagram showing treatment strategy and quantification of ZsGreen expression in mLN cDC1s (n = 6 mice per group, representative of two independent experiments). P values were calculated using two-tailed unpaired Student’s t test at a 95 % CI (f) or one-way ANOVA with Bonferroni multiple-comparison test (ae, g, h). Data is depicted as mean ± SEM. PBS phosphate-buffered saline, IV intravenous, IP intraperitoneal, NK natural killer, depl depletion, cDC1s type 1 conventional dendritic cells, mLN mediastinal lymph node, ZsG ZsGreen.
Fig. 7
Fig. 7. Efficacy of IV BCG in orthotopic lung cancer models.
a Schematic diagram showing treatment strategy. b Survival curves of mice bearing orthotopic LLC tumors and treated with IV PBS (n = 6) or BCG (n = 6) at day 7, from one experiment representative of two independent experiments. c Representative H&E images of tumor-bearing lungs of PBS (n = 5) or BCG (n = 6) -treated mice (at day 7) at day 20 after inoculation of LLC tumor cells, and quantification of the tumor area, number of tumor nodules and average area per tumor nodule in lung cross-sections, from one experiment. Scale bars correspond to 1 mm in length. d Survival curve of mice bearing orthotopic LLC tumors and treated with IV PBS (n = 9) or BCG (n = 6) at day 14, from one experiment. e Survival curve of mice bearing orthotopic TC-1 tumors and treated with IV PBS (n = 6) or BCG (n = 8) at day 7, from one experiment. f Survival curves of IFNγ−/−, Perf−/− or Batf3−/− mice bearing orthotopic LLC tumors and treated with IV PBS or BCG at day 7 (n = 8 mice/group, pooled from two independent experiments). g Survival curve of mice bearing orthotopic LLC-B2m−/− tumors and treated with IV PBS (n = 6) or BCG (n = 6) at day 7, from one experiment. P values were calculated using two-tailed unpaired Student’s t test at a 95 % CI (c) or log-rank (Mantel-Cox) test (b, dg). Data depicted as mean ± SEM (c). PBS phosphate-buffered saline, IV intravenous, NK natural killer, Perf perforin, B2m Beta-2 microglobulin.
Fig. 8
Fig. 8. IV BCG recruits and activates NK and CD8+ T cells in an orthotopic lung cancer model.
a Schematic diagram showing treatment strategy. b Frequencies of cellular subsets in the lung (n = 5 mice for PBS IV and n = 6 mice for BCG IV, from one experiment). c Granzyme B expression by immune cell subsets (n = 5 mice for PBS IV and n = 6 mice for BCG IV, from one experiment). d In vitro cytotoxicity of lung NK cells against LLC tumor cells. Pooled from two independent experiments with n = 2 mice per condition in each experiment. e IFN-γ or IL-2 expression by lung CD8+ or CD4+ T cells (n = 5 mice for PBS IV and n = 6 mice for BCG IV, from one experiment). f Frequency of PD-1+ SIINFEKL-specific CD8+ T cells in the lungs of mice bearing orthotopic LLC-OVA tumors (n = 5 mice/group, from one experiment). g, Representative IHC staining of NK cells in orthotopic LLC lung tumors. NCR1+ cells were quantified inside tumor nodules (n = 21 regions for IV PBS-treated mice and n = 10 regions for IV BCG-treated mice) and adjacent tumor-free tissue (n = 17 regions for IV PBS and n = 13 regions for IV BCG-treated mice). Data comes from one experiment with n = 5 mice for PBS IV and n = 6 mice for BCG IV. h CD8+ T cell quantification by IHC in LLC tumor nodules (n = 27 regions for IV PBS-treated mice and n = 10 regions for IV BCG-treated mice) and adjacent tumor-free tissue (n = 21 regions for IV PBS and n = 7 regions for IV BCG-treated mice). Data comes from one experiment with n = 5 mice for PBS IV and n = 6 mice for BCG IV. Scale bars correspond to 50 μm in length (g, h). P values were calculated using two-tailed unpaired Student’s t-test at a 95 % CI (bh). Data depicted as mean ± SEM. PBS phosphate-buffered saline, IV intravenous, NK natural killer, GZMB Granzyme B.
Fig. 9
Fig. 9. PD-L1 checkpoint blockade boosts IV BCG efficacy in lung tumors.
ac Quantification of PD-L1 expression at day 20 in different subsets of lung immune cells from WT (b) or IFNγ−/− mice (c) bearing B16-F10 lung tumors treated or not with BCG IV. Representative flow cytometry histogram plots are shown (a), n = 5 (IFNγ−/−) or n = 6 (WT) mice per group, from one experiment. d PD-L1 expression on ZsGreen+ B16-F10 tumor cells in vivo at day 20, n = 6 mice/group, from one experiment. e Survival curves of mice bearing B16-F10 lung metastases and treated with IV PBS (n = 9), IV PBS + αPD-L1 antibody (n = 6), IV BCG (n = 6) or IV BCG + αPD-L1 antibody (n = 6), from one experiment. f Flow cytometry analysis of IFN-γ expression by CD8+ T cells, Granzyme B expression by gp33-specific CD8+ T cells, and CD107a and IFN-γ expression by NK cells in the lungs of mice bearing B16-F10-gp33 lung metastases at day 26 post tumor implantation and after three doses of αPD-L1 antibody at days 17, 20 and 24 (n = 6 mice/group, from one experiment). g In vitro splenocyte cytotoxicity against B16-F10-ZsGreenLuc cells (n = 6 mice/group, from one experiment). h Survival curves of mice bearing orthotopic LLC lung tumors and treated with IV PBS (n = 12), IV PBS + αPD-L1 antibody (n = 8), IV BCG (n = 15) or IV BCG + αPD-L1 antibody (n = 12) as in (e), pooled from two independent experiments. i LLC survivors or naïve mice were inoculated subcutaneously with LLC tumor cells in one flank and B16-F10 in the contralateral flank, and tumor growth was measured until the predefined endpoint (n = 6 mice in the naïve group and n = 7 mice in the rechallenge group, from two independent experiments). P values were calculated using two-tailed unpaired Student’s t test at a 95 % CI (bd, f, g) or log-rank (Mantel-Cox) test (e, h). Data depicted as mean ± SEM (bd, f, g, i). PBS phosphate-buffered saline, IV intravenous, IP intraperitoneal, NK natural killer, TAMs tumor-associated macrophages, PD-L1 programmed cell death-ligand 1, cDC1s type 1 conventional dendritic cells.

References

    1. Sung H, et al. Global cancer statistics 2020: GLOBOCAN estimates of incidence and mortality worldwide for 36 cancers in 185 countries. CA Cancer J. Clin. 2021;71:209–249. doi: 10.3322/caac.21660. - DOI - PubMed
    1. Herbst RS, et al. Atezolizumab for first-line treatment of PD-L1–selected patients with NSCLC. N. Engl. J. Med. 2020;383:1328–1339. doi: 10.1056/NEJMoa1917346. - DOI - PubMed
    1. Brahmer JR, et al. Safety and activity of Anti–PD-L1 antibody in patients with advanced cancer. N. Engl. J. Med. 2012;366:2455–2465. doi: 10.1056/NEJMoa1200694. - DOI - PMC - PubMed
    1. Zhang KS, et al. Pulmonary metastatic melanoma: current state of diagnostic imaging and treatments. Melanoma Manag. 2021;8:MMT58. doi: 10.2217/mmt-2021-0001. - DOI - PMC - PubMed
    1. Vano Y-A, et al. First-line treatment of metastatic clear cell renal cell carcinoma: what are the most appropriate combination therapies? Cancers. 2021;13:5548. doi: 10.3390/cancers13215548. - DOI - PMC - PubMed

Publication types