. 2023 Oct 4;14(1):6169.
doi: 10.1038/s41467-023-41756-y.

Glycoproteomic landscape and structural dynamics of TIM family immune checkpoints enabled by mucinase SmE

Affiliations

Glycoproteomic landscape and structural dynamics of TIM family immune checkpoints enabled by mucinase SmE

Joann Chongsaritsinsuk et al. Nat Commun. .

Abstract

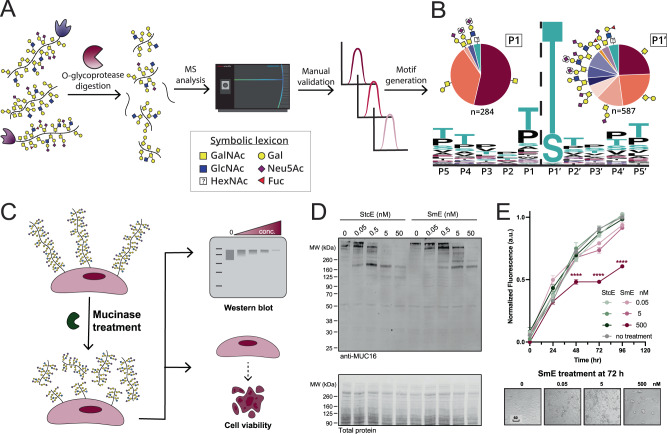
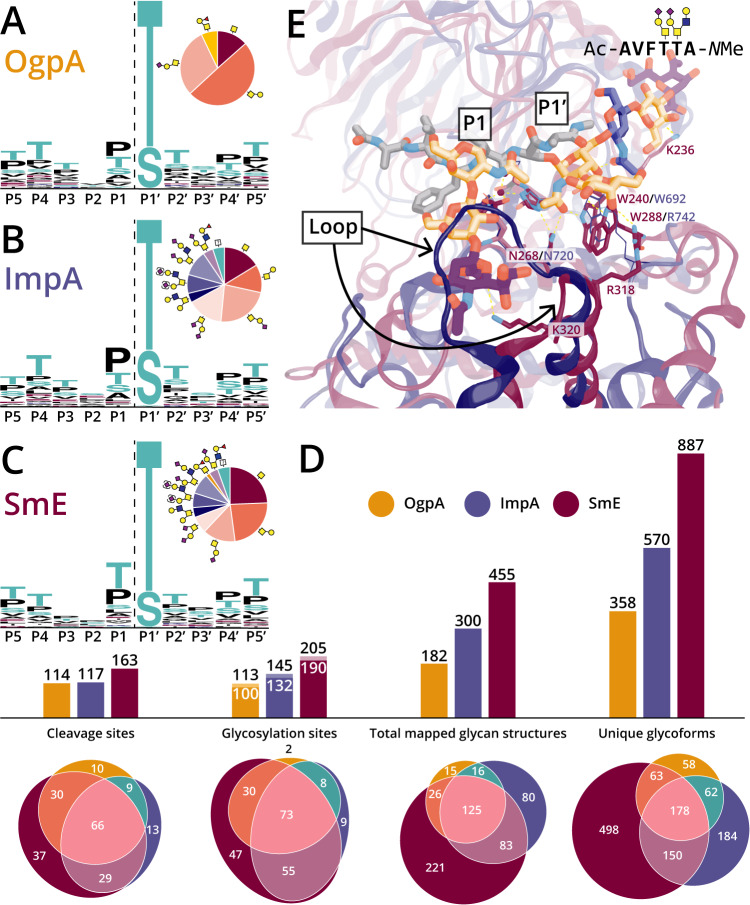
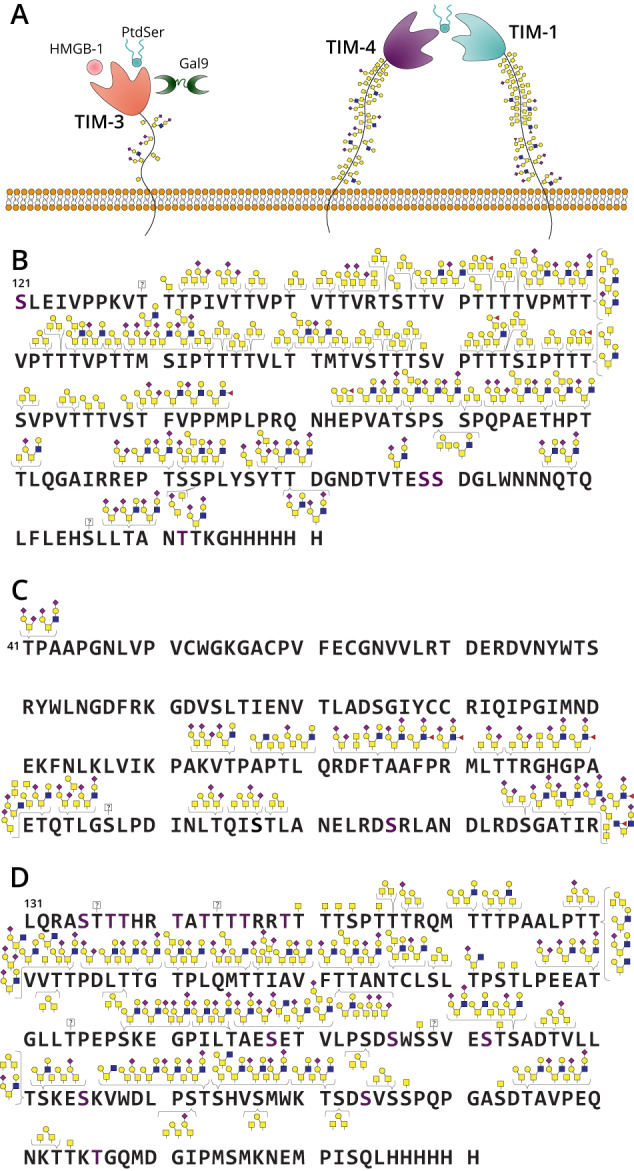
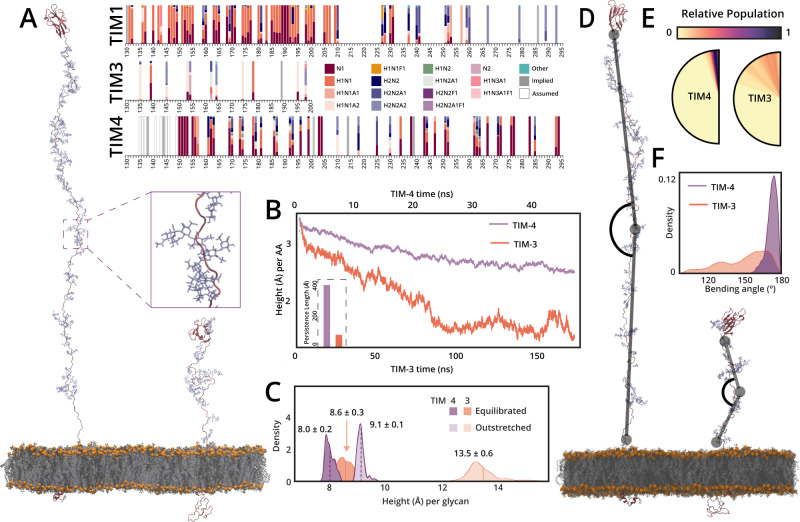
Mucin-domain glycoproteins are densely O-glycosylated and play critical roles in a host of biological functions. In particular, the T cell immunoglobulin and mucin-domain containing family of proteins (TIM-1, -3, -4) decorate immune cells and act as key regulators in cellular immunity. However, their dense O-glycosylation remains enigmatic, primarily due to the challenges associated with studying mucin domains. Here, we demonstrate that the mucinase SmE has a unique ability to cleave at residues bearing very complex glycans. SmE enables improved mass spectrometric analysis of several mucins, including the entire TIM family. With this information in-hand, we perform molecular dynamics (MD) simulations of TIM-3 and -4 to understand how glycosylation affects structural features of these proteins. Finally, we use these models to investigate the functional relevance of glycosylation for TIM-3 function and ligand binding. Overall, we present a powerful workflow to better understand the detailed molecular structures and functions of the mucinome.


Conflict of interest statement

F.L.K. is a consultant for Protein Evolution, Inc. M.A.H. received consulting fees from Dova Pharmaceuticals, Janssen Pharmaceuticals, and Sonder Capital. C.R.B. is a co-founder and scientific advisory board member of Lycia Therapeutics, Palleon Pharmaceuticals, Enable Bioscience, Redwood Biosciences (a subsidiary of Catalent) OliLux Bio, Grace Science LLC, and InterVenn Biosciences. S.A.M. is a consultant for InterVenn Biosciences and Arkuda Therapeutics. S.A.M., D.J.S., and C.R.B. are coinventors on a Stanford nonprovisional utility patent application that has been filed and is pending in the US (number US20220003777) related to the use of mucinases for mass spectrometry analysis of mucin-domain glycoproteins. The remaining co-authors have no conflicts of interest to disclose.

Figures

Fig. 1
Fig. 1. Characterization of mucinase SmE for analysis and degradation of mucin-domain glycoproteins.
A Workflow for generating consensus sequence of SmE. B Five recombinant mucin-domain glycoproteins were digested with SmE and subjected to MS analysis. Peptides present in the mucinase-treated samples were used as input for weblogo.berkeley.edu (±5 residues from the site of cleavage). Parentheses around sialic acids (purple diamond) indicate that its linkage site was ambiguous. C Workflow to evaluate the toxicity and cell surface activity of SmE. D HeLa cells were treated with StcE (left) or SmE (right) at the noted concentrations for 60 min. Following treatment, the cells were lysed in 1X NuPAGE LDS Sample Buffer with 25 mM DTT, subjected to separation by gel electrophoresis, and probed for MUC16 by Western blot. Proteins were transferred to a nitrocellulose membrane using the Trans-Blot Turbo Transfer System (Bio-Rad) at a constant 2.5 A for 15 min. Total protein was quantified using REVERT stain before primary antibody incubation overnight at 4 °C. An IR800 dye-labeled secondary antibody was used according to the manufacturer’s instructions for visualization on a LiCOR Odyssey instrument. E HeLa cells were treated with SmE and StcE at 0, 0.05, 5, and 500 nM. At t = 0, 24, 48, 72, 96 h post-treatment, PrestoBlue was added according to manufacturer’s instructions. After 2 h, the supernatant was transferred to a black 96 well plate and analyzed on a SPECTRAmax GEMINI spectrofluorometer using an excitation wavelength of 544 nm and an emission wavelength of 585 nm. Data are presented as mean values ± SD for n = 3 biologically independent samples. Statistical significance was determined using the two-way ANOVA analysis in Graphpad PRISM software and is reported with respect to the ‘no treatment’ control condition. ***p = 0.0001, ****p < 0.0001. Source data are provided in the Source Data file.
Fig. 2
Fig. 2. SmE outperformed commercial O-glycoproteases due to its structural permissiveness.
Cleavage motifs for (A) OgpA, (B) ImpA, and (C) SmE as determined by digestion followed by MS and manual curation of glycopeptides. D Bar graphs and Euler plots demonstrating counts and overlap between enzymes regarding the number of observed cleavage sites, localized glycosylation sites, total glycan structures, and unique glycoforms. For the “Glycosylation sites” bar graph, glycosites localized via MS are denoted by white numbers; black numbers above include implied glycosites where cleavage was observed but the glycosite was not localized. E A glycopeptide docked in the active site of SmE (maroon) and ImpA (blue), highlighting differences between key loops and residues of the two O-glycoproteases.
Fig. 3
Fig. 3. Glycoproteomic mapping of TIM family proteins.
A Cartoon of TIM family structure and ligand interactions. TIM-3 interacts with its ligands PtdSer, HMGB1, CEACAM1, and/or Gal-9; through intracellular signaling these interactions deactivate T cell function and cytokine release. TIM-1 and TIM-4 purportedly interact through PtdSer to enact effector function. Recombinant TIM-1 (B), TIM-3 (C), and TIM-4 (D) were subjected to digestion with SmE, ImpA, OgpA, and/or trypsin followed by MS analysis and manual data interpretation. Brackets indicate glycans sequenced at each Ser/Thr residue at >5% relative abundance. For full glycoproteomic sequencing data, see Supplementary Data 4, 7, and 8.
Fig. 4
Fig. 4. MD simulations of TIM-3 and -4 elucidate the structural and dynamical impact of glycosylation.
A (right) XICs were generated for each glycopeptide from TIM-1, -3, and -4 and area-under-the-curve quantitation was performed; glycan composition color legend shown in center. N - HexNAc (GalNAc), H - hexose (galactose), A - NeuAc (sialic acid), F - fucose. (A, left) Image detailing TIM-4 and TIM-3 models along with an inset view highlighting the dense TIM-4 glycosylation. B End-to-end distance of TIM-3 and TIM-4 mucin domains normalized by total length (number of amino acids, AA) within the mucin domains, plotted as a function of simulation length. (inset) Persistence length calculated for TIM-3 and TIM-4 from all simulation replicas. C Histograms detailing the end-to-end distance of TIM-3 and TIM-4 mucin domains, normalized by total number of glycans, in the outstretched (starting) conformation (lighter distributions) and equilibrated conformation (darker distributions). D Image demonstrating the “bending angle” as calculated in the following panels. E Semi-circles graphically detailing the bending angles visited over the complete course of simulations for TIM-3 and -4, angles colored according to relative population. F Histograms detailing bending angles sampled by TIM-3 and -4 over the course of all simulations. Source data are provided in the Source Data file.
Fig. 5
Fig. 5. Gal-9 crosslinks TIM-3 to enhance affinity to PtdSer.
A Gal-9 and the extracellular region of TIM-3 were incubated in the presence of the crosslinking reagent disuccinimidyl suberate (DSS). Western blotting for TIM-3 indicated that higher molecular weight species formed with increasing concentration of Gal-9. B Surface plasmon resonance was used to quantify the impact of (bivalent) Gal-9WT, with those of monovalent Gal-9R200D, or Gal-9R65D variants on the binding of TIM-3 to immobilized membranes containing 20% PtdSer and 80% phosphatidylcholine. Lipid vesicles were immobilized on an L1 sensorchip, and protein samples were flown over the surface with 1 mM CaCl2. The increase in response units (RU) observed for TIM-3 in the presence of Gal-9WT, Gal-9R65D, or Gal-9R200D is plotted as a function of Gal-9 concentration. Data are presented as mean +/- SD for n = 3 independent experiments. (C) Sensorgrams of TIM-3, TIM-3 and Gal-9WT, TIM-3 and Gal-9R65D, and TIM-3 and Gal-9R200D. The black triangles below the x-axis indicate the start of the sample injection (~75 s), the end of the sample injection (~375 s), and the regeneration (~510 s). Data points from the dissociation phase, (~375–500 s), were fit using a nonlinear regression model that was used to estimate koff values. (D) Bar graph showing the calculated koff values as mean ± SD for n = 3 independent experiments at the various conditions tested. Significance was tested using one-way ANOVA in Graphpad PRISM. Source data are provided as a Source Data file.

Update of

References

    1. Shurer CR, et al. Physical principles of membrane shape regulation by the glycocalyx. Cell. 2019;177:1757–1770.e21. - PMC - PubMed
    1. Ince D, Lucas TM, Malaker SA. Current strategies for characterization of mucin-domain glycoproteins. Curr. Opin. Chem. Biol. 2022;69:102174. - PubMed
    1. Kuo JC-H, Gandhi JG, Zia RN, Paszek MJ. Physical biology of the cancer cell glycocalyx. Nat. Phys. 2018;14:658–669. - PMC - PubMed
    1. Möckl L. The emerging role of the mammalian glycocalyx in functional membrane organization and immune system regulation. Front. Cell Dev. Biol. 2020;8:253. - PMC - PubMed
    1. Hollingsworth MA, Swanson BJ. Mucins in cancer: protection and control of the cell surface. Nat. Rev. Cancer. 2004;4:45–60. - PubMed

Publication types

MeSH terms