. 2023 Oct 4;13(1):16662.
doi: 10.1038/s41598-023-42105-1.

Strong coupling of hybrid states of light and matter in cavity-coupled quantum dot solids

Affiliations

Strong coupling of hybrid states of light and matter in cavity-coupled quantum dot solids

Arumugam Sangeetha et al. Sci Rep. .

Abstract

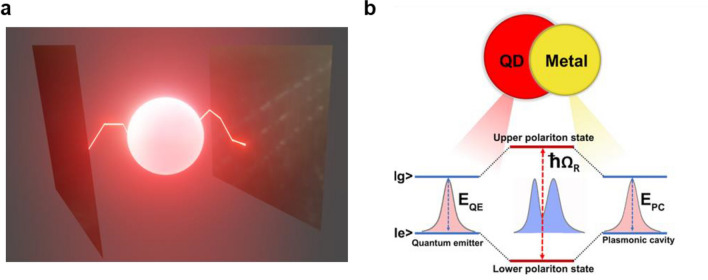
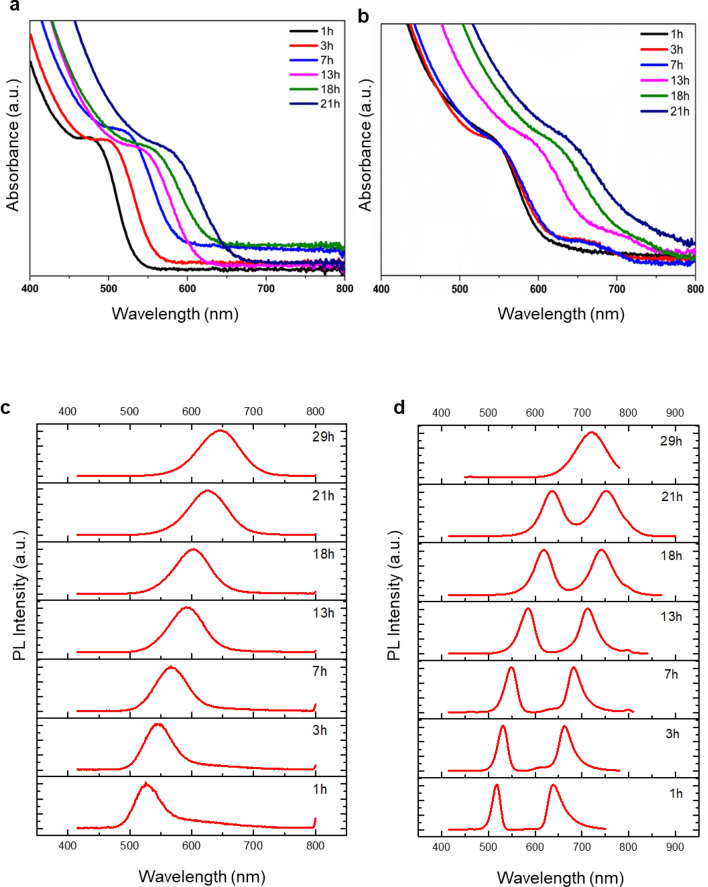
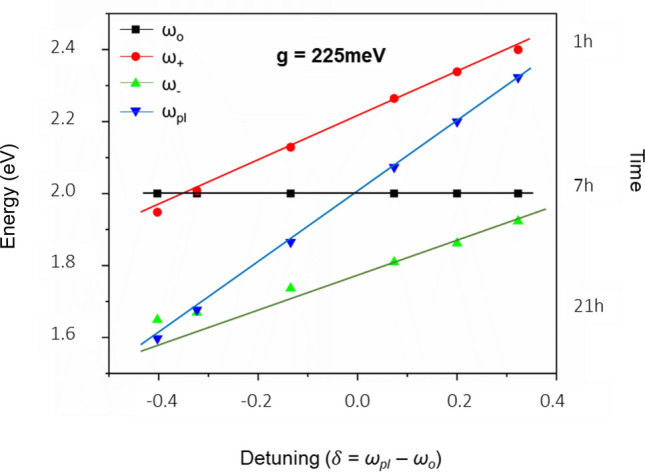
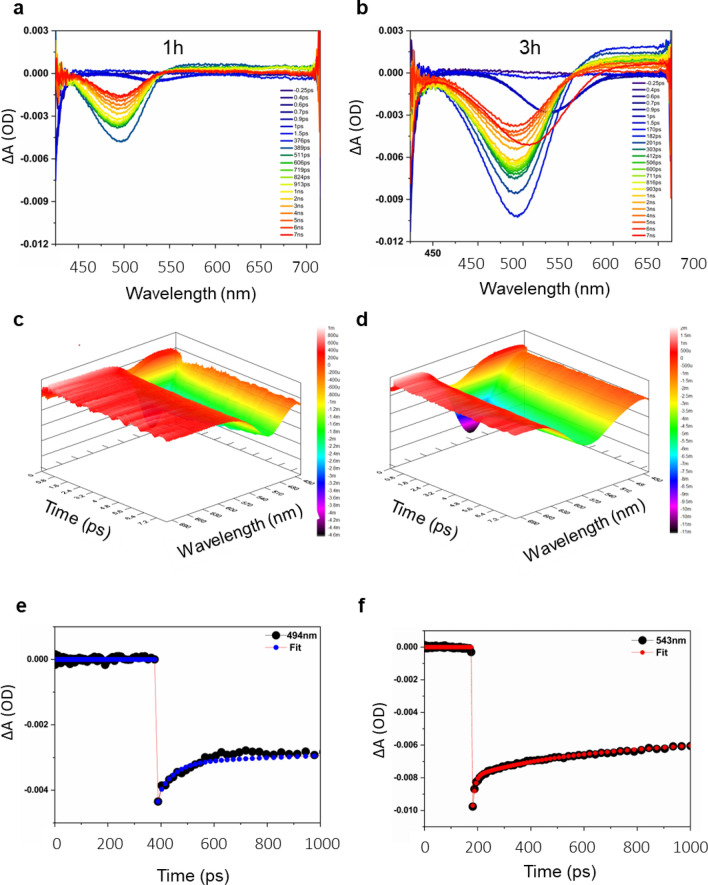
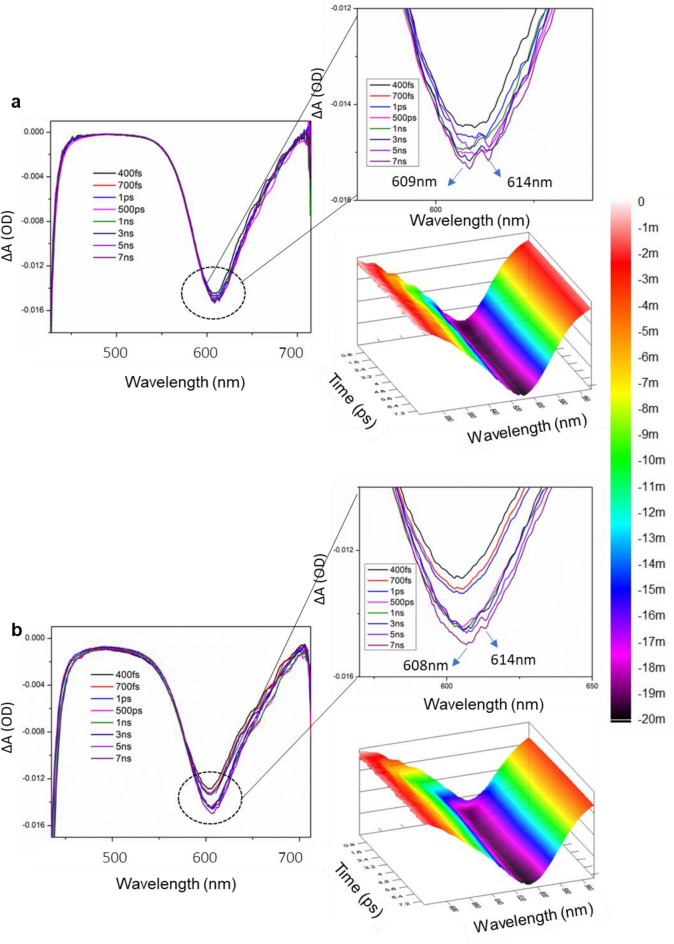
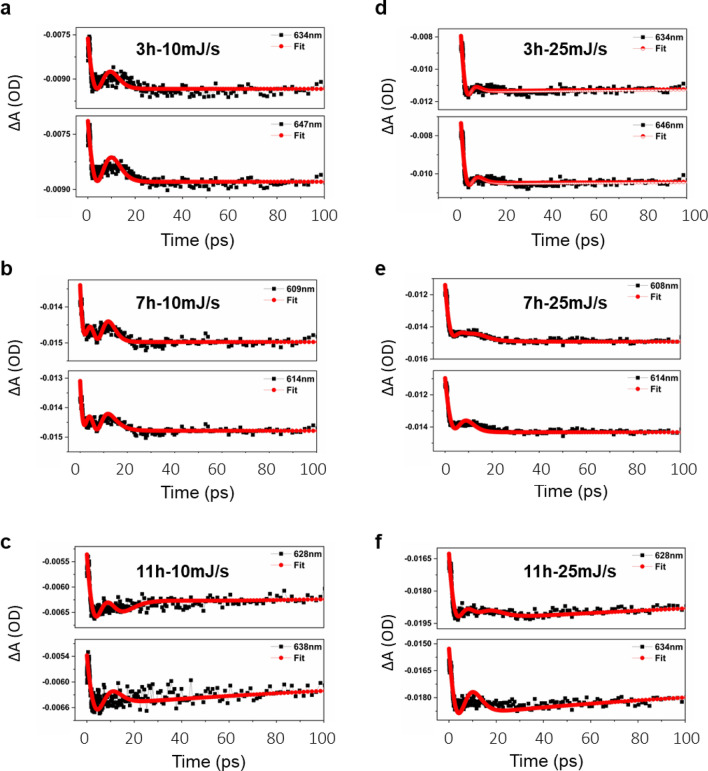
The formation of plasmon-exciton (plexciton) polariton is a direct consequence of strong light-matter interaction, and it happens in a semiconductor-metal hybrid system. Here the formation of plasmon-exciton polaritons was observed from an AgTe/CdTe Quantum Dot (QD) solid system in the strong coupling regime. The strong coupling was achieved by increasing the oscillator strength of the excitons by forming coupled QD solids. The anti-crossing-like behaviour indicates the strong coupling between plasmonic and excitons state in AgTe/CdTe QD solids, resulting in a maximum Rabi splitting value of 225 meV at room temperature. The formation of this hybrid state of matter and its dynamics were studied through absorption, photoluminescence, and femtosecond transient studies.


Conflict of interest statement

The authors declare no competing interests.

Figures

Figure 1
Figure 1
Schematic diagram of an emitter-cavity system. (a) The figure depicts the resonance interaction of an emitter with the cavity. The glowing sphere is the emitter which is the QD. The reflecting mirrors are the cavity system that is the source of plasmons. (b) Schematic diagram of the formation of hybridized plexciton states. When the excitons (QD) and plasmons (metal) interact, energy is coherently and reversibly exchanged between the plasmonic and excitonic systems forming plasmon-exciton polaritons.
Figure 2
Figure 2
HRTEM analysis of CdTe:Ag QD solid system. (A) The figure shows the aerial micrograph with zoomed planes and SAED pattern. HRTEM images and SAED pattern of medium Ag concentration QD solids with reaction times (a) 3 h, (b) 7 h, (c) 13 h, (d) 21 h, and (e) 29 h sample. In the SAED pattern, the crystal planes of CdTe and AgTe are highlighted in yellow and green rings. At high magnifications, the interconnectedness can be seen confirming the coupled QD solid formation. The results for low and high Ag concentration samples are given in the supplementary information (Figs. S1, S2).
Figure 3
Figure 3
X-ray diffraction analysis of CdTe:Ag QD solid system. XRD of the medium Ag concentration QD solids for different reaction times 3 h, 7 h, 13 h, 21 h, and 29 h sample. The purple star symbol represents the CdTe crystal structure, the green triangle represents the AgTe crystal structure and the blue rhombus represents the TeO2 crystal structure. In the initial hours, AgTe peaks are sharp and at the final hours, they are broadened. The appearance and disappearance of the XRD peak infer that the prolonging growth process influences the formation/orientation of the crystal growth.
Figure 4
Figure 4
XPS analysis of AgTe/CdTe QD solid system: XPS of the medium Ag concentration QD solids prepared at 7 h and 21 h reaction times (a) in C 1s region, (b) in Cd 3d region, (c) in Te 3d, and (d) in Ag 3d region.
Figure 5
Figure 5
Photo-physical properties of CdTe and medium AgTe/CdTe QD solids. Absorption spectra of (a, b) CdTe and AgTe/CdTe QD solid samples collected at different reaction times. PL spectra of (c, d) CdTe and AgTe/CdTe QD solid system collected at different reaction times of the medium Ag concentration samples.
Figure 6
Figure 6
Anti-crossing behaviour at zero detuning of AgTe/CdTe QD solids. Anti-crossing at zero detuning (UP & LP energies at δ = 0 for a range of plasmon-exciton detuning) of medium Ag concentration cavity-coupled AgTe/CdTe Quantum dot solid system for different reaction times (1–21 h). In the figure, (ω+) (ω) are energies of upper and lower polariton branches extracted from Fig. 5d, (ωo) is the average exciton resonance energy extracted from Fig. 5a, (ωpl) is the plasmon resonance energy (derived from the equation). The energy (ω+, ω, ωpl) decreases with an increase in reaction time. Although the dispersions of the individual plasmon and exciton cross each other at zero detuning (δ = 0), the upper and lower polariton dispersions show anti-crossing behaviour indicating the strong plasmon-exciton coupling. The figure also shows that zero detuning was achieved in the 7 h sample.
Figure 7
Figure 7
Transient absorption spectra of cavity-free CdTe pure QD solid system. (a, b) Comparison of transient absorption spectra of CdTe pure system for 1 h and 3 h samples under 400 nm non-resonant excitation for different time delay times (− 0.25 ps to 7 ns for 1 h). The curves of different colours mean different time delays. For different time delays, the differential absorption is on the y-axis. The figure also shows the time delay values. (c, d) Contour plot of the corresponding 1 h and 3 h systems depicting the 1S bleach dynamics in both samples. (e, f) The corresponding Transient Kinetic spectra traces at 494 nm for the 1 h sample and at 543 nm for the 3 h sample.
Figure 8
Figure 8
Transient absorption spectra of cavity-coupled AgTe/CdTe QD solids. Transient absorption spectra measured at different pump energies from medium Ag concentration 7 h cavity coupled AgTe/CdTe QD solid sample corresponding to (a) 10 mJ/s and (b) 25 mJ/s for different time delays. The figure shows the 1S bleach with the corresponding contour plot. Due to the strong coupling of the plasmons and excitons, the bleach can be resolved into two components for both samples indicating the lower and upper polariton branches as shown in the magnified box (top right).
Figure 9
Figure 9
Kinetic traces of cavity-coupled AgTe/CdTe QD solids. Kinetic traces measured at different pump energies from medium Ag concentration from 3 h, 7 h, and 11 h cavity-coupled AgTe/CdTe QD coupled solid samples corresponding to (ac) 10 mJ/s and (df) 25 mJ/s. The trace on the top represents the fit obtained for the UP branch and the trace on the bottom represents the fit obtained for the LP branch. The kinetic fitting equation is given in Fig. S10.

References

    1. Vasa P. Strong light-matter interaction. Digital Encycl. Appl. Phys. 2019 doi: 10.1002/3527600434.eap828. - DOI
    1. Wang H, et al. Dynamics of strong coupling between CdSe quantum dots and surface plasmon polaritons in subwavelength hole array. J. Phys. Chem. Lett. 2016 doi: 10.1021/acs.jpclett.6b02059. - DOI - PubMed
    1. Pereira RMS, Borges J, Smirnov GV, Vaz F, Vasilevskiy MI. Surface plasmon resonance in a metallic nanoparticle embedded in a semiconductor matrix: Exciton-plasmon coupling. ACS Photon. 2019;6:204–210. doi: 10.1021/acsphotonics.8b01430. - DOI
    1. Rodarte AL, Tao AR. Plasmon-exciton coupling between metallic nanoparticles and dye monomers. J. Phys. Chem. C. 2017;121:3496–3502. doi: 10.1021/acs.jpcc.6b08905. - DOI
    1. Zhou N, Yuan M, Gao Y, Li D, Yang D. Silver nanoshell plasmonically controlled emission of semiconductor quantum dots in the strong coupling regime. ACS Nano. 2016 doi: 10.1021/acsnano.5b07400. - DOI - PubMed