. 2023 Oct 4;14(1):6197.
doi: 10.1038/s41467-023-41714-8.

Strain control of a bandwidth-driven spin reorientation in Ca3Ru2O7

Affiliations

Strain control of a bandwidth-driven spin reorientation in Ca3Ru2O7

C D Dashwood et al. Nat Commun. .

Abstract

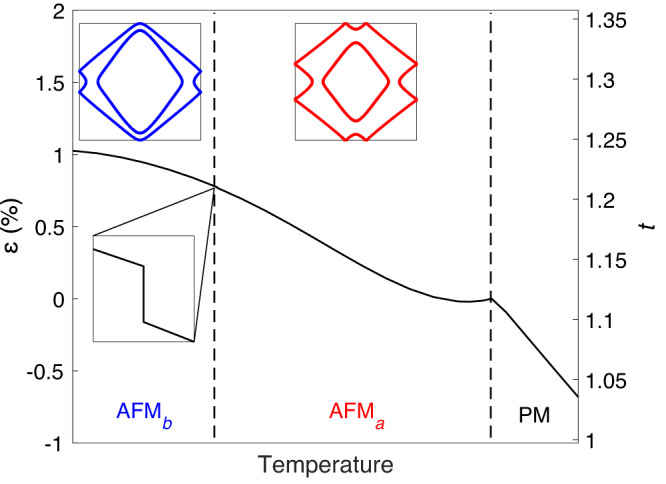
The layered-ruthenate family of materials possess an intricate interplay of structural, electronic and magnetic degrees of freedom that yields a plethora of delicately balanced ground states. This is exemplified by Ca3Ru2O7, which hosts a coupled transition in which the lattice parameters jump, the Fermi surface partially gaps and the spins undergo a 90 in-plane reorientation. Here, we show how the transition is driven by a lattice strain that tunes the electronic bandwidth. We apply uniaxial stress to single crystals of Ca3Ru2O7, using neutron and resonant x-ray scattering to simultaneously probe the structural and magnetic responses. These measurements demonstrate that the transition can be driven by externally induced strain, stimulating the development of a theoretical model in which an internal strain is generated self-consistently to lower the electronic energy. We understand the strain to act by modifying tilts and rotations of the RuO6 octahedra, which directly influences the nearest-neighbour hopping. Our results offer a blueprint for uncovering the driving force behind coupled phase transitions, as well as a route to controlling them.


Conflict of interest statement

The authors declare no competing interests.

Figures

Fig. 1
Fig. 1. Neutron scattering under stress.
a Schematic of the strain cell used in the neutron scattering experiment. The bridges of the cell and sample plates are shown in grey, and the sample is shown with a blue-to-yellow colourmap to indicate the strain gradient induced along its length. Neutrons are scattered in transmission through the central strained region of the sample. b Magnetic structure of Ca3Ru2O7 in the AFMa phase. c Integrated intensity of the commensurate (0, 0, 1) and incommensurate (δ, 0, 1) peaks as a function of applied strain, ΔL/L. The background signal comes from scattering from the strain cell, and errors are standard deviations. The insets show detector images at zero and maximum compressive/tensile applied strain. d Magnetic structure of Ca3Ru2O7 in the AFMb phase.
Fig. 2
Fig. 2. X-ray scattering under stress.
a Schematic of the strain cell used for x-ray scattering. The principles of operation are the same as the neutron setup, except that the sample is mounted on top of raised sample plates to give a large sphere of access for the incident and scattered beams. b 2θ scans of the structural (1, 0, 7) Bragg peak at various applied strains. c True strain, Δb/b, as a function of applied strain, ΔL/L, at a range of temperatures through the SRT. d Temperature dependences of the Poisson ratios determined from the relative strains along orthogonal axes. All errors are standard deviations.
Fig. 3
Fig. 3. Temperature-strain phase diagrams.
a, b Experimental phase diagrams for stress applied along the a- and b-axes respectively. The points with errors (standard deviations) are transition temperatures extracted from the strain measurements, and the squares indicate the zero-strain transition temperatures from ref. . The dashed lines are guides to the eye. The insets indicate the tensile strains induced along the orthogonal directions according to the Poisson ratios. c Theoretical phase diagram under applied strain εapp, calculated by self-consistently minimising the free energy in Eq. (2) using the parameter values U = 8, λ = 0.5, θ = 15, μ = 8.5, κ = 400, ν = 12, t0 = 1.12 and ε0 = 0.066.
Fig. 4
Fig. 4. Self-consistent internal strain.
Strain field, ε, as a function of temperature, with the magnetic phase transitions indicated by vertical dashed lines. The corresponding change in the effective nearest-neighbour hopping parameter, t, is measured on the right-hand axis. The zoomed region shows a small discontinuity in ε across the SRT of magnitude ∣Δε∣ ~ 0.005%. The insets show Fermi surfaces calculated in the two magnetic phases. The parameter values are the same as in Fig. 3c. The calculated value of the hopping parameter at the transition corresponds to U/t ~ 6.6, which is consistent with values of t and U previously fitted to the observed electronic structure of Ca3Ru2O7.
Fig. 5
Fig. 5. Octahedral tilt and rotation modes.
a Schematic of the tilt mode, consisting of staggered tilts of the RuO6 octahedra around the b-axis. b Schematic of the rotation mode, consisting of staggered rotations of the octahedra around the c-axis. c Temperature dependence of the lattice parameters of Ca3Ru2O7 from x-ray scattering, normalised to the values at 40.4 K. d Temperature dependence of the octahedral rotation and tilt amplitudes determined from a symmetry analysis of single-crystal neutron diffraction data, normalised to the values at 44 K. Errors are standard deviations.
Fig. 6
Fig. 6. Rotation- and tilt-dependence of hopping.
a, b Dependence of the in-plane nearest-neighbour hopping, t, between Ru dxz orbitals along x on the octahedral rotation angle, ϕ, and octahedral tilt angle, θ, respectively. The orbitals on the distorted Ru–O–Ru bond are shown in blue on the left side of each equation. Direct hopping is expressed in terms of Slater-Koster integrals, (llm), illustrated in red on the right side of each equation. The indirect hopping, due to π-bonding with oxygen p orbitals, is expressed in terms of (dpdπ), the dpd π-bonding integral on a straight Ru–O–Ru bond (also shown in red). All oxygen p orbitals are considered but only the pz orbital is shown for clarity. The coefficients in (b) are A(θ)=14cos(22θ)+4cos(2θ)1,B(θ)=cos3(2θ),C(θ)=14sin2(2θ)cos(22θ) and D(θ)=34sin2(2θ). Identical results are obtained for the hopping between dyz orbitals along y.

References

    1. Peierls, R. E. Quantum Theory of Solids, International Series of Monographs on Physics (Clarendon Press, Oxford, 1955).
    1. Fröhlich H. On the theory of superconductivity: the one-dimensional case. Proc. R. Soc. Lond. A. 1954;223:296.
    1. Kanamori J. Crystal distortion in magnetic compounds. J. App. Phys. 1960;31:S14.
    1. Cao Y, et al. Correlated insulator behaviour at half-filling in magic-angle graphene superlattices. Nature. 2018;556:80. - PubMed
    1. Cao Y, et al. Unconventional superconductivity in magic-angle graphene superlattices. Nature. 2018;556:43. - PubMed