

Disease-modifying therapies and features linked to treatment response in type 1 diabetes prevention: a systematic review
- PMID: 37794169
- PMCID: PMC10550983
- DOI: 10.1038/s43856-023-00357-y
Disease-modifying therapies and features linked to treatment response in type 1 diabetes prevention: a systematic review
Abstract
Background: Type 1 diabetes (T1D) results from immune-mediated destruction of insulin-producing beta cells. Prevention efforts have focused on immune modulation and supporting beta cell health before or around diagnosis; however, heterogeneity in disease progression and therapy response has limited translation to clinical practice, highlighting the need for precision medicine approaches to T1D disease modification.
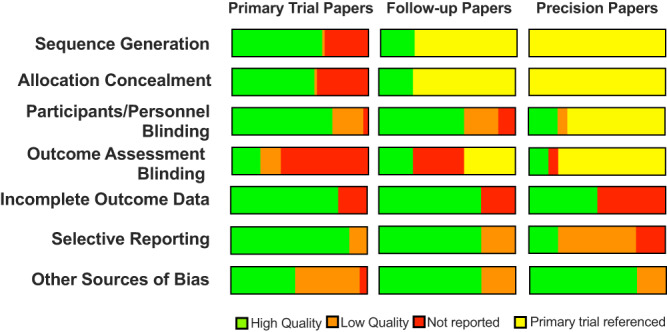
Methods: To understand the state of knowledge in this area, we performed a systematic review of randomized-controlled trials with ≥50 participants cataloged in PubMed or Embase from the past 25 years testing T1D disease-modifying therapies and/or identifying features linked to treatment response, analyzing bias using a Cochrane-risk-of-bias instrument.
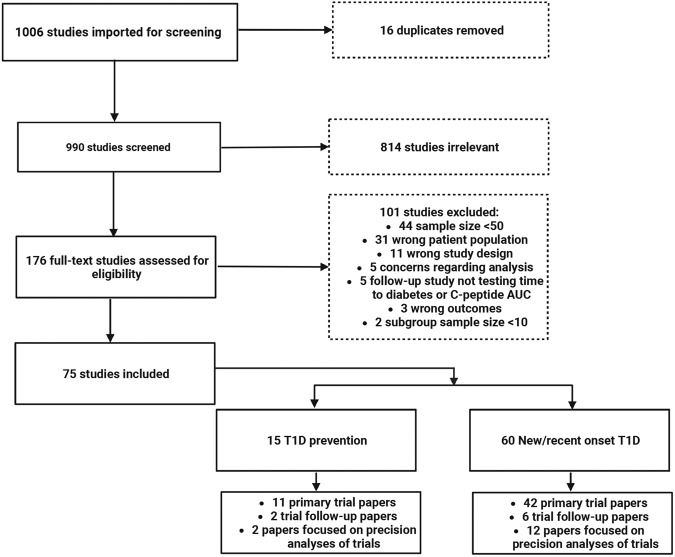
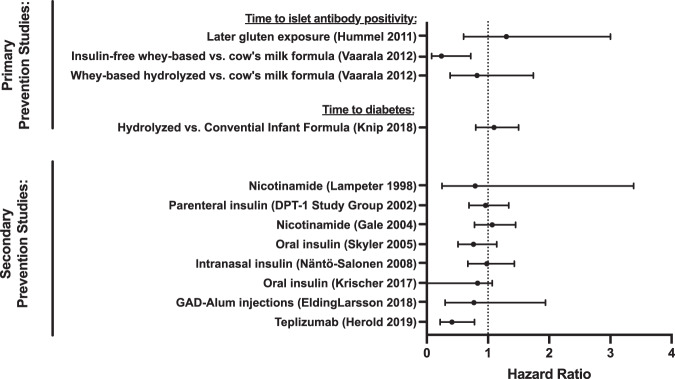
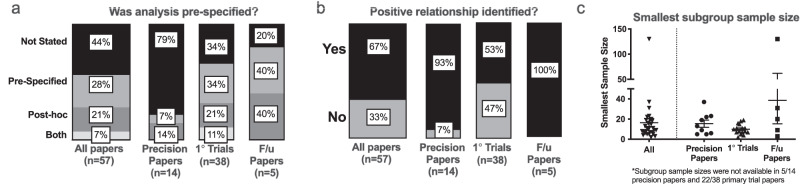
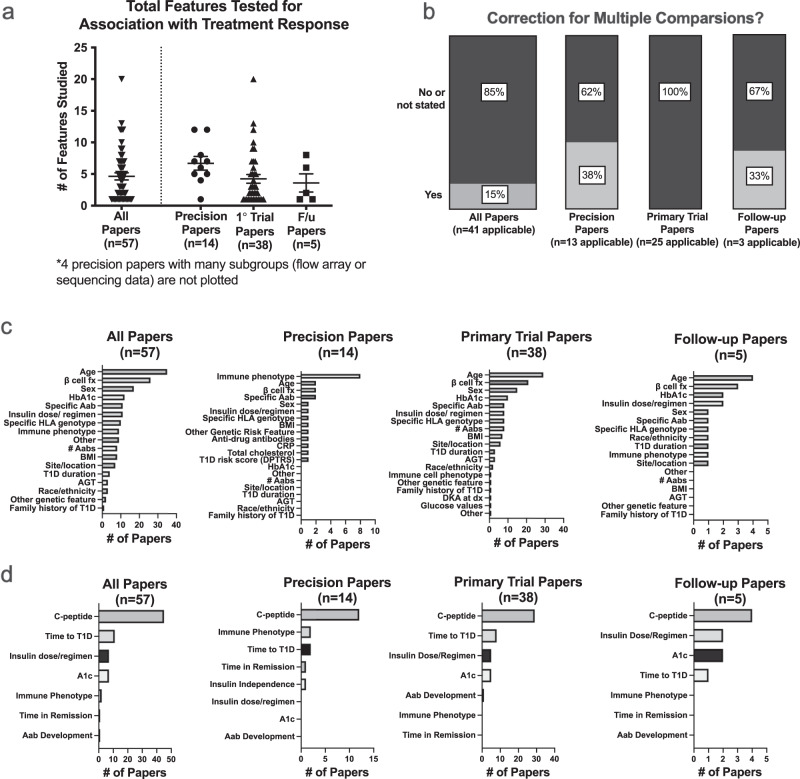
Results: We identify and summarize 75 manuscripts, 15 describing 11 prevention trials for individuals with increased risk for T1D, and 60 describing treatments aimed at preventing beta cell loss at disease onset. Seventeen interventions, mostly immunotherapies, show benefit compared to placebo (only two prior to T1D onset). Fifty-seven studies employ precision analyses to assess features linked to treatment response. Age, beta cell function measures, and immune phenotypes are most frequently tested. However, analyses are typically not prespecified, with inconsistent methods of reporting, and tend to report positive findings.
Conclusions: While the quality of prevention and intervention trials is overall high, the low quality of precision analyses makes it difficult to draw meaningful conclusions that inform clinical practice. To facilitate precision medicine approaches to T1D prevention, considerations for future precision studies include the incorporation of uniform outcome measures, reproducible biomarkers, and prespecified, fully powered precision analyses into future trial design.
Plain language summary
Type 1 diabetes (T1D) is a condition that results from the destruction of a type of cell in the pancreas that produces the hormone insulin, leading to lifelong dependence on insulin injections. T1D prevention remains a challenging goal, largely due to the immense variability in disease processes and progression. Therapies tested to date in medical research settings (clinical trials) work only in a subset of individuals, highlighting the need for more tailored prevention approaches. We reviewed clinical trials of therapies targeting the disease process in T1D. While the overall quality of trials was high, studies testing individual features affecting responses to treatments were low. This review reveals an important need to carefully plan high-quality analyses of features that affect treatment response in T1D, to ensure that tailored approaches may one day be applied to clinical practice.
© 2023. Springer Nature Limited.
Conflict of interest statement
E.K.S. has received compensation for educational lectures from Medscape, ADA, and MJH Life Sciences and as a consultant for DRI Healthcare. C.E.M. reported serving on advisory boards for Provention Bio, Isla Technologies, MaiCell Technologies, Avotres, DiogenyX, and Neurodon; receiving in-kind research support from Bristol Myers Squibb and Nimbus Pharmaceuticals; and receiving investigator-initiated grants from Lilly Pharmaceuticals and Astellas Pharmaceuticals. L.A.D. reports research support to institutions from Dompe, Lilly, Mannkind, Provention, Zealand, and consulting relationships with Abata and Vertex. R.A.O. had a UK MRC Confidence in concept grant to develop a T1D GRS biochip with Randox Ltd and has ongoing research funding from Randox R & D. No other authors report any relevant conflicts of interest.
Figures
Update of
-
Type 1 Diabetes Prevention: a systematic review of studies testing disease-modifying therapies and features linked to treatment response.medRxiv [Preprint]. 2023 Apr 17:2023.04.12.23288421. doi: 10.1101/2023.04.12.23288421. medRxiv. 2023. Update in: Commun Med (Lond). 2023 Oct 5;3(1):130. doi: 10.1038/s43856-023-00357-y. PMID: 37131690 Free PMC article. Updated. Preprint.
References
-
- Pambianco G, et al. The 30-year natural history of type 1 diabetes complications: the Pittsburgh Epidemiology of Diabetes Complications Study experience. Diabetes. 2006;55:1463–1469. - PubMed
-
- Sussman M, Benner J, Haller MJ, Rewers M, Griffiths R. Estimated lifetime economic burden of type 1 diabetes. Diabetes Technol. Ther. 2020;22:121–130. - PubMed
Grants and funding
- U01 DK127786/DK/NIDDK NIH HHS/United States
- UC4 DK117483/DK/NIDDK NIH HHS/United States
- UL1 TR001108/TR/NCATS NIH HHS/United States
- R01 CA231226/CA/NCI NIH HHS/United States
- K12 DK133995/DK/NIDDK NIH HHS/United States
- R01 DK122586/DK/NIDDK NIH HHS/United States
- RG/17/12/33167/BHF_/British Heart Foundation/United Kingdom
- 210752/Z/18/Z/WT_/Wellcome Trust/United Kingdom
- MC_UU_00014/4/MRC_/Medical Research Council/United Kingdom
- R01 DK133881/DK/NIDDK NIH HHS/United States
- R01 DK121929/DK/NIDDK NIH HHS/United States
- R01 DK127308/DK/NIDDK NIH HHS/United States
- R01 HL149676/HL/NHLBI NIH HHS/United States
- UC4 DK104166/DK/NIDDK NIH HHS/United States
- R01 DK121843/DK/NIDDK NIH HHS/United States
- I01 BX001733/BX/BLRD VA/United States
- R01 DK124395/DK/NIDDK NIH HHS/United States
- R01 AI141952/AI/NIAID NIH HHS/United States
- R01 DK127236/DK/NIDDK NIH HHS/United States
- R03 DK127472/DK/NIDDK NIH HHS/United States
- U54 DK118638/DK/NIDDK NIH HHS/United States
- U01 DK127382/DK/NIDDK NIH HHS/United States
- P30 DK097512/DK/NIDDK NIH HHS/United States
- K23 DK129799/DK/NIDDK NIH HHS/United States
- R01 DK093954/DK/NIDDK NIH HHS/United States
- IK2 CX002027/CX/CSRD VA/United States
LinkOut - more resources
Full Text Sources
Miscellaneous
