. 2023 Oct;622(7982):339-347.
doi: 10.1038/s41586-023-06547-x. Epub 2023 Oct 4.

Rare variant associations with plasma protein levels in the UK Biobank

Collaborators, Affiliations

Rare variant associations with plasma protein levels in the UK Biobank

Ryan S Dhindsa et al. Nature. 2023 Oct.

Abstract

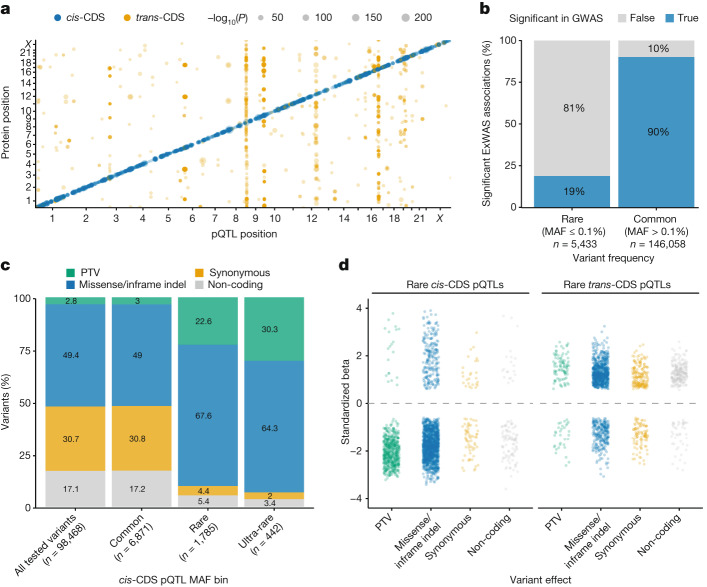
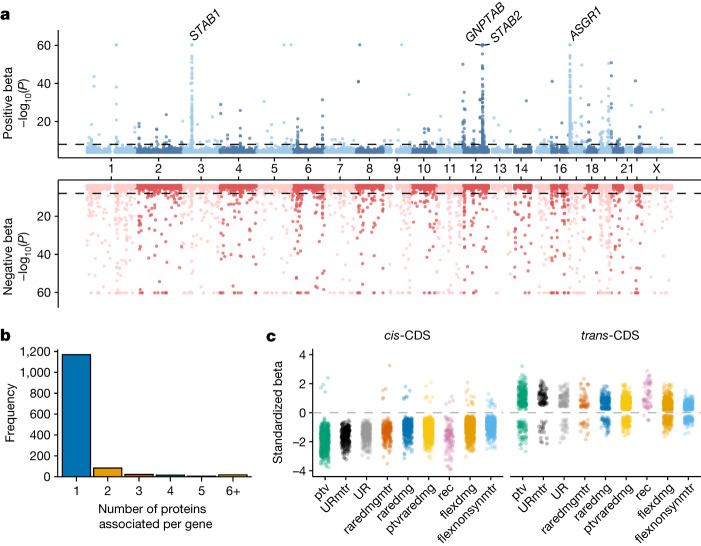
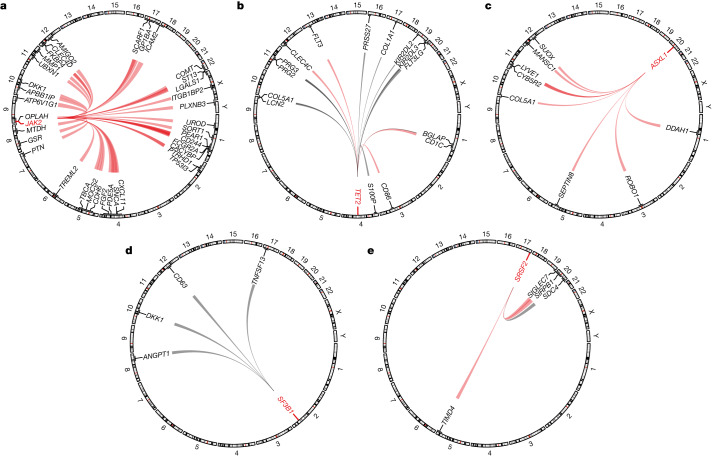
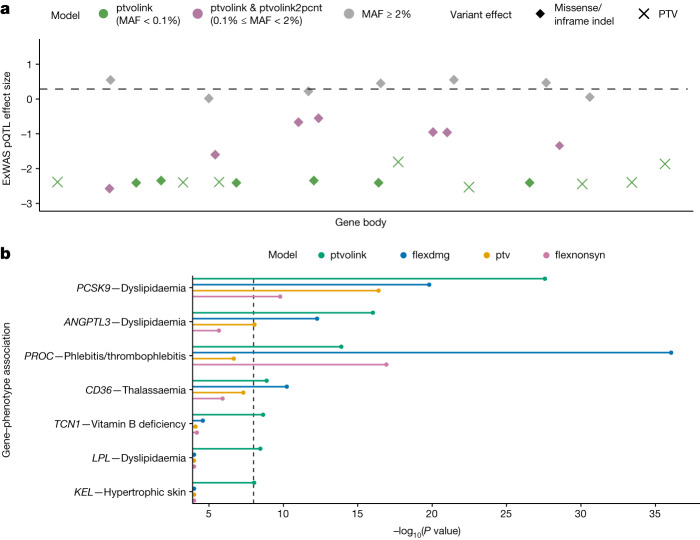
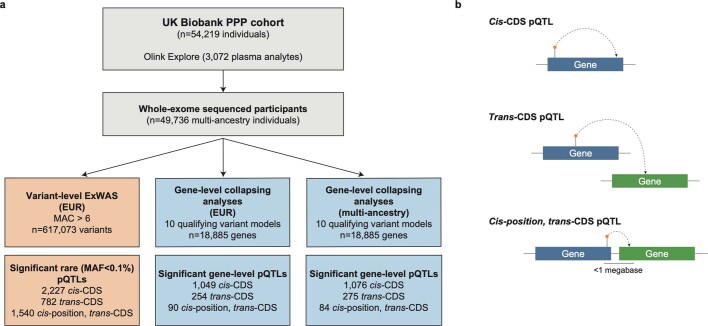
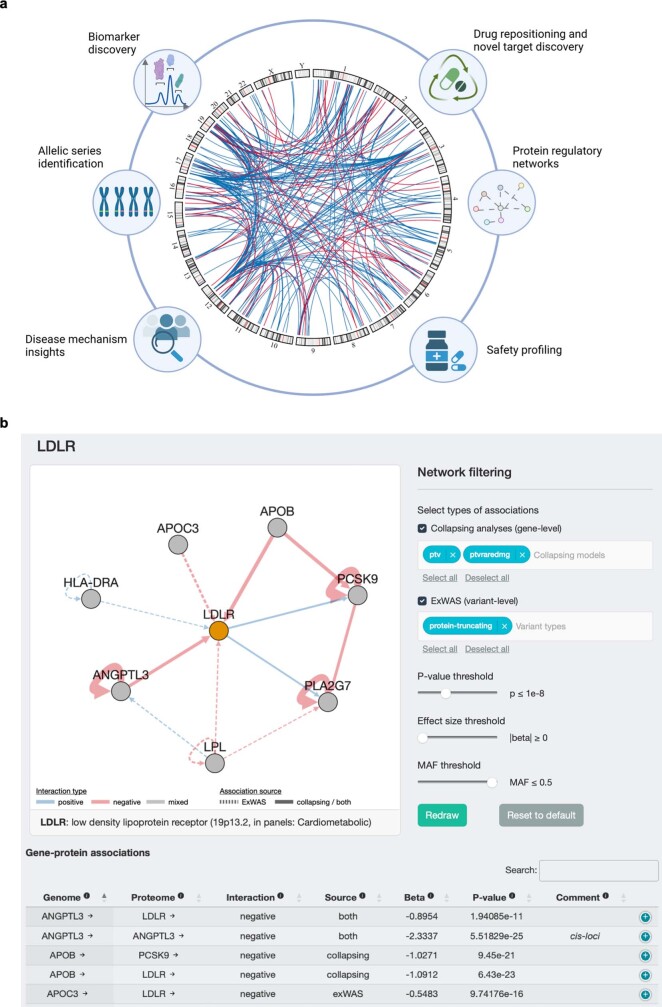
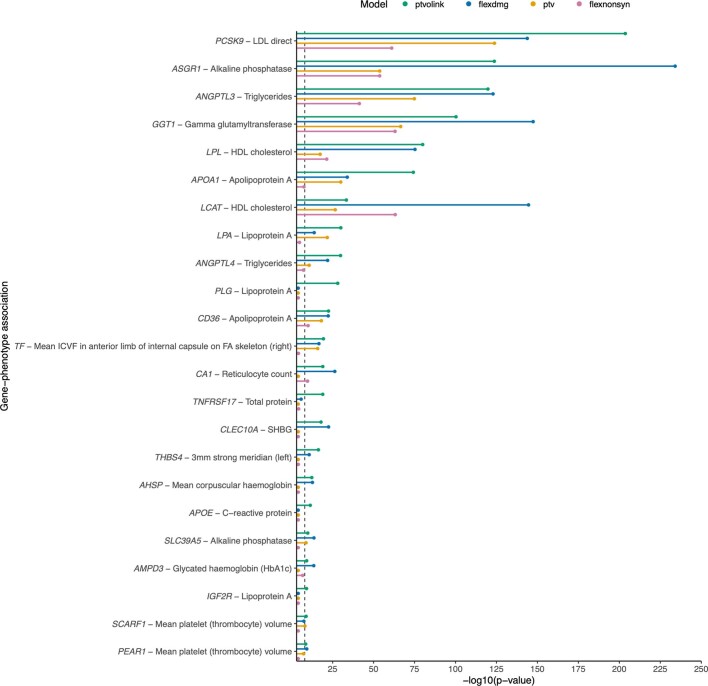
Integrating human genomics and proteomics can help elucidate disease mechanisms, identify clinical biomarkers and discover drug targets1-4. Because previous proteogenomic studies have focused on common variation via genome-wide association studies, the contribution of rare variants to the plasma proteome remains largely unknown. Here we identify associations between rare protein-coding variants and 2,923 plasma protein abundances measured in 49,736 UK Biobank individuals. Our variant-level exome-wide association study identified 5,433 rare genotype-protein associations, of which 81% were undetected in a previous genome-wide association study of the same cohort5. We then looked at aggregate signals using gene-level collapsing analysis, which revealed 1,962 gene-protein associations. Of the 691 gene-level signals from protein-truncating variants, 99.4% were associated with decreased protein levels. STAB1 and STAB2, encoding scavenger receptors involved in plasma protein clearance, emerged as pleiotropic loci, with 77 and 41 protein associations, respectively. We demonstrate the utility of our publicly accessible resource through several applications. These include detailing an allelic series in NLRC4, identifying potential biomarkers for a fatty liver disease-associated variant in HSD17B13 and bolstering phenome-wide association studies by integrating protein quantitative trait loci with protein-truncating variants in collapsing analyses. Finally, we uncover distinct proteomic consequences of clonal haematopoiesis (CH), including an association between TET2-CH and increased FLT3 levels. Our results highlight a considerable role for rare variation in plasma protein abundance and the value of proteogenomics in therapeutic discovery.


Conflict of interest statement

R.S.D., O.S.B., B.P.P., D. Matelska, E.W., J.M., E.O., V.A.H., K.R.S., K.C., S.W., A.R.H., D.S.P., M.A.F., C.V., B.C., A.P., D.V., M.N.P., Q.W. and S.P. are current employees and/or stockholders of AstraZeneca. B.B.S., C.D.W. and H.R. are employees and/or stockholders of Biogen. E.A.A. is a founder of Personalis, Inc., DeepCell, Inc. and Svexa Inc.; a founding advisor of Nuevocor; a non-executive director at AstraZeneca; and an advisor to SequenceBio, Novartis, Medical Excellence Capital, Foresite Capital and Third Rock Ventures.

Figures

Fig. 1
Fig. 1. ExWAS.
a, Summary of significant (P ≤ 1 × 10−8) cis- and trans-pQTLs across the exome, limited to variants with MAF ≤ 0.1%. P values were generated via linear regression. If multiple variants in a gene were associated with the same protein, we displayed the most significant association for ease of visualization. The P values were not corrected for multiple testing; the study-wide significance threshold is P ≤ 1 × 10−8. b, Percentage of significant rare (MAF ≤ 0.1%) and common (MAF > 0.1%) ExWAS genotype–protein associations that were also significant in the UKB-PPP GWAS. c, The proportion of significant cis-CDS pQTLs per variant class across three MAF bins. ‘All tested variants’ refers to the total number of variants occurring in the genes corresponding to the proteins measured via the Olink platform that were included in the ExWAS. d, Effect sizes of significant rare pQTLs in each variant class. For all plots, if the same genotype–protein association was detected in multiple ExWAS models, we retained the association with the smallest P value.
Fig. 2
Fig. 2. Gene-level collapsing analysis.
a, Miami plot of 1,962 unique gene–protein abundance associations across nine collapsing models. We excluded the empirical null synonymous model. The y axis is capped at 60. If the same gene–protein association was detected in multiple QV models, we retained the association with the smallest P value. The four labelled loci indicate trans-CDS pQTL hotspots. P values were generated via linear regression and were not corrected for multiple testing; the study-wide significance threshold is P ≤ 1 × 10−8. b, The number of unique significant (P ≤ 1 × 10−8) protein abundance associations per gene across the collapsing models. c, The effect sizes of significant gene–protein associations in each collapsing model are stratified by cis versus trans effects.
Fig. 3
Fig. 3. CH trans-CDS pQTL associations.
ae, Significant (P ≤ 1 × 10−8) trans-CDS pQTLs associated with somatic mutations in JAK2 (a), TET2 (b), ASXL1 (c), SF3B1 (d) and SRSF2 (e). Red lines indicate positive betas and black lines indicate negative betas. Line width is proportional to the absolute beta. We plotted significant associations for each gene in any of the four CH collapsing models.
Fig. 4
Fig. 4. pQTL-informed collapsing analyses.
a, Schematic representing the pQTL-informed collapsing framework. The purple diamonds represent missense pQTLs that would be included as QVs in the ptvolink model and ptvolink2pcnt model. PTVs, illustrated as X’s, are included in both models. b, The P values of gene-level associations for binary traits in which the P values improved in the ptvolink model compared with the ptv model. For comparison, we also include P values for the flexdmg model, which includes PTVs and rare (MAF < 0.1%) missense variants predicted to be damaging via REVEL (REVEL > 0.25), and the flexnonsyn model, which includes PTVs and missense variants without a REVEL cut-off. Only three genes that reached significance in the flexdmg model were not among the 25 genes significant across both ptvolink models. Of these, two were already captured by the standard ptv model. P values were generated via a two-tailed Fisher’s exact test and were not corrected for multiple testing. The dashed line indicates the study-wide significance threshold of P ≤ 1 × 10−8.
Extended Data Fig. 1
Extended Data Fig. 1. Study design.
(a) Schematic depicting the overall study design and sample sizes for the variant-level ExWAS and the gene-level collapsing analyses. The number of significant gene-level pQTLs corresponds to the number of unique genes associated with at least one protein abundance. (b) Depiction of cis-, trans-, and cis-position trans-CDS pQTLs.
Extended Data Fig. 2
Extended Data Fig. 2. ExWAS pQTL effect sizes.
(a) Effect size distributions of cis- versus trans-CDS pQTLs stratified by allele frequency. (b) Effect sizes of rare (MAF ≤ 0.1%) pQTLs.
Extended Data Fig. 3
Extended Data Fig. 3. Missense cis-CDS pQTLs.
(a) Enrichment of ClinVar pathogenic and likely pathogenic (P/LP) variants among missense cis-CDS pQTLs. P-values calculated via two-tailed binomial test and are uncorrected. (b) REVEL scores of cis-CDS missense pQTLs. P-values were calculated with the Mann-Whitney U test (two-sided) and are not corrected for multiple testing. The appropriate Bonferroni-adjusted p-value threshold is p < 0.017. The boxplots show the median (centre line) and interquartile ranges (IQR) (box limits).
Extended Data Fig. 4
Extended Data Fig. 4. Overlap between pQTLs detected in the ExWAS and collapsing analysis.
(a) Number of unique gene-phenotype associations among non-synonymous pQTLs in the ExWAS versus the collapsing analysis. (b) Number of unique gene-phenotype associations among rare (MAF ≤ 0.1%) PTV-driven pQTLs in the ExWAS and ptv collapsing model.
Extended Data Fig. 5
Extended Data Fig. 5. pQTL atlas and interactive browser.
(a) Illustration of potential applications of this trans-CDS pQTL atlas to drug development. The chord diagram represents trans-CDS pQTLs detected in the collapsing analysis (p ≤ 1 × 10−8). Created using biorender.com (b) The AstraZeneca pQTL browser, highlighting LDLR as an example query. Users can browse pQTLs from both the ExWAS and gene-based collapsing analyses using an intuitive range of parameters and thresholds.
Extended Data Fig. 6
Extended Data Fig. 6. pQTL-informed collapsing analyses.
The p-values of gene-level associations for quantitative traits in which the p-values improved in the ptvolink model compared to the ptv model. For comparison, we also include p-values for the flexdmg model, which includes PTVs and rare (MAF < 0.1%) missense variants predicted to be damaging via REVEL (REVEL > 0.25), and the flexnonsyn model, which includes PTVs and missense variants without a REVEL cutoff. An additional 17 genes were not among the 87 significantly associated genes in the ptvolink models, and only 9 of these were not already captured by the ptv model. P-values were generated via linear regression and were not corrected for multiple testing. The dashed line indicates the study-wide significance threshold of p ≤ 1 × 10-8.

References

    1. Suhre K, McCarthy MI, Schwenk JM. Genetics meets proteomics: perspectives for large population-based studies. Nat. Rev. Genet. 2021;22:19–37. doi: 10.1038/s41576-020-0268-2. - DOI - PubMed
    1. Zheng J, et al. Phenome-wide Mendelian randomization mapping the influence of the plasma proteome on complex diseases. Nat. Genet. 2020;52:1122–1131. doi: 10.1038/s41588-020-0682-6. - DOI - PMC - PubMed
    1. Pietzner M, et al. Mapping the proteo-genomic convergence of human diseases. Science. 2021;374:eabj1541. doi: 10.1126/science.abj1541. - DOI - PMC - PubMed
    1. Png G, et al. Mapping the serum proteome to neurological diseases using whole genome sequencing. Nat. Commun. 2021;12:7042. doi: 10.1038/s41467-021-27387-1. - DOI - PMC - PubMed
    1. Sun, B. B. et al. Plasma proteomic associations with genetics and health in the UK Biobank. Nature10.1038/s41586-023-06592-6 (2023). - PMC - PubMed

Publication types