Comparative Study
. 2023 Oct;622(7984):850-862.
doi: 10.1038/s41586-023-06575-7. Epub 2023 Oct 4.

The PTPN2/PTPN1 inhibitor ABBV-CLS-484 unleashes potent anti-tumour immunity

Christina K Baumgartner #  1 Hakimeh Ebrahimi-Nik #  2   3   4 Arvin Iracheta-Vellve  2   3   5 Keith M Hamel  6 Kira E Olander  2   3 Thomas G R Davis  2   3 Kathleen A McGuire  6 Geoff T Halvorsen  6 Omar I Avila  2   3 Chirag H Patel  7 Sarah Y Kim  2   3 Ashwin V Kammula  2   3 Audrey J Muscato  2   3 Kyle Halliwill  8 Prasanthi Geda  6   9 Kelly L Klinge  6 Zhaoming Xiong  6   10 Ryan Duggan  6 Liang Mu  6 Mitchell D Yeary  2   3 James C Patti  2   3 Tyler M Balon  2   3 Rebecca Mathew  8 Carey Backus  8 Domenick E Kennedy  6 Angeline Chen  6 Kenton Longenecker  6 Joseph T Klahn  6 Cara L Hrusch  6 Navasona Krishnan  6   11 Charles W Hutchins  6 Jax P Dunning  6 Marinka Bulic  6 Payal Tiwari  2   3   12 Kayla J Colvin  2   3 Cun Lan Chuong  2   3 Ian C Kohnle  2   3 Matthew G Rees  2 Andrew Boghossian  2 Melissa Ronan  2 Jennifer A Roth  2 Meng-Ju Wu  2   3 Juliette S M T Suermondt  2   3 Nelson H Knudsen  2   3 Collins K Cheruiyot  2   3 Debattama R Sen  3 Gabriel K Griffin  2   12 Todd R Golub  2   12 Nabeel El-Bardeesy  3 Joshua H Decker  6 Yi Yang  6 Magali Guffroy  6 Stacey Fossey  6 Patricia Trusk  6 Im-Meng Sun  7 Yue Liu  7 Wei Qiu  6 Qi Sun  6 Marcia N Paddock  7 Elliot P Farney  6 Mark A Matulenko  6 Clay Beauregard  7   13 Jennifer M Frost #  14 Kathleen B Yates #  15   16 Philip R Kym #  17 Robert T Manguso #  18   19
Affiliations
Comparative Study

The PTPN2/PTPN1 inhibitor ABBV-CLS-484 unleashes potent anti-tumour immunity

Christina K Baumgartner et al. Nature. 2023 Oct.

Abstract

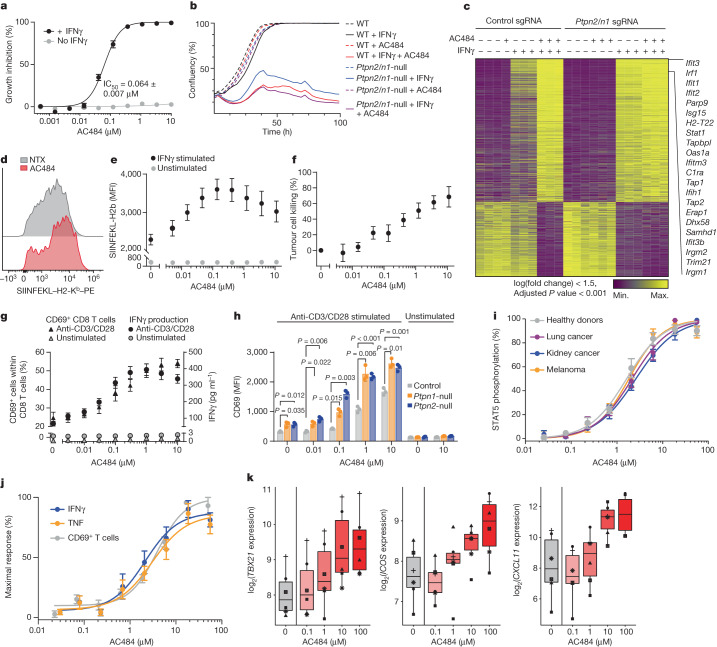
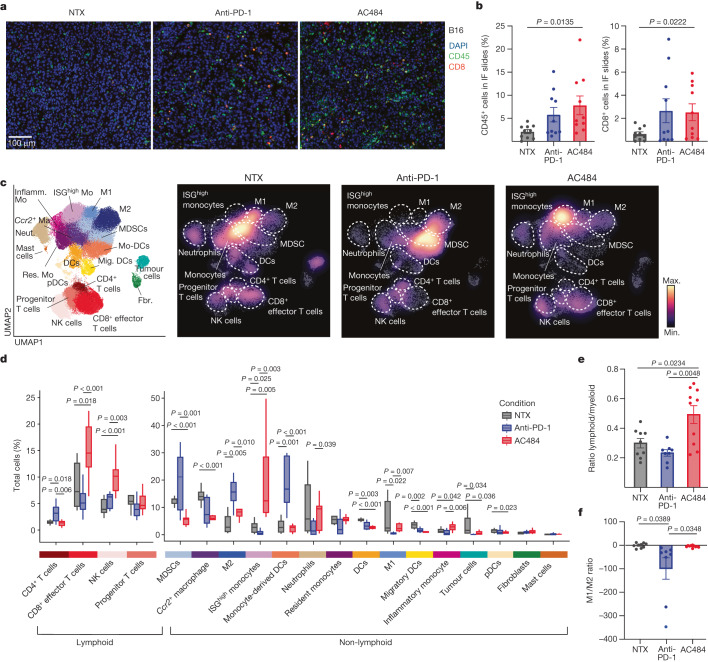
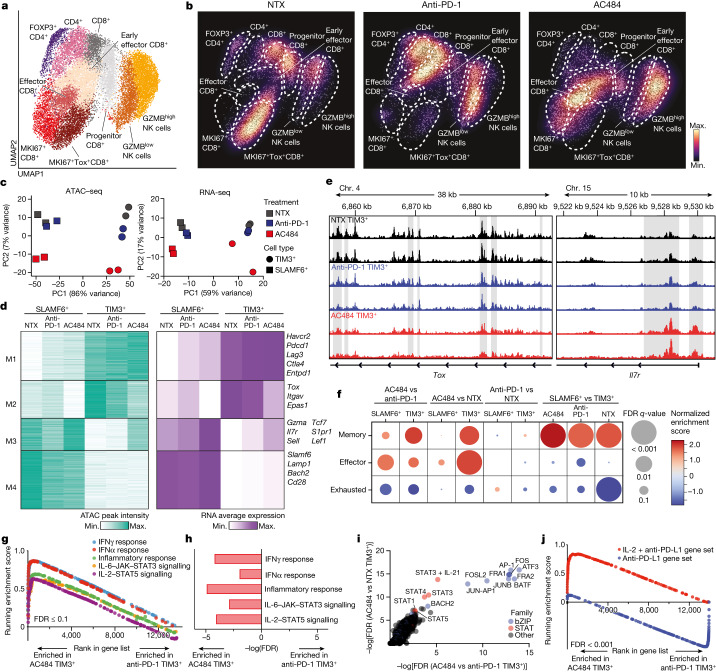
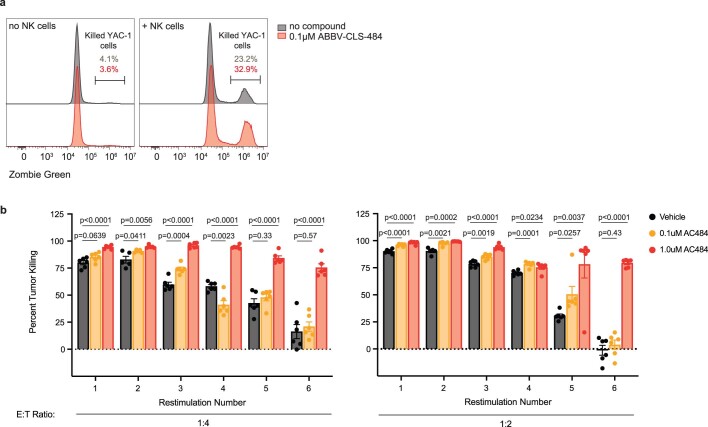
Immune checkpoint blockade is effective for some patients with cancer, but most are refractory to current immunotherapies and new approaches are needed to overcome resistance1,2. The protein tyrosine phosphatases PTPN2 and PTPN1 are central regulators of inflammation, and their genetic deletion in either tumour cells or immune cells promotes anti-tumour immunity3-6. However, phosphatases are challenging drug targets; in particular, the active site has been considered undruggable. Here we present the discovery and characterization of ABBV-CLS-484 (AC484), a first-in-class, orally bioavailable, potent PTPN2 and PTPN1 active-site inhibitor. AC484 treatment in vitro amplifies the response to interferon and promotes the activation and function of several immune cell subsets. In mouse models of cancer resistant to PD-1 blockade, AC484 monotherapy generates potent anti-tumour immunity. We show that AC484 inflames the tumour microenvironment and promotes natural killer cell and CD8+ T cell function by enhancing JAK-STAT signalling and reducing T cell dysfunction. Inhibitors of PTPN2 and PTPN1 offer a promising new strategy for cancer immunotherapy and are currently being evaluated in patients with advanced solid tumours (ClinicalTrials.gov identifier NCT04777994 ). More broadly, our study shows that small-molecule inhibitors of key intracellular immune regulators can achieve efficacy comparable to or exceeding that of antibody-based immune checkpoint blockade in preclinical models. Finally, to our knowledge, AC484 represents the first active-site phosphatase inhibitor to enter clinical evaluation for cancer immunotherapy and may pave the way for additional therapeutics that target this important class of enzymes.


Conflict of interest statement

This manuscript stems from a collaboration between the Broad Institute, AbbVie and Calico Sciences. Equal financial support for the design and study conduct for this research were provided by AbbVie and Calico. R.T.M. and K.B.Y. receive research funding from Calico Life Sciences. C.K.B., K.M.H., K.A.M., K.H., K.L.K., R.D., L.M., R.M., C. Backus, D.E.K., A.C., J.T.K., C.L.H., C.W.H., J.P.D., M.B., J.H.D., Y.Y., M.G., S.F., P. Trusk, W.Q., Q.S., E.P.F., M.A.M., J.M.F. and P.R.K. are employees of AbbVie. P.G. was an employee of AbbVie at the time she contributed to the manuscript and is now an employee of Bristol Myers Squibb. Z.X. was an employee of AbbVie at the time he contributed to the manuscript and is now an employee of Ipsen Therapeutics. K.L. was an employee of AbbVie at the time he contributed to the manuscript. N.K. was an employee of AbbVie at the time he contributed to the manuscript and is now an employee of Pfizer. G.T.H. is a deceased author who was an employee of AbbVie at the time of the study. A.I.-V. was an employee of the Broad Institute at the time he contributed to the manuscript and is now an employee of Monte Rosa Therapeutics. M.N.P., C.H.P., I.-M.S. and Y.L. are employees of Calico Life Sciences. T.R.G. has paid scientific advisory roles and equity in Dewpoint Therapeutics and Anji Pharmaceuticals, holds founder’s equity in Sherlock Biosciences, is a paid advisor to Braidwell and has research funding from Bayer HealthCare, Calico Life Sciences and Novo Holdings. R.T.M. has received consulting or speaking fees from Bristol Myers Squibb, Gilead Sciences and Immunai Therapeutics, has equity ownership in OncoRev, and receives research funding from Calico Life Sciences. C. Beauregard was an employee of Calico Life Sciences at the time he contributed to the manuscript and is now an employee of Vir Biotechnology. AbbVie, Calico Life Sciences and the Broad Institute participated in the interpretation of data, review and approval of the publication. The remaining authors declare no competing interests.

Figures

Fig. 1
Fig. 1. The discovery of AC484, a PTPN2/N1 active-site inhibitor.
a, Structure of PTPN2, with blue indicating the basicity of the active site (using a pH scale of 0–14, with pH < 7 indicating acidic (red) and pH > 7 basic (blue); pH 7 is neutral (white)). b, AC484 (green) in the PTPN2 protein, coloured as in a. c, Crystal structure of AC484 in the active site of PTPN2. d, Structure of PTPN2/N1 inhibitors, including AC484. e, Impact of PTPN2/N1 inhibitors on IFNγ-mediated STAT1 phosphorylation in B16 tumour cells (n = 10 per inhibitor; mean ± s.e.m.). f, AC484 dose-escalating pharmacokinetics in mice at doses of 3, 10, 30 and 100 mg kg–1 with once-daily dosing (n = 3 per group; mean ± s.e.m.). Source data
Fig. 2
Fig. 2. AC484 increases mouse and human tumour cell sensitivity to IFNγ and enhances T cell activation and function in vitro.
a, Per cent growth inhibition of B16 tumour cells treated with AC484 with or without IFNγ (0.5 ng ml−1) (n = 5). b, In vitro growth curve of control and Ptpn2/n1-null B16 cells with or without AC484 (1 µM) and with or without IFNγ (10 ng ml−1) (n = 3). c, Heatmap showing transcriptional response to IFNγ (10 ng ml−1) in control or Ptpn2/n1-null B16 cells with or without AC484 (10 μM) treatment. d,e, IFNγ-induced antigen presentation on B16-OVA cells left untreated (NTX) or treated with AC484 (0.1 µM). Representative histograms (d) and MFI ± s.e.m. of SIINFEKL–H2-Kb (e, n = 6). f, OT-I T cell-mediated B16-OVA tumour cell killing (n = 3). g, Activation (per cent of CD69-expressing CD8+ T cells, n = 6) and IFNγ production (n = 8) of anti-CD3/CD28-stimulated splenic pan T cells isolated from C57BL/6N mice. h, CD69 expression (MFI) of control, Ptpn2-null and Ptpn1-null mouse CD8+ T cells with or without anti-CD3/CD28 stimulation and with or without AC484. ik, AC484 pathway engagement and immune activation in human whole blood. i, pSTAT5 in whole blood from healthy donors (n = 8) and from patients with cancer (n = 5 per indication) stimulated with IL-2. j, Normalized frequency of CD69-expressing T cells (n = 4) and IFNγ and TNF production (n = 5) in TCR-stimulated whole blood from healthy donors. k, Gene expression for top differentially expressed genes in PBMCs from TCR-stimulated healthy donor whole blood (n = 6). The relationship between dose and gene expression is significant (P < 0.05) for all genes. Error bars represent the mean ± s.e.m. Source data
Fig. 3
Fig. 3. Systemic administration of AC484 induces immune-dependent tumour regression in various syngeneic and metastatic mouse models.
a, Tumour growth over time of B16 melanoma, KPC pancreatic cancer, and 4T1 and EMT-6 breast cancer tumours in AC484-treated (red), anti-PD-1-treated (blue) or control animals (black) (n = 5–10 animals per group, data are the mean ± s.e.m.). b, Tumour growth over time of CT26 colon cancer tumours in AC484-treated (red), anti-PD-1-treated (blue) AC484-treated and anti-PD-1-treated (purple) or control animals (black) (n = 10 animals per group, data are the mean ± s.e.m., statistics calculated as per cent tumour growth inhibition) c, Representative luciferase imaging at day 17 after challenge (left), tumour growth over time (middle) and survival analysis (right) of B16 metastasis model mice in AC484-treated (red), anti-PD-1-treated (blue) or control animals (black) (n = 10 per group). d, Tumour growth over time for KPC tumours in WT mice with or without AC484 (n = 10, n = 5, respectively), and for NSG mice with or without AC484 (n = 10, n = 5, respectively). e, Tumour growth over time for control of Ptpn2/n1-null B16 tumours treated with GVAX with or without AC484 (n = 5 animals per group, data are the mean ± s.e.m.). f, Tumour growth over time for KPC tumours treated with an isotype antibody (n = 10), anti-CD8b (n = 10) or an anti-NK1.1 depleting antibody (n = 10) and treated with AC484 (red) compared with an untreated control group (n = 10; black). g, Tumour growth over time for Jak1-null KPC tumours treated with isotype antibody (n = 5), anti-CD8b (n = 10) or anti-NK1.1 depleting antibody (n = 10) and treated with AC484 (red) compared with an untreated control group (n = 10; black). Source data
Fig. 4
Fig. 4. AC484 inflames the TME.
a, Immunofluorescence (IF) microscopy of representative formalin-fixed paraffin-embedded tumour sections from B16 untreated, anti-PD-1-treated or AC484-treated tumours. Staining: DAPI, blue; CD45, green; CD8, red. b, Quantification of CD45+ (left) and CD8+ (right) cells from B16 tumours from a. c, Uniform manifold approximation and projection (UMAP) of 68,060 cells and 21 distinct clusters identified among CD45+-enriched immune cells (left). Cell density projections by condition (right). DCs, dendritic cells; Fbr., fibroblasts; Inflamm., inflammatory; Ma, macrophage; Mig. DCs, migratory DCs; Mo, monocyte; Mo-DCs, monocyte-derived DCs; Neut., neutrophil; pDCs, plasmacytoid DCs. d, Box plots of proportional changes by cluster of CD45+-enriched immune cells by treatment. e, Ratio of cells belonging to lymphoid-derived clusters versus myeloid-derived clusters by condition. f, Directional ratio of cells belonging to clusters identified as M1 macrophages versus M2 macrophages by condition. Source data
Fig. 5
Fig. 5. Systemic administration of AC484 in mice enhances IL-2–pSTAT5 signalling in the TME and induces a distinct T cell differentiation state.
a, UMAP of 20,035 re-clustered lymphoid cells that belonged to clusters identified in the original projection as expressing transcripts for Cd8a, Ncr1 or Cd4. b, Cell density projections by condition. c, PCA of ATAC–seq and RNA-seq samples. d, Unbiased K-means clustering of normalized peak intensity for differential OCRs (left). Average normalized mRNA expression of genes adjacent to peaks in each module (right). In both plots, values represent the average of two replicates. e, ATAC–seq tracks of the Tox and Il7r loci for TIM-3+ samples. Grey shaded regions are significantly differential between conditions. Two replicates shown per condition. f, Heatmap of RNA-seq-derived GSEA for memory, effector and exhausted CD8+ T cell gene sets (Methods) in all relevant pairwise comparisons. g, RNA-seq-derived GSEA of hallmark IFNγ, IFNα and inflammatory response, and IL-6–JAK–STAT3 and IL-2–STAT5 signalling gene sets significantly enriched in AC484 TIM-3+ compared with anti-PD-1 TIM-3+ samples. False discovery rate (FDR) for all was <0.1. h, Differential enrichment measured by hypergeometric test of hallmark gene sets in adjacent genes of differential OCRs between AC484 TIM-3+ and anti-PD-1 TIM-3+ conditions. i, TF motif enrichment analysis (Methods) of differential OCRs in AC484-treated TIM-3+ T cells relative to control (y axis) or anti-PD-1 (x axis) treated TIM-3+ samples. –log(FDR) values calculated using binomial tests are plotted on the axes. j, GSEA of IL-2 and anti-PD-L1 and of anti-PD-L1 gene sets (data are from ref. ) between AC484 TIM-3+ and anti-PD-1 TIM-3+ RNA-seq. FDR for both was <0.001. Source data
Fig. 6
Fig. 6. AC484 induces potent NK and T effector cells.
ae, TIL analysis from untreated, anti-PD-1-treated or AC484-treated B16 tumours. a, Representative GZMB and CD8 staining on TCRb+ cells. b, Quantifications of flow cytometry analyses showing per cent of GZMB+ CD8+ T cells (left), ratio of FOXP3 CD4+ T cells to FOXP3+ CD4+ T cells (centre) and per cent of NK1.1+ cells among CD45+ cells (right). c, Representative CD8+ T cell TOX and TIM-3 staining. d, Quantification of TIM-3 and TOX MFI and percentage of TOX+TIM-3+ CD8+ T cells as in c. e, Histograms of total STAT5 and pSTAT5 staining (left) and relative pSTAT5/STAT5 levels in B16 TILs (right). f, pSTAT5 and STAT5 expression in naive T cells treated with IL-2 (100 ng ml−1), IFNγ (1 ng ml−1), AC484 (20 μM), AC484 and IL-2, or AC484 and IFNγ in vitro with or without anti-IL-2 (2 μg ml−1) and anti-CD132 (36 μg ml−1). g, Oxygen consumption rate over time (left) and mean oxygen consumption rate (right) in naive T cells stimulated with anti-CD3/CD28. FCCP, carbonyl cyanide p-trifluoromethoxyphenylhydrazone. h, Tumour growth (left) and survival (right) of EL4-OVA tumour-bearing mice adoptively transferred with OT-I CD8+ T cells expanded in vitro in IL-2 (10 ng ml−1) with or without AC484 (100 nM). i, GZMB MFI of primary mouse NK cells co-cultured with YAC-1 tumour cells with or without AC484 in vitro (n = 8). j, NK-mediated YAC-1 tumour cell killing with or without AC484 (n = 6). k, Experimental design of in vitro chronic antigen stimulation assay on primary mouse CD8+ T cells. l, TOX and PD-1 staining on chronically stimulated CD8+ T cells. m, Per cent of chronically stimulated CD8+ T cells expressing PD-1 and TOX (left) and IFNγ and TNF (right). n, B16-OVA tumour cell viability alone (purple) or co-cultured with acutely (black) or chronically stimulated OT-I CD8+ T cells treated with AC484 (red) or DMSO (grey). Relative cytotoxicity between AC484-treated or DMSO-treated chronically stimulated CD8+ T cells, normalized to acutely (1×) stimulated T cells (right). Source data
Extended Data Fig. 1
Extended Data Fig. 1. AC484 increases tumour cell sensitivity to IFNγ and immune cell activation in vitro.
a, IFNγ-induced growth inhibition of wildtype (WT) or Ptpn1-null or Ptpn2-null B16 tumour cell (n = 3 for each cell line). b, In vitro growth curve of control and Ptpn1-null (left) and Ptpn2-null (right) B16 cells ± AC484 (0.1 µM) and ± IFNγ (10 ng mL−1) (n = 2). c, PCA of top 500 highly variable genes from in vitro transcriptional profiling of B16 control or Ptpn2/n1-null cells ± IFNγ and ± AC484. d, GSEA of Hallmark TNFα signaling, IFNγ and IFNα response gene signatures in control or Ptpn2/n1-null B16 cells treated with AC484 (10 μM) incubated overnight in the presence of IFNγ (10 ng mL−1). e, Western blot for total and phosphorylated STAT1 protein in B16 cells that were stimulated for 16 h with IFNγ (100 ng mL−1) ± AC484 and then washed out of IFNγ and incubated for 4 h in AC484 only (where applicable). f, CXCL10 (blue) and CXCL9 (orange) production by IFNγ-treated B16 tumour cells (n ≥ 4). g, B16-OVA tumour cells that were pretreated with IFNγ and AC484 overnight and incubated with OT-I T cells. Percent IFNγ (blue) or TNFα (orange) producing OT-I T cells (n = 4). h, Viability at increasing doses of AC484 + IFNγ for the human cell line collection screened with the PRISM pipeline. i, PRISM screen cell lines ranked by their sensitivity to AC484 with and without IFNγ (1 ng mL−1). j, Heatmap showing viability across cancers from different tissue types in the PRISM platform against increasing doses of AC484 + IFNγ. k, PRISM screen cell lines ranked by their sensitivity to AC484 + IFNγ (1 ng mL−1) (top). Tracks show cell lines with mutations in IFNGR1, IFNGR2, JAK, or STAT genes and the enrichment of these mutations in cell lines that are more or less sensitive to AC484 + IFNγ (bottom). FDR for enrichment of mutant cell lines shown to the right. l, Pearson correlation of gene expression in PRISM cell lines with sensitivity to AC484 alone (top) and GSEA of these correlations (bottom). m, Activation (Percent CD25-expressing CD8 T cells, n = 6) and TNFα production (n = 8) of anti-CD3/CD28 stimulated primary splenic pan T cells isolated from C57BL/6N mice. n, TNFα production of anti-CD3/CD28 stimulated primary splenic CD4 T cells (left, n = 4) and CD8 T cells (right, n = 4) isolated from C57BL6J mice. o, Western blot for total LCK and pLCK in naive CD8 T cells stimulated with crosslinked anti-CD3 (2.5 μg mL−1) ± AC484 (20 μM) for 0, 5, 10, or 15 min. Quantification of pLCK expression normalized to total LCK at the right. p, Western blot for total FYN and pFYN in naive CD8 T cells stimulated with crosslinked anti-CD3 (2.5 μg mL−1) ± AC484 (20 μM) for 0, 5, 10, or 15 min. Quantification of pFYN expression normalized to total FYN at the right. q, Representative histogram (left) and quantification (right) for CFSE-labeled naïve CD44+CD8+ T cells from WT mouse spleen sub-optimally stimulated with plate-bound anti-CD3 (1 μg mL−1), soluble anti-CD28 (2 μg mL−1), IL-2 (100 ng mL−1), with or without AC484 (20 μM) for 96 h. T-cell proliferation (CFSE dilution) determined by flow cytometry. r-v, Representative raw data of AC484 human whole blood pathway engagement and immune activation. r, IFNγ-mediated STAT1 phosphorylation and IL-2-induced STAT5 phosphorylation in AC484-treated whole blood from one healthy donor assessed by flow cytometry. s, IFNγ-induced CXCL10 (IP10) production in whole blood from one healthy donor. t, IFNγ-induced STAT1 phosphorylation (pSTAT1) and CXCL10 (IP10) production in whole blood from healthy donors (left, n = 8) or cancer patients (right, CXCL10 n = 6, pSTAT1 n = 5). u, IFNγ and TNFα production following TCR stimulation with CytostimTM of whole blood from one healthy donor. v, Frequency of CD69-expressing T cells following TCR with CytostimTM of whole blood from one healthy donor. Source data
Extended Data Fig. 2
Extended Data Fig. 2. AC484 demonstrates dose-dependent immune activation and reversible immune infiltration of tissues in vivo.
a, Circulating chemokines (CXCL10, CXCL9, MIP-1b) and frequency of circulating Granzyme B expressing CD8+ T cells in MC38-tumour bearing mice after 8 days of dosing with 3, 10, and 100 mg/kg/day AC484. b, Weight change over time of B16 tumour-bearing C57BL/6J mice treated with AC484 (50, 100 or 150 mg/kg) compared with untreated controls. c, Inflammatory cell infiltrates in tissues of male rats dosed with AC484 for 28 days with resolution after a 28-day recovery period. Sections of kidney, liver, and femoro-tibial joint from animals administered vehicle, 15 mg/kg/day, or 300 mg/kg/day AC484 and from recovery animals previously administered 300 mg/kg/day AC484 as indicated. Source data
Extended Data Fig. 3
Extended Data Fig. 3. AC484 induces CD8+ T cell- and NK cell-mediated tumour regression in a variety of syngeneic and metastatic mouse models.
a, Survival analysis of animals bearing B16, KPC, 4T1, and EMT-6 tumours and treated with AC484 (red), anti-PD-1 (blue), or no treatment (black). Significance values reported for NTX v. AC484 in each. b, Survival analysis of animals bearing CT26 tumours and treated with AC484 (red), anti-PD-1 (blue), AC484 and anti-PD-1 (purple) or no treatment (black). Significance value reported for NTX vs. anti-PD-1 and AC484. c, Tumour growth over time and survival analysis of MC38 tumours in untreated or AC484-treated (1, 3, or 10 mg/kg) animals. Significance values reported for NTX vs. AC484 (3 mg/kg) and NTX vs. AC484 (10 mg/kg). d, Representative images of 4T1 lung metastases visualized in 15% India ink (left) and lung metastasis counts (right) for AC484-treated (20 mg/kg or 60 mg/kg) and vehicle-treated mice (n = 11-12 animals per group) on day 29 post-challenge e, Tumour growth over time and survival analysis for MC38 tumour-bearing mice treated with 20 mg/kg or 40 mg/kg doses of AC484 (left). Naive mice and mice that cleared tumours (cured) were rechallenged with MC38 tumour cells 1 year later. Bar plot showing tumour volumes on day 12 after rechallenge (right). f, Tumour growth over time for control or Jak1-null KPC tumours ± AC484 (n = 5–10 animals per group, data are mean ± SEM) g, Tumour growth over time for GVAX-treated B16 tumours treated with either isotype antibody (n = 10), anti-CD8 (αCD8, n = 10) or anti-NK depleting antibody (αNK1.1, n = 10), and treated with AC484 (red) compared to an untreated control group (n = 10; black). h, Tumour growth over time and survival analysis for B2m-null B16 tumours treated with AC484 (red) or untreated (black). i, Tumour growth over time for B2m-null KPC tumours treated with anti-NK depleting antibody (n = 10) or no depletion (n = 10) and treated with AC484 (red) compared to an untreated control group (n = 10; black). j, 4T1 lung metastasis counts for mice treated with either anti-CD8, anti-NK depleting antibody, or no depleting antibody, and treated with AC484 (red) compared to untreated control groups (black) (n = 11–23 animals per group). Source data
Extended Data Fig. 4
Extended Data Fig. 4. AC484 enhances the activation of immune cell subsets and promotes immune infiltration of tumours.
a, Immunofluorescence microscopy of representative FFPE tumour sections from KPC untreated, anti-PD-1- or AC484-treated tumours, CD45 (green); CD8 (red); DAPI (blue). b, Quantification of CD45+ (left) and CD8+ (right) cells from KPC tumours from (a). c, Barplot showing the average normalized infiltration distance of CD45+ and CD8+ cells from the tumour border in immunofluorescence stains of KPC and B16 tumours. Infiltration distances are normalized as a fraction of the maximal distance found in each tumour. d, Schematic representing experimental design for single cell RNA sequencing on tumour-infiltrating lymphocytes from B16 or KPC tumours from control (n = 9), anti-PD-1- (n = 8) or AC484-treated (n = 10) tumours; figure created with BioRender.com. e, UMAP projection showing adequate batch correction of all cells with KPC recovered cells colored orange (top) and B16 colored blue (bottom). f, Heatmap showing top 15 differentially expressed genes in each cluster by one vs. rest test with two representative genes from each cluster shown on the y axis. g, Directional ratio of MDSCs versus monocytes by condition. h, In vitro CD86 expression (n = 6, left) and CXCL9 production (n = 4, right) by BMDM ± IFNγ. i, In vitro MHC I (left), MHC II (middle) and CD86 (right) expression on CD103+ BMDC ± IFNγ (n = 4). j, In vitro CXCL9 (left) and CXCL10 (right) production in CD103+ BMDC ± IFNγ (n = 4). k, In vitro IL12p70 and TNFα production by CD103+ BMDC ± IFNγ + anti-CD40 (αCD40, n = 4). Source data
Extended Data Fig. 5
Extended Data Fig. 5. AC484 inflames the TME and enhances the repertoire of the tumor-directed T cell response.
a, Top positively or negatively enriched Hallmark gene signatures determined by GSEAPreranked on differentially expressed genes calculated by a logistic regression by condition. Dotted lines indicate FDR < 0.25. b, UMAP projections downsampled by condition of the Hallmark IFNγ Response gene set and T cell Inflamed Signature (left) (Methods). Violin plots showing quantification by condition, statistical significance <0.05 in an independent t test (right). c, Heatmap showing averaged pseudobulk expression of key pro-inflammatory and anti-inflammatory cytokines and chemokines and antigen processing-related genes by model. d, Number of 7–11 amino acid length peptides presented on MHC I of B16 tumour cells treated in vitro overnight with DMSO as control, 0.3 μM AC484 alone, 0.5 ng/mL IFNγ alone, and 0.5 ng/mL IFNγ + 0.3 μM AC484. e, Counts of unique CDR3 sequences captured in targeted PCR of α and β TCR transcript from bulk RNA of B16 untreated (n = 14), anti-PD-1 (n = 15), and AC484 (n = 15) treated tumours. f, Quantification of the number of clusters or recognition groups found in each replicate (left) and number of unique CDR3s per each cluster by replicate (right). g, CDR3 sequences amplified from B16 untreated, AC484, or anti-PD-1-treated tumours clustered by GLIPH2 into proposed antigen recognition groups, number of clusters (left) and unique CDR3 sequences per cluster (right). Source data
Extended Data Fig. 6
Extended Data Fig. 6. AC484 induces a unique CD8+ effector T cell state.
a, Heatmap showing top 15 differentially expressed genes in each cluster by one vs. rest test with representative genes from each cluster shown on the y axis. b, Relative expression of lineage and CD8+ T cell subset markers among re-clustered lymphoid cells expressing Cd8a, Ncr1, or Cd4 from Fig. 5a. c, Box plots of proportional changes by cluster of lymphoid cells by treatment. d, UMAP projections showing capture and expression of Gzmb (top), Prf1 (middle) and Ifng (bottom), downsampled for an equal number of cells across conditions. e, Bar plot showing scoring of a previously published effector T cell geneset (GSE9650_NAIVE_VS_EFF_CD8_TCELL_DN) in all clusters with captured Cd8a transcript averaged by replicate (left). Bar plot showing scoring of the Hallmark IL-2/STAT5 Signaling gene set in all clusters with captured Cd8a transcript averaged by replicate (right). Source data
Extended Data Fig. 7
Extended Data Fig. 7. AC484 induces transcriptional and epigenetic programs that promote effector function and reduce T cell exhaustion.
a, Schematic representing experimental design for ATAC-seq and RNAseq sequencing of tumour-infiltrating lymphocytes from B16 tumours from untreated (n = 14), anti-PD-1- (n = 14) or AC484-treated (n = 19) mice; figure created with BioRender.com. b, Number of called peaks for each sample condition (Methods). c, Number of differential open chromatin regions between conditions (FDR < 0.05). Top row shows the comparison of AC484 SLAMF6+ vs anti-PD-1 SLAMF6+. Bottom row shows the comparison of NTX SLAMF6+ vs NTX TIM-3+. Color denotes the condition in which regions are differentially open. d, ATAC-seq tracks of the Gzma, Sell, and Tcf7 loci for TIM-3+ samples. Gray shaded regions are significantly differential between conditions. Two replicates shown per condition. e, Average normalized mRNA expression for genes called out in Fig. 5d. Colors are scaled per each column individually. f, Differential enrichment calculated by hypergeometric test of IL-2+anti-PD-L1 and anti-PD-L1 genesets in adjacent genes of differential OCRs between AC484 TIM-3+ and anti-PD-1 TIM-3+. Red denotes enrichment in AC484 TIM-3+. Blue denotes enrichment in anti-PD-1 TIM-3+. Source data
Extended Data Fig. 8
Extended Data Fig. 8. AC484 increases immune infiltration into tumors and increases STAT5 signaling and the metabolic fitness of T cells.
a, Bar plot showing quantification of total CD45+ cells from flow cytometry analysis of tumour-infiltrating lymphocytes from untreated B16 tumours, or B16 tumours treated with AC484 or anti-PD-1. b-e, CT26 tumour bearing animals were treated for 8 days with AC484 starting after tumour size-match at day 7. b, MFI of pSTAT5 in whole blood CD3+ T cells. c, Frequency of ICOS-expressing and GZMB-expressing CD8+ T cells in blood. d, Frequency of ICOS-expressing and GZMB-expressing CD8+ T cells as well as frequency of CD8+ T cells among CD45+ immune cells in tumours. e, Frequency of GZMB-expressing NK cells and CD86 and MHC I expression on macrophages in tumours. f-g, Murine splenic CD8+ T cells were stimulated with plate-bound anti-CD3 (5 µg mL−1) and soluble anti-CD28 (2 µg mL−1), expanded in IL-2, and then treated with IL-2 (100 ng mL−1), AC484 (20 μM), or both for 1 or 20 h. f, Flow cytometry histograms of total STAT5 and pSTAT5 staining and relative pSTAT5 quantification of stimulated T cells. g, Western blot for and relative quantification (normalized to loading control) of pSTAT5 of stimulated T cells. h, Western blot for pSTAT5 ± IFNγ, ± IL-2, and increasing dose of AC484 (0.1 μM, 0.5 μM, 20 μM). i, Schematic representation of experimental design for the Seahorse assay on primary mouse T cells treated with the indicated cytokines ± AC484; figure created with BioRender.com. j, Oxygen consumption rate over time via the Seahorse assay using naïve T cells stimulated with plate-bound anti-CD3 (1 μg mL−1), soluble anti-CD28 (2 μg mL−1), and no cytokine (left) or IFNγ (right), treated with or without AC484 for 72 h. Oxidative phosphorylation profile was characterized by measuring OCR before and after injections of oligomycin (1.5 μM), FCCP (1 μM) and antimycin A and rotenone (0.5 μM). k, Quantification of mean OCR. l, Quantification of extracellular acidification rate (ECAR) over time (left) and mean ECAR (right) via the Seahorse assay using naïve T cells stimulated with plate-bound anti-CD3 (1 μg mL−1), soluble anti-CD28 (2 μg mL−1), IL-2 (100 ng mL−1), and treated with or without AC484 for 72 h. ECAR was measured before and after injections of oligomycin (1.5 μM), FCCP (1 μM) and antimycin A and rotenone (0.5 μM). m, Bar plot quantifying Mitotracker dye staining of naïve T cells stimulated with plate-bound anti-CD3 (1 μg mL−1), soluble anti-CD28 (2 μg mL−1), and IL-2 (100 ng mL−1) ± AC484 for 96 h. Source data
Extended Data Fig. 9
Extended Data Fig. 9. AC484 increases NK and T cell cytotoxicity in vitro.
a, Representative histograms of killed (Zombie Green+) Yac-1 tumour cells by primary splenic mouse NK cells ± AC484 in vitro. b, Percent redirected killing of A375 melanoma cells expressing membrane-bound anti-CD3 and CD80 by primary human T cells following serial in vitro co-cultures at effector:target ratios of 1:2 or 1:4 ± AC484 (0, 0.1, or 1.0 μM) (n = 5-6). Source data

Comment in

References

    1. Hugo, W. et al. Genomic and transcriptomic features of response to anti-PD-1 therapy in metastatic melanoma. Cell165, 35–44 (2016). - PMC - PubMed
    1. Fares CM, Van Allen EM, Drake CG, Allison JP, Hu-Lieskovan S. Mechanisms of resistance to immune checkpoint blockade: why does checkpoint inhibitor immunotherapy not work for all patients? Am. Soc. Clin. Oncol. Educ. Book. 2019;39:147–164. doi: 10.1200/EDBK_240837. - DOI - PubMed
    1. Manguso RT, et al. In vivo CRISPR screening identifies Ptpn2 as a cancer immunotherapy target. Nature. 2017;547:413–418. doi: 10.1038/nature23270. - DOI - PMC - PubMed
    1. Wiede F, et al. PTPN2 phosphatase deletion in T cells promotes anti-tumour immunity and CAR T-cell efficacy in solid tumours. EMBO J. 2020;39:e103637. doi: 10.15252/embj.2019103637. - DOI - PMC - PubMed
    1. LaFleur MW, et al. PTPN2 regulates the generation of exhausted CD8+ T cell subpopulations and restrains tumor immunity. Nat. Immunol. 2019;20:1335–1347. doi: 10.1038/s41590-019-0480-4. - DOI - PMC - PubMed

Publication types

MeSH terms

Associated data