. 2023 Oct;622(7982):329-338.
doi: 10.1038/s41586-023-06592-6. Epub 2023 Oct 4.

Plasma proteomic associations with genetics and health in the UK Biobank

Benjamin B Sun  1 Joshua Chiou #  2 Matthew Traylor #  3 Christian Benner #  4 Yi-Hsiang Hsu #  5 Tom G Richardson #  3   6 Praveen Surendran #  6 Anubha Mahajan #  4 Chloe Robins #  7 Steven G Vasquez-Grinnell #  8 Liping Hou #  9 Erika M Kvikstad #  8 Oliver S Burren  10 Jonathan Davitte  7 Kyle L Ferber  11 Christopher E Gillies  12 Åsa K Hedman  13 Sile Hu  3 Tinchi Lin  14 Rajesh Mikkilineni  15 Rion K Pendergrass  4 Corran Pickering  16 Bram Prins  10 Denis Baird  17 Chia-Yen Chen  17 Lucas D Ward  18 Aimee M Deaton  18 Samantha Welsh  16 Carissa M Willis  18 Nick Lehner  19 Matthias Arnold  19   20 Maria A Wörheide  19 Karsten Suhre  21 Gabi Kastenmüller  19 Anurag Sethi  22 Madeleine Cule  22 Anil Raj  22 Alnylam Human GeneticsAstraZeneca Genomics InitiativeBiogen Biobank TeamBristol Myers SquibbGenentech Human GeneticsGlaxoSmithKline Genomic SciencesPfizer Integrative BiologyPopulation Analytics of Janssen Data SciencesRegeneron Genetics CenterLucy Burkitt-Gray  16 Eugene Melamud  22 Mary Helen Black  9 Eric B Fauman  2 Joanna M M Howson  3 Hyun Min Kang  12 Mark I McCarthy  4 Paul Nioi  18 Slavé Petrovski  10   23 Robert A Scott  6 Erin N Smith  24 Sándor Szalma  24 Dawn M Waterworth  25 Lyndon J Mitnaul  12 Joseph D Szustakowski  8 Bradford W Gibson  5 Melissa R Miller  2 Christopher D Whelan  26   27
Collaborators, Affiliations

Plasma proteomic associations with genetics and health in the UK Biobank

Benjamin B Sun et al. Nature. 2023 Oct.

Abstract

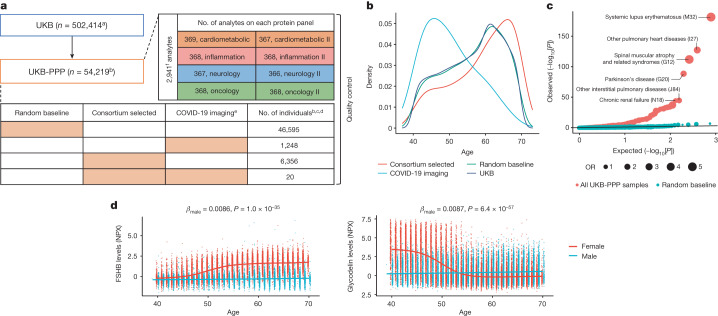
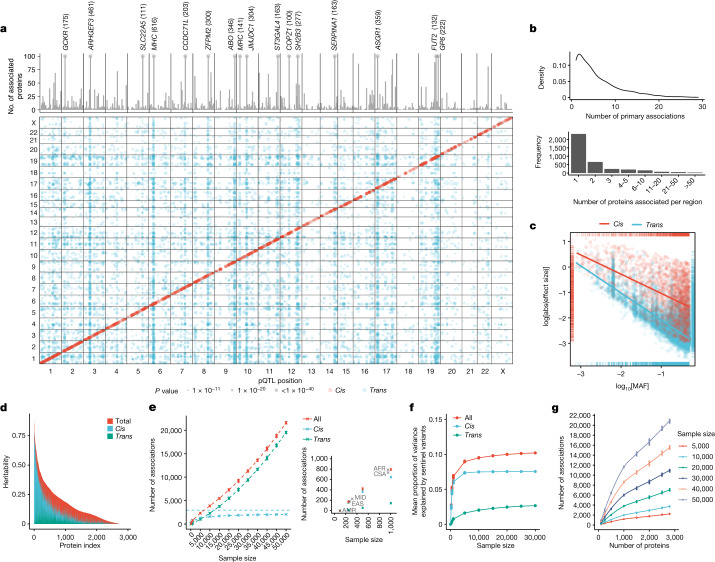
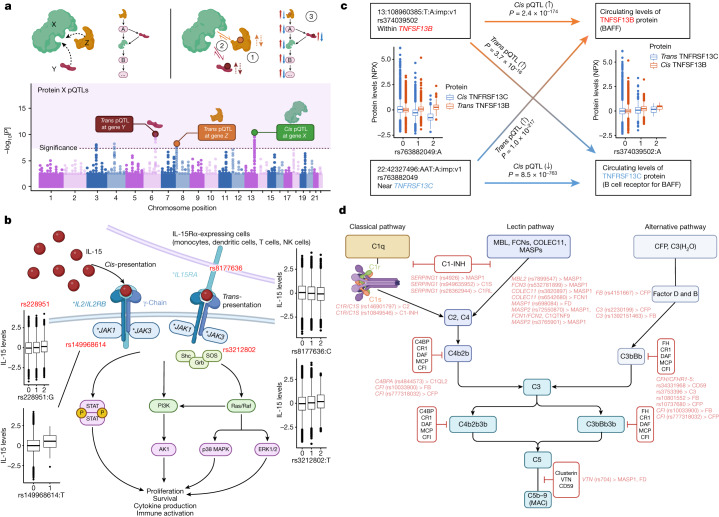
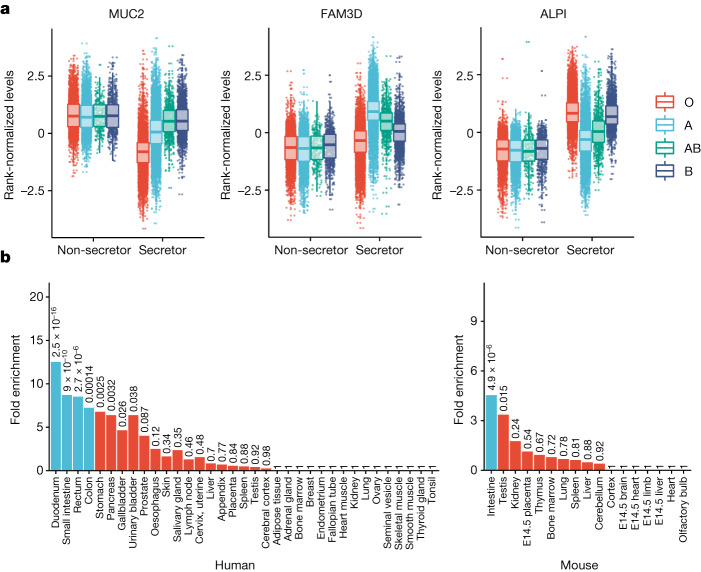
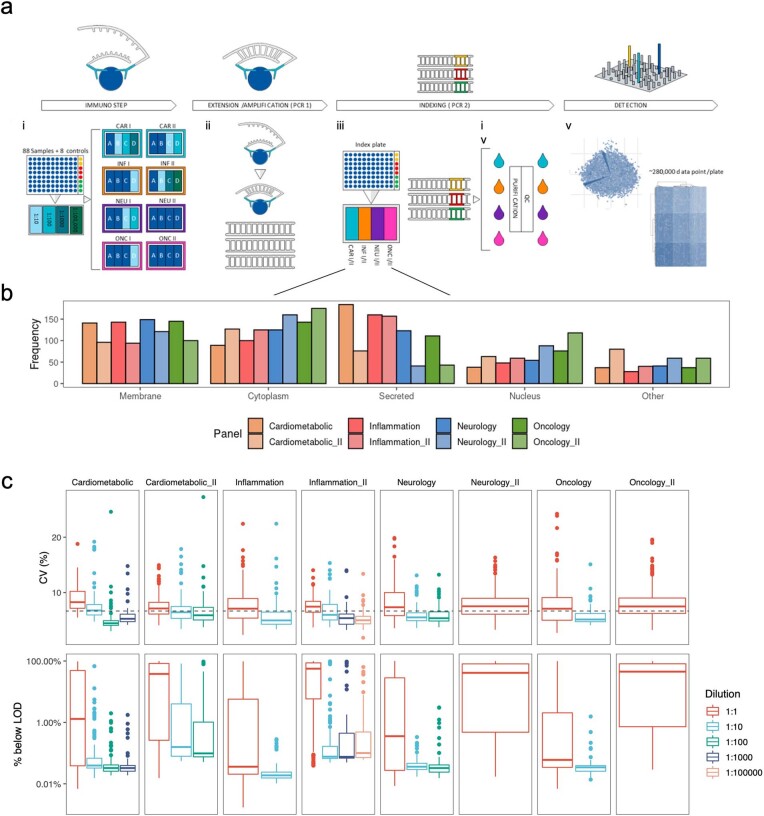
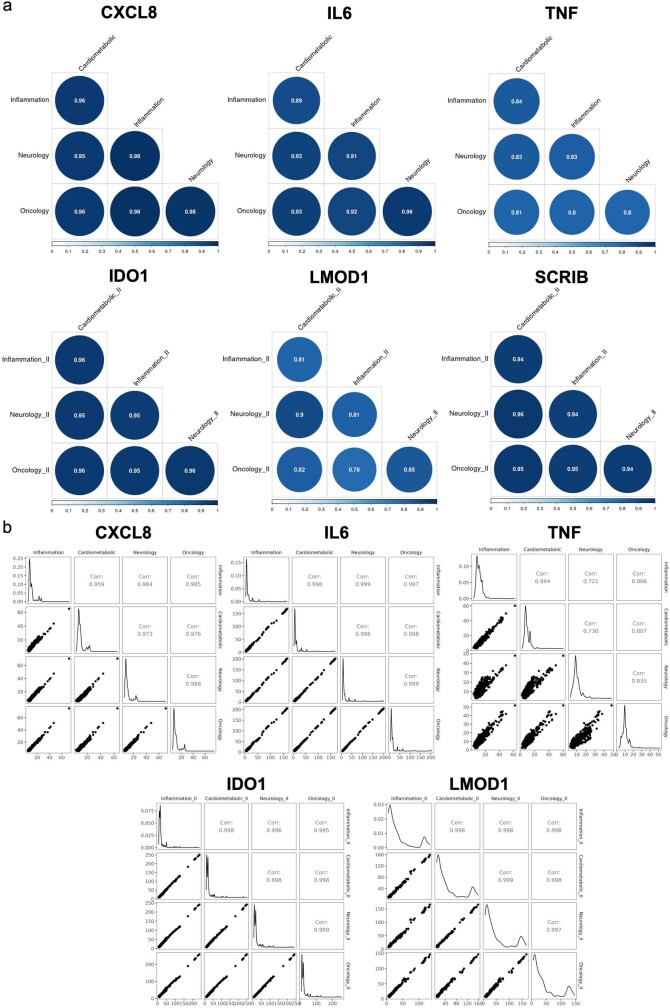
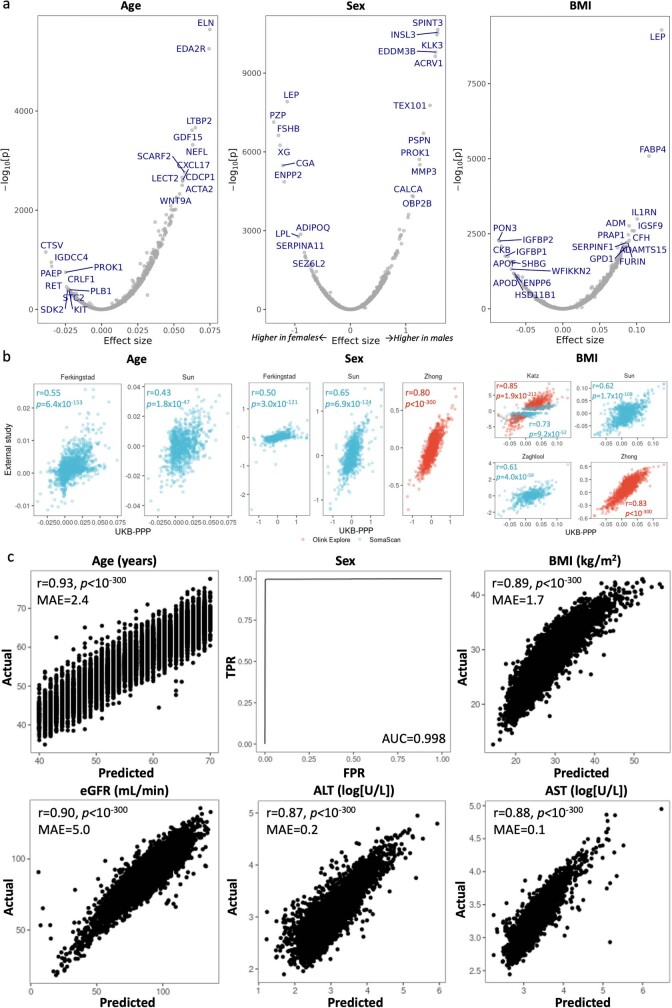
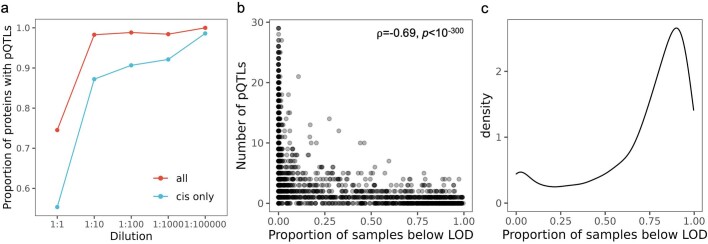
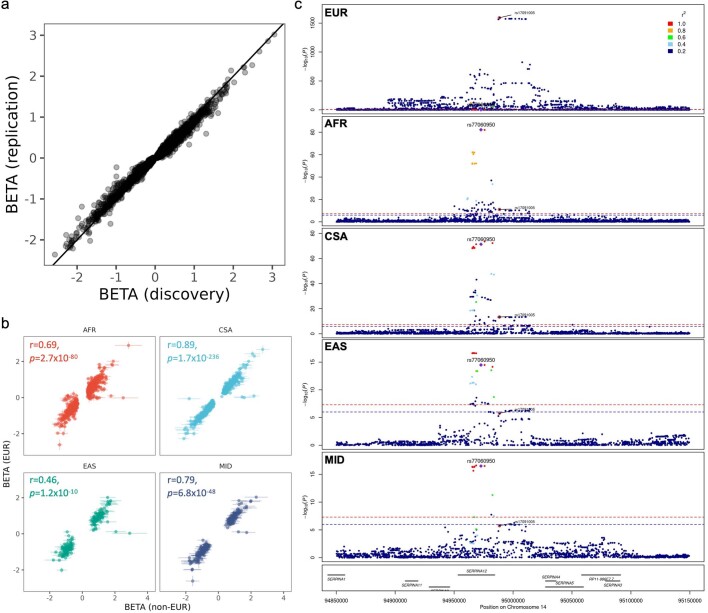
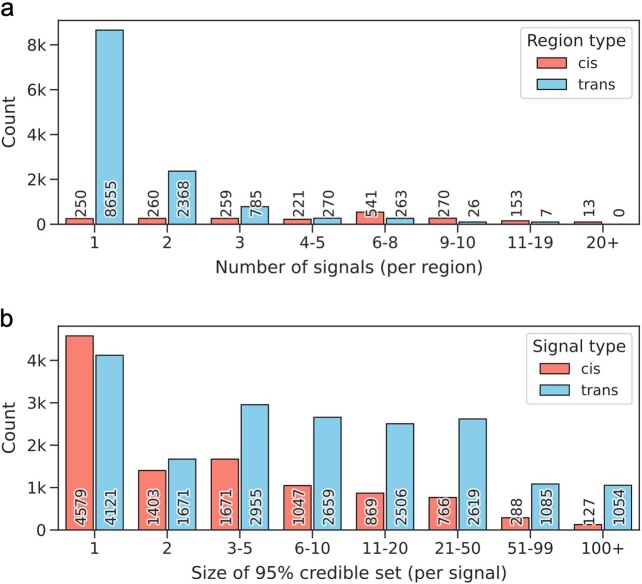
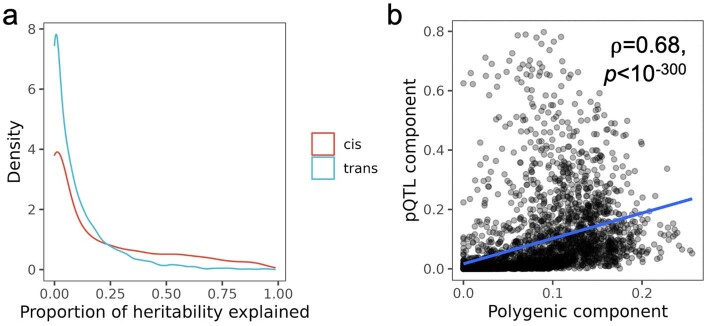
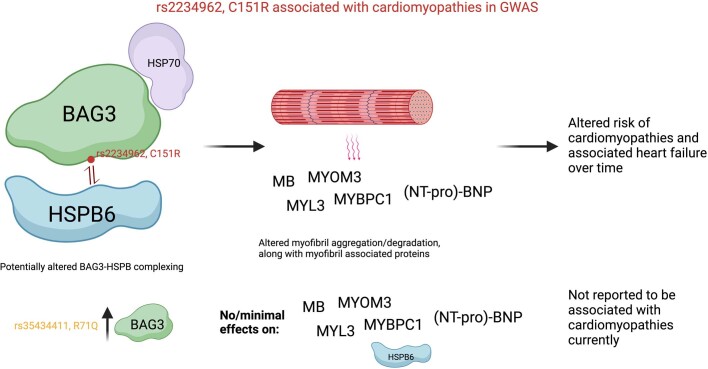
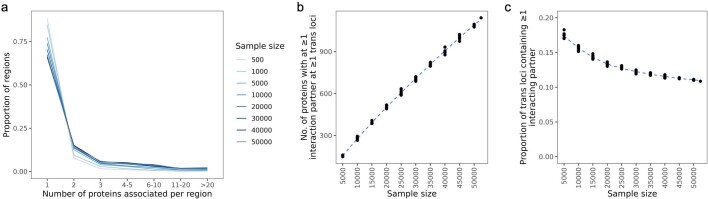
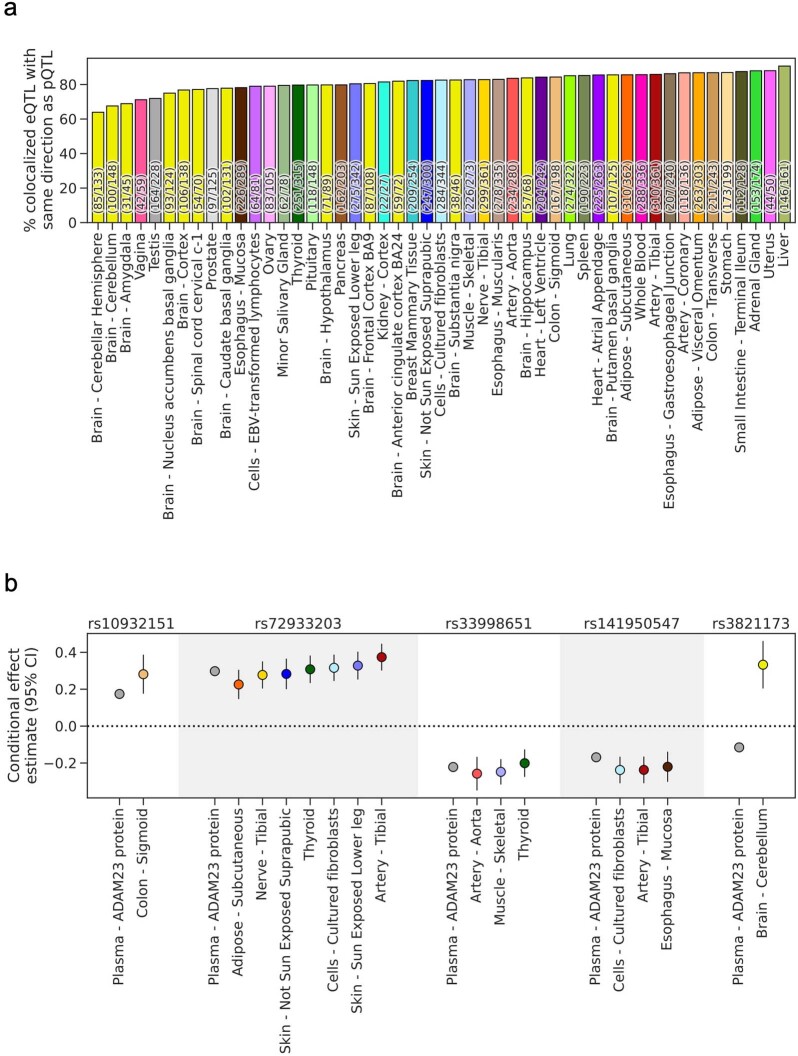
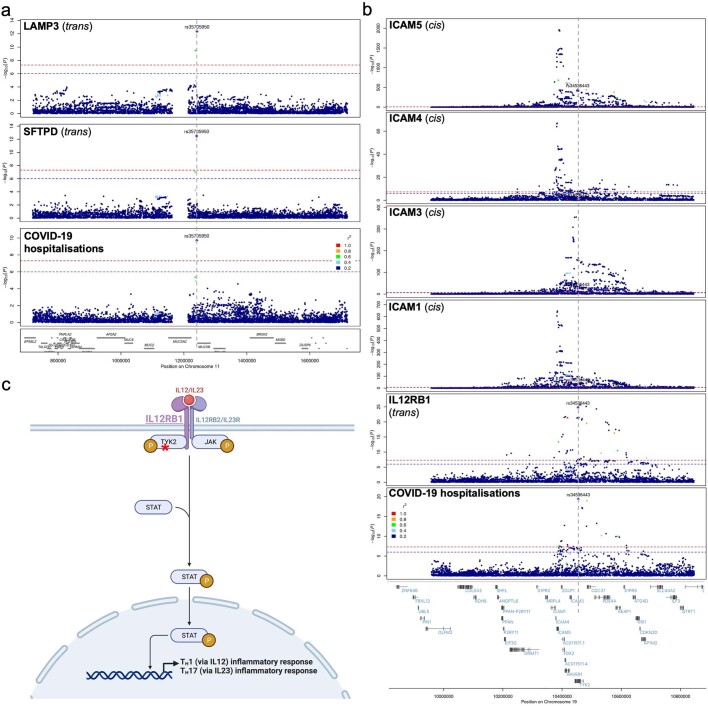
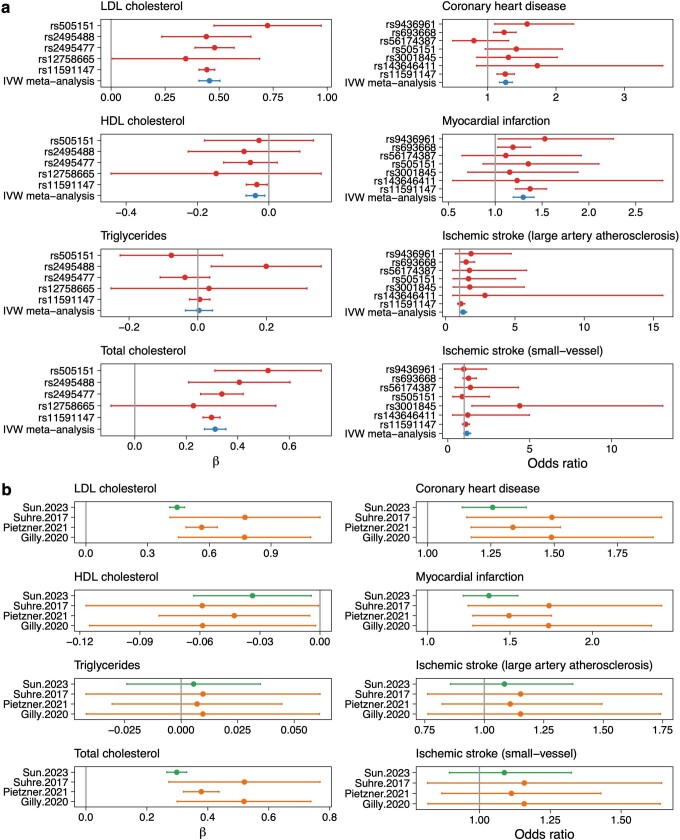
The Pharma Proteomics Project is a precompetitive biopharmaceutical consortium characterizing the plasma proteomic profiles of 54,219 UK Biobank participants. Here we provide a detailed summary of this initiative, including technical and biological validations, insights into proteomic disease signatures, and prediction modelling for various demographic and health indicators. We present comprehensive protein quantitative trait locus (pQTL) mapping of 2,923 proteins that identifies 14,287 primary genetic associations, of which 81% are previously undescribed, alongside ancestry-specific pQTL mapping in non-European individuals. The study provides an updated characterization of the genetic architecture of the plasma proteome, contextualized with projected pQTL discovery rates as sample sizes and proteomic assay coverages increase over time. We offer extensive insights into trans pQTLs across multiple biological domains, highlight genetic influences on ligand-receptor interactions and pathway perturbations across a diverse collection of cytokines and complement networks, and illustrate long-range epistatic effects of ABO blood group and FUT2 secretor status on proteins with gastrointestinal tissue-enriched expression. We demonstrate the utility of these data for drug discovery by extending the genetic proxied effects of protein targets, such as PCSK9, on additional endpoints, and disentangle specific genes and proteins perturbed at loci associated with COVID-19 susceptibility. This public-private partnership provides the scientific community with an open-access proteomics resource of considerable breadth and depth to help to elucidate the biological mechanisms underlying proteo-genomic discoveries and accelerate the development of biomarkers, predictive models and therapeutics1.


Conflict of interest statement

L.D.W., P.N., C.M.W. and A.M.D. are employees and/or stockholders of Alnylam. Y.-H.H. and B.W.G. are employees and/or stockholders of Amgen. S.P., O.S.B. and B.P. are employees and/or stockholders of AstraZeneca. B.B.S., T.L., K.L.F., D.B. and C.-Y.C. are employees and/or stockholders of Biogen. E.M.K., J.D.S. and S.G.V.-G. are employees and/or stockholders of Bristol Myers Squibb. M.C., A.R., A.S. and E.M. are employees and/or stockholders of Calico. R.K.P., M.I.M., A.M. and C.B. are employees of Genentech and holders of Roche stock. C.R., P.S., R.A.S., T.G.R. and J.D. are employees and/or stockholders of GlaxoSmithKline. M.H.B., L.H., D.M.W. and C.D.W. are employees and/or stockholders of Janssen Research & Development. J.M.M.H., S.H. and M.T. are employees and/or stockholders of Novo Nordisk. Å.K.H., E.B.F., J.C. and M.R.M. are employees and/or stockholders of Pfizer. H.M.K., L.J.M. and C.E.G. are employees and/or stockholders of Regeneron. E.N.S., S.S. and R.M. are employees and/or stockholders of Takeda. L.B.-G., C.P. and S.W. are employees of the UK Biobank. The other authors declare no competing interests.

Figures

Fig. 1
Fig. 1. Overview of UKB-PPP.
a, Sample set-up and protein measurements. The number of individuals comprising each cohort (random baseline, consortium selected, COVID-19 imaging, or a combination) is represented by the orange boxes. b, The age distribution between different subcohorts. c, QQ plot showing enrichment P values of the full UKB cohort compared against all of the UKB-PPP samples and UKB-PPP randomly selected baseline samples. Statistical analysis was performed using two-sided, unadjusted Fisher’s exact tests. d, Follicle-stimulating hormone beta subunit (FSHB) and glycodelin (PAEP) levels by age and sex. Linear regression coefficients and two-sided unadjusted P values for males are shown. aThe number is based on the October 2021 release of the UKB. bSamples from individuals who have withdrawn from the study are excluded except in the sample-processing schematic. cSamples (n = 13) and plates (n = 4) that were damaged/contaminated were not included in the summaries except for in the sample-processing schematic. dMultiple measurements include a combination of blind duplicate samples and bridging samples. eParticipants selected for COVID-19-positive status measured at baseline (n = 1,230), visit 2 (n = 1,209) and visit 3 (n = 1,261). Visit 2 and 3 measurements were performed together in batch 7. f2,923 unique proteins; 6 proteins were measured across 4 protein panels. NT-proBNP and BNP, IL-12A and IL-12 are treated as separate proteins. NPX, normalized protein expression.
Fig. 2
Fig. 2. The genetic architecture of pQTLs.
a, Summary of pQTLs across the genome. Bottom, genomic locations of pQTLs against the locations of the gene encoding the protein target. Red, cis pQTLs; blue, trans pQTLs. Top, the number of associated protein targets for each genomic region (the axis is capped at 100; regions with >100 number of associated proteins are labelled, with the number in parenthesis). b, The number of primary pQTLs per protein (top) and the number of associated proteins per genomic region (bottom). c, The log absolute effect size against log[MAF] by cis and trans associations. The lines indicate the linear regression slope for cis (red) and trans (blue) associations. d, The distribution of heritability and contributions from primary cis and trans pQTLs. e, The number of primary associations against sample size. Data are mean ± 3 s.d. of n = 10 independent sets of random subsamples at each sample size strata. f, The mean proportion of variance explained by primary pQTLs against sample size. g, The number of primary associations against the number of proteins assayed.
Fig. 3
Fig. 3. Examples of pathway networks highlighted by trans pQTLs.
a, Schematic of how trans pQTLs function as part of the same protein–protein interaction or pathway as the protein tested (protein X). Top left, proteins involved may be directly interacting or indirectly involved as part of the same pathway. Bottom, trans pQTLs found for corresponding genes in trans (in addition to potentially other signals and cis associations regulating protein X). Top right, some of the mechanisms by which the trans pQTLs may regulate the target protein (protein X), including: (1) regulating the levels of the binding partners (Y, Z), which in turn affects protein X levels; (2) altering the interaction between Y/Z with X; (3) modulating components of the pathway in which Y/Z may be upstream/downstream of protein X. The figure was created using BioRender, including adaptations from ‘The principle of a genome-wide association study’. b, The IL-15-signalling pathway. The asterisks indicate genes with trans pQTLs for IL-15 (the primary association SNP is shown in red). The figure was created using BioRender, including adaptations from ‘Thrombopoietin receptor signaling’. NK, natural killer. c, Example of a bidirectional trans pQTL pair. P values were derived from REGENIE regression GWAS (two-sided, unadjusted). Orange and blue solid arrows represent cis pQTLs for TNFSF13B and TNFRSF13C; gradient lines represent trans effects of TNFSF13B variants on TNFRSF13C protein levels and trans effects of TNFRSF13C variants on TNFSF13B levels. d, The complement pathway. Trans pQTLs and the associated proteins are shown in red. The figure was created using BioRender. The box plots in b and c show the median (centre line), first and third quartiles (box limits), and 1.5× the interquartile range above and below the third and first quartiles (upper and lower whiskers). n = 52,363 independent samples.
Fig. 4
Fig. 4. ABO blood group FUT2 secretor status interaction.
a, Protein levels by blood group and secretor status for four proteins with the most significant interaction effects. The box plots show the median (centre line), first and third quartiles (box limits), and 1.5× the interquartile range above and below the third and first quartiles (upper and lower whiskers). n = 52,363 independent samples. b, Enrichment of genes encoding proteins with significant interactions (P < 1.7 × 10−5) for expression in various human (left) and mouse (right) tissues. The numbers above the bars represent unadjusted P values calculated using one-sided hypergeometric enrichment tests; the blue bars indicate significance after multiple-testing correction. E14.5, embryonic day 14.5.
Extended Data Fig. 1
Extended Data Fig. 1. Summary of the Olink Explore proteomics assay.
(a) Summary of the Olink proteomic assay workflow. (i) Assays are run in a 96-well format, each plate consists of 88 UKB samples and 8 external control samples in column 12: sample controls (yellow) are used to determine precision within and between plates, triplicate negative controls samples (red) set the limit of detection (LOD) and triplicate plate controls (green) are used to standardize protein levels within a plate. The Explore 3072 product consists of eight 384-plex panels; Cardiometabolic (CAR) I and II, Inflammation (INF) I and II, Neurology (NEU) I and II and Oncology (ONC) I and II, and each panel consists of 4 abundance blocks, with plasma sample run 1:1 or diluted 1:1 (least expected abundance), 1:10, 1:100, 1;1000 and 1:100,000. (ii) Extension and amplification step: only matched PEA probes bind to their respective target and via PCR (PCR1) generate dsDNA amplicons, containing assay information. (iii) Indexing: all amplicons for a given sample in a single panel are pooled and unique index primers are added and are integrated into the amplicon via PCR (PCR2). (iv) All amplicons for all samples within a panel are combined to generate four sequencing libraries; the libraries are purified and quality controlled before (v) detection and being sequenced on an Illumina Novaseq 6000 instrument generating ~280,000 data points per sample plate (b) Cell compartment distribution of measured proteins by protein panel. (c) Boxplot of coefficients of variation (CVs) and % of samples with measurements below LOD by dilutions. Each box plot presents the median, first and third quartiles, with upper and lower whiskers representing 1.5x inter-quartile range above and below the third and first quartiles respectively; n = 2,941 independent protein analytes.
Extended Data Fig. 2
(a) Phenotypic correlation (Pearson’s r) between the same protein targets (CXCL8, IL6, TNF, IDO1, LMOD1, SCRIB) measured across protein panels. (b) Correlation (Pearson’s r) of significant genetic associations (p < 1.7 × 10⁻¹¹) between the same protein targets.
Extended Data Fig. 3
(a) Volcano plot of associations with age, sex and BMI. Top 10 proteins with the largest positive and negative associations are labelled. P-values (two-sided, unadjusted) derived from multivariable linear regression. (b) Comparison of effect sizes between UKB-PPP and published multiplex proteomic studies for protein associations with age, sex and BMI. (c) Performance of trained proteomic predictor models against true values in a held-out test data set. (b) and (c), p-values (unadjusted) for Pearson’s correlation test (two-sided). r: Pearson’s correlation coefficient. MAE: mean absolute error, eGFR: estimated glomerular filtration rate. ALT: alanine aminotransferase. AST: aspartate aminotransferase.
Extended Data Fig. 4
(a) Proportion of proteins with pQTLs across different dilution sections. (b) Comparison of the number of pQTLs vs the proportion of samples with measurements below LOD for each protein. P-values (unadjusted) for Spearman’s correlation test (two-sided). (c) Density plot of the proportion of samples with measurements below LOD for proteins with no significant pQTLs (p < 1.7 × 10⁻¹¹). LOD: limit of detection. ρ: Spearman’s correlation coefficient.
Extended Data Fig. 5
(a) Comparison of effect sizes between discovery and replication cohorts. (b) Comparison of effect sizes between significant non-EUR ancestry specific pQTLs and EUR derived pQTLs. Error bars indicate 99% confidence intervals around the beta estimates. P-values (unadjusted) derived from Pearson’s correlation test (two-sided) on |beta| over n = 785 (AFR), 732 (CSA), 179 (EAS), 227 (MID) pQTL associations. (c) Regional association plot of the SERPINA12 cis association locus across ancestries. P-values derived from REGENIE regression GWAS (two-sided, unadjusted).
Extended Data Fig. 6
Number of independent signals per region (a) and size of 95% credible set per signal (b). Results are categorized by cis (red) and trans (blue) associations.
Extended Data Fig. 7
(a) Density plot of proportion of total heritability explained by primary cis and trans associations. (b) Scatterplot with overlaid regression line of the pQTL component (variance explained by sentinel primary pQTLs) vs the polygenic component (genome-wide SNP heritability excluding pQTL regions). P-values (unadjusted) for Spearman’s correlation test (two-sided). ρ: Spearman’s correlation coefficient.
Extended Data Fig. 8
Schematic of a potential pathway linking a BAG3 cardiomyopathy associated missense variant (rs2234962, Cys151Arg) to BAG3-HSBP complexing and downstream effects in cardiac muscle. Figure created with BioRender.com.
Extended Data Fig. 9
(a) Number of proteins associated per genomic region at different sample sizes. (b) Number of proteins with at least one interaction partner locus (gene product at the trans locus that interacts with the protein tested) in at least one of the associated trans loci. (c) Proportion of trans associations containing at least one interaction partner with the protein tested.
Extended Data Fig. 10
Extended Data Fig. 10. Directional concordance of colocalized eQTL signals.
(a) Percentage of directionally concordant eQTL signals among those colocalized with a pQTL signal, for each GTEx tissue. (b) Conditional effect size estimates (centre point) and 95% confidence intervals (error bars) for top variants of ADAM23 pQTL signals and colocalized eQTL signals (rs33998651 was used as a proxy for rs139001108, which was not tested in GTEx).
Extended Data Fig. 11
Extended Data Fig. 11. Stacked regional association plots between COVID loci and pQTLs.
(a) Regional association between COVID-19 locus at MUC5B and SFTPD, LAMP3 trans pQTLs (b) Regional association between COVID-19 locus at TYK2 and colocalized IL12RB1 trans pQTL, in addition to the cis pQTLs of ICAM-1,3,4 and 5 in close proximity. (a) and (b) P-values derived from REGENIE regression GWAS (two-sided, unadjusted). (c) The IL12R-TYK2 inflammatory response signalling schematic with red asterisk indicating the trans pQTL for IL12RB1 in TYK2. Figure created with BioRender.com.
Extended Data Fig. 12
Extended Data Fig. 12. Mendelian randomization estimates of effect of increasing levels of PCSK9 on lipids, cardiovascular diseases and stroke risk.
(a) Effect of PCSK9 plasma protein level on lipids, cardiovascular diseases and stroke risk. (b) Comparison of PCSK9 plasma protein effect estimates based on genetic instruments from four different pQTL studies. Error bars indicate 95% confidence intervals around the effect size estimates. Sample sizes for studies from which summary statistics were derived are detailed in Supplementary Table 30.

References

    1. Suhre K, McCarthy MI, Schwenk JM. Genetics meets proteomics: perspectives for large population-based studies. Nat. Rev. Genet. 2021;22:19–37. doi: 10.1038/s41576-020-0268-2. - DOI - PubMed
    1. Finan, C. et al. The druggable genome and support for target identification and validation in drug development. Sci. Transl. Med.10.1126/scitranslmed.aag1166 (2017). - PMC - PubMed
    1. Schmidt AF, et al. Genetic drug target validation using Mendelian randomisation. Nat. Commun. 2020;11:3255. doi: 10.1038/s41467-020-16969-0. - DOI - PMC - PubMed
    1. Nguyen PA, Born DA, Deaton AM, Nioi P, Ward LD. Phenotypes associated with genes encoding drug targets are predictive of clinical trial side effects. Nat. Commun. 2019;10:1579. doi: 10.1038/s41467-019-09407-3. - DOI - PMC - PubMed
    1. Christiansen MK, et al. Polygenic risk score-enhanced risk stratification of coronary artery disease in patients with stable chest pain. Circ. Genom. Precis. Med. 2021;14:e003298. doi: 10.1161/CIRCGEN.120.003298. - DOI - PubMed

Publication types

MeSH terms