Comparative Study
. 2023 Oct;622(7982):348-358.
doi: 10.1038/s41586-023-06563-x. Epub 2023 Oct 4.

Large-scale plasma proteomics comparisons through genetics and disease associations

Affiliations
Comparative Study

Large-scale plasma proteomics comparisons through genetics and disease associations

Grimur Hjorleifsson Eldjarn et al. Nature. 2023 Oct.

Erratum in

  • Author Correction: Large-scale plasma proteomics comparisons through genetics and disease associations.
    Eldjarn GH, Ferkingstad E, Lund SH, Helgason H, Magnusson OT, Gunnarsdottir K, Olafsdottir TA, Halldorsson BV, Olason PI, Zink F, Gudjonsson SA, Sveinbjornsson G, Magnusson MI, Helgason A, Oddsson A, Halldorsson GH, Magnusson MK, Saevarsdottir S, Eiriksdottir T, Masson G, Stefansson H, Jonsdottir I, Holm H, Rafnar T, Melsted P, Saemundsdottir J, Norddahl GL, Thorleifsson G, Ulfarsson MO, Gudbjartsson DF, Thorsteinsdottir U, Sulem P, Stefansson K. Eldjarn GH, et al. Nature. 2024 Jun;630(8015):E3. doi: 10.1038/s41586-024-07549-z. Nature. 2024. PMID: 38778117 Free PMC article. No abstract available.

Abstract

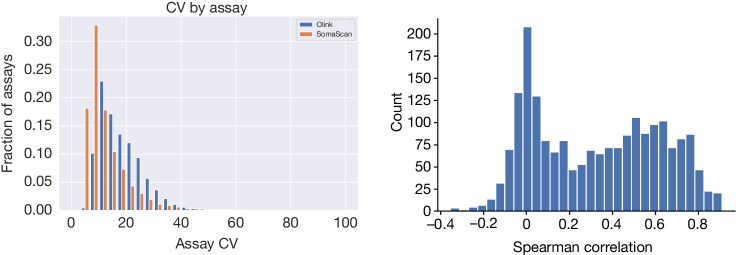
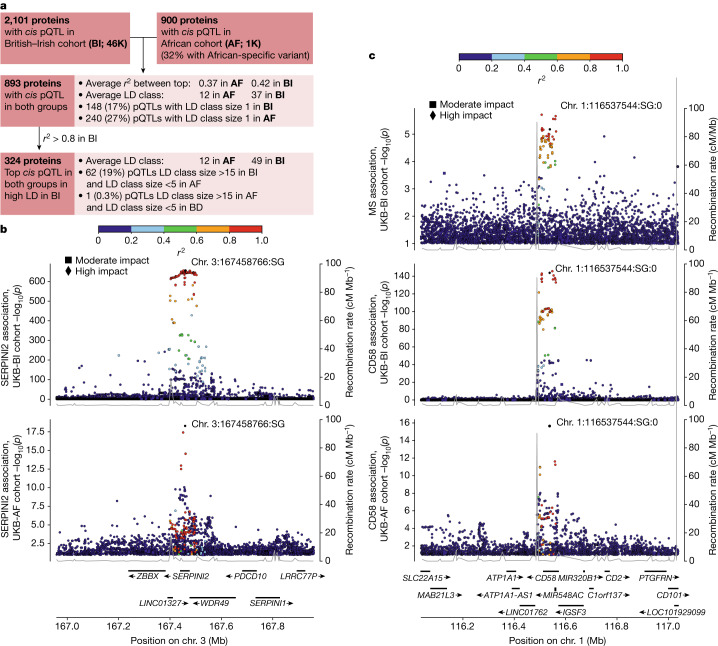
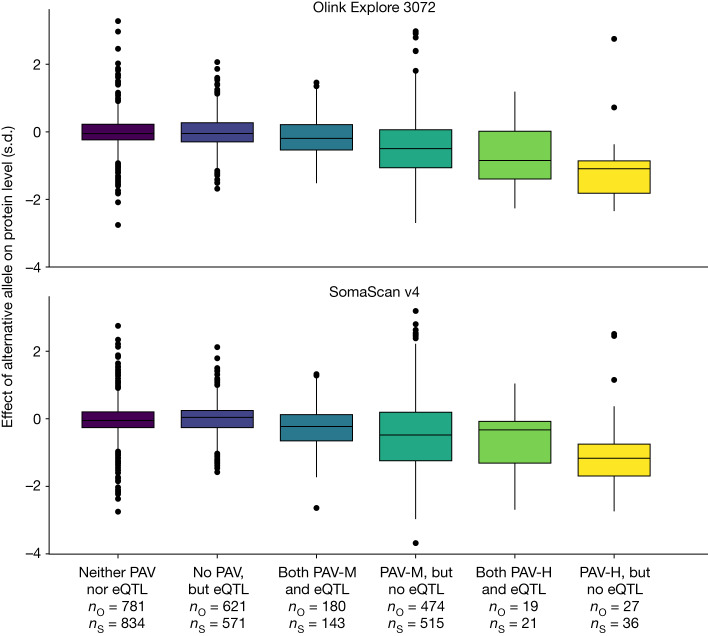
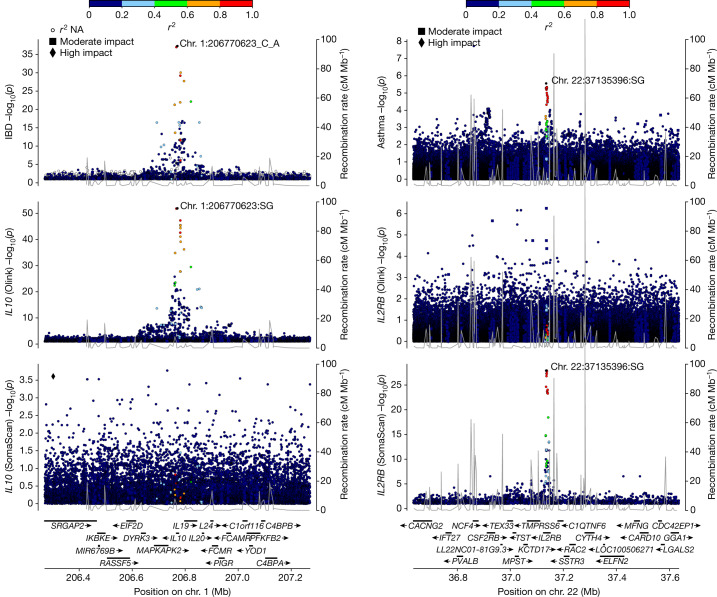
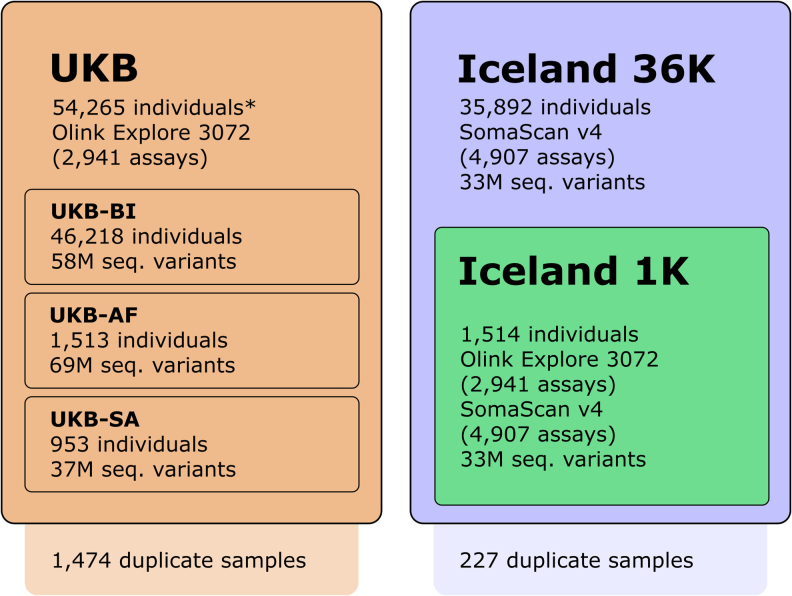
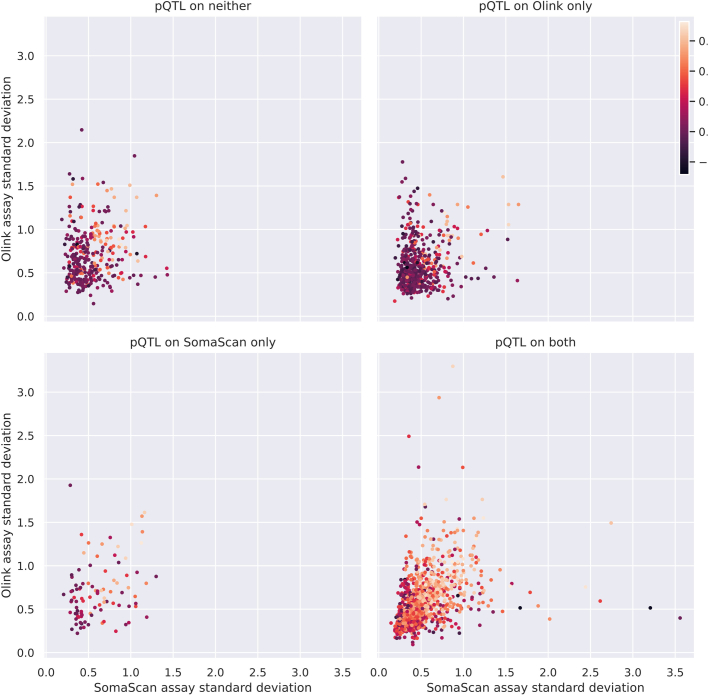
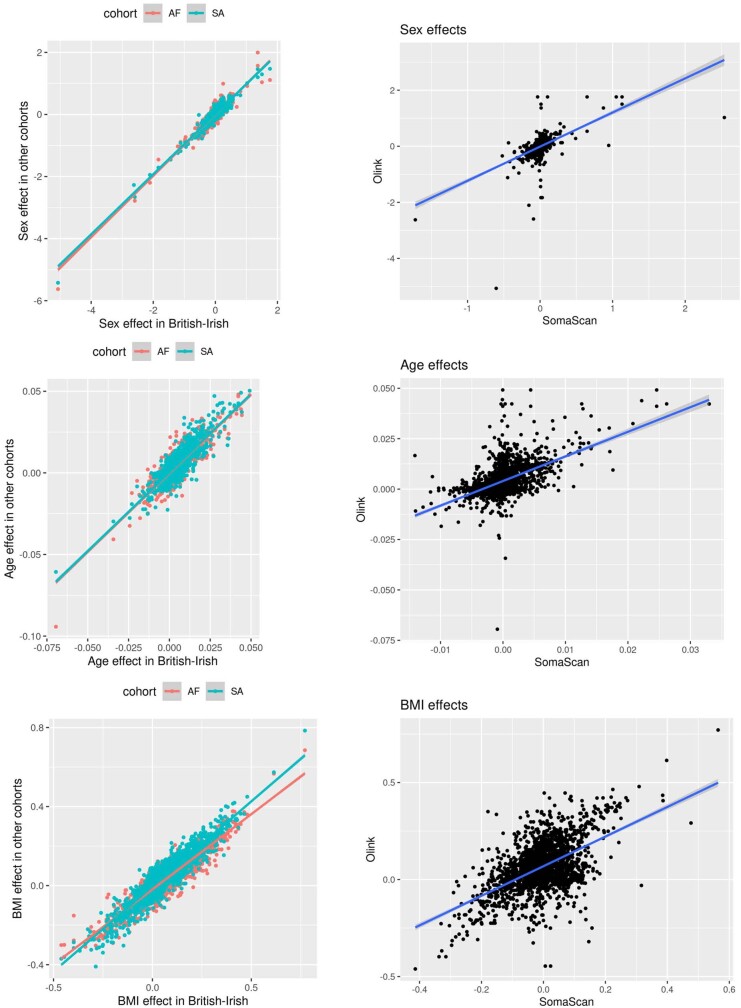
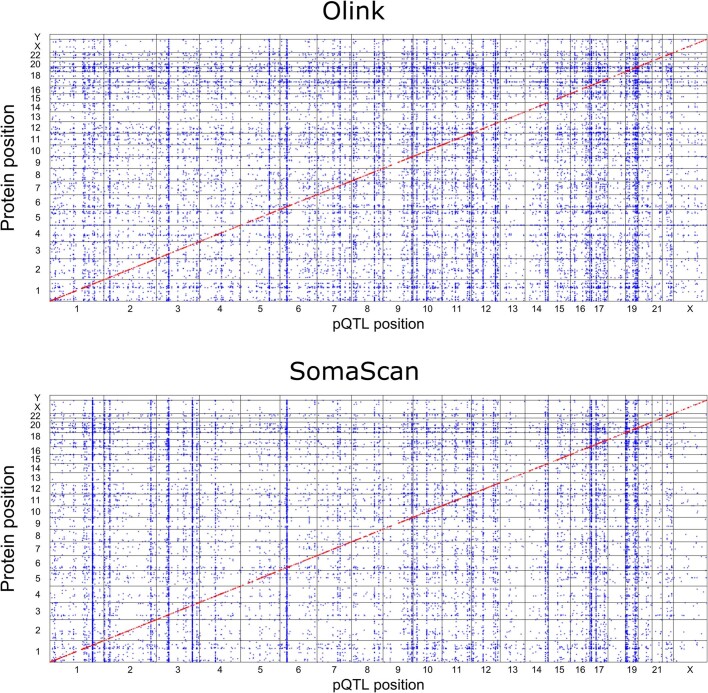
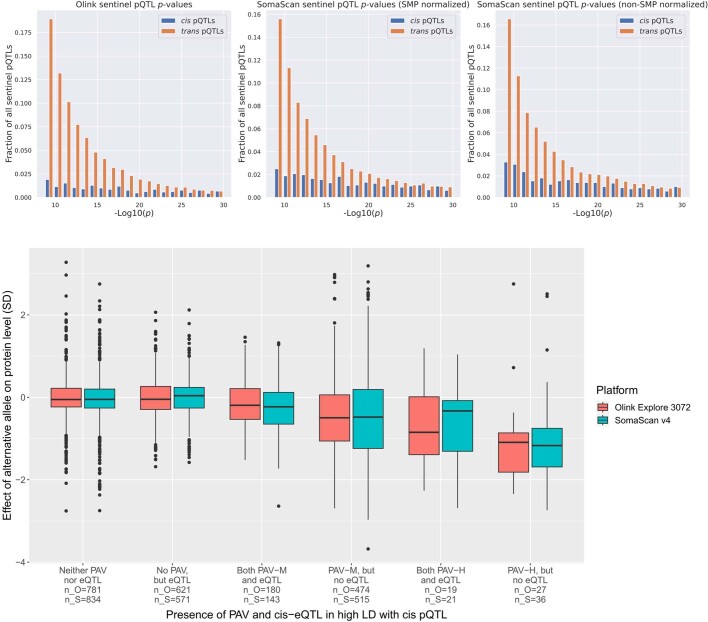
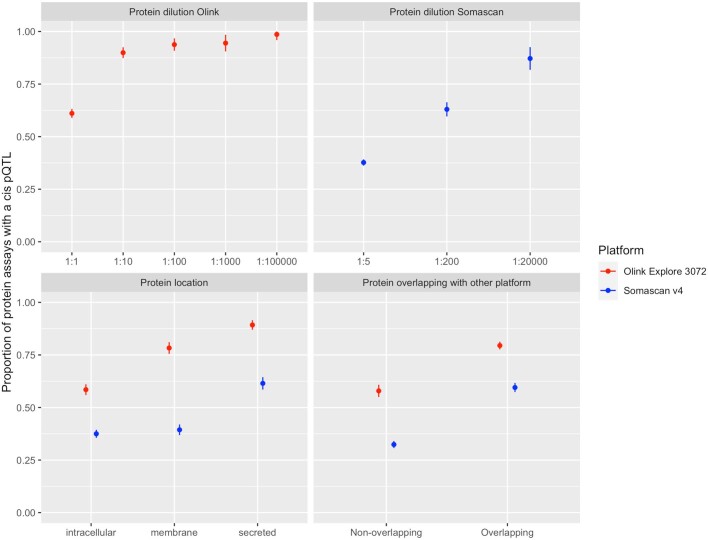
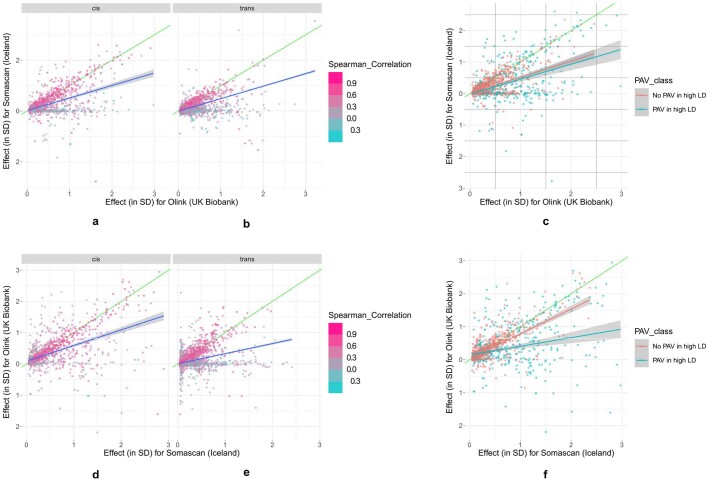
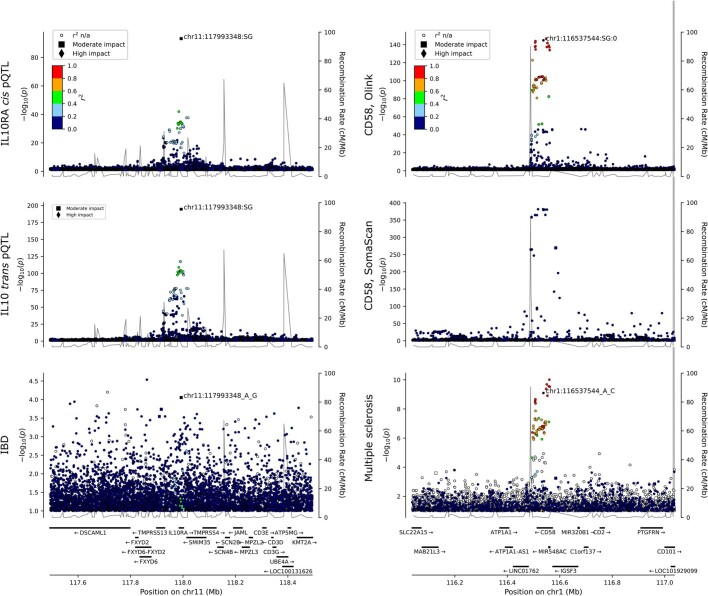
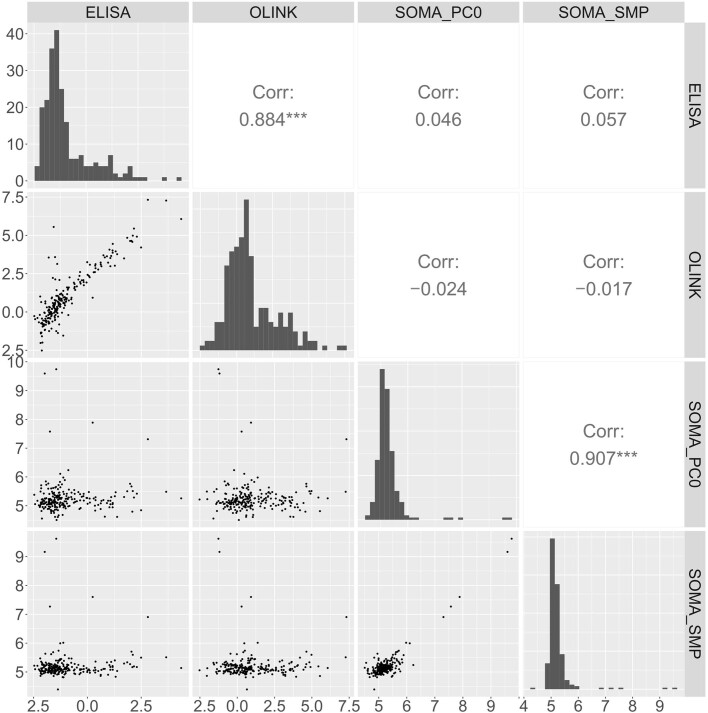
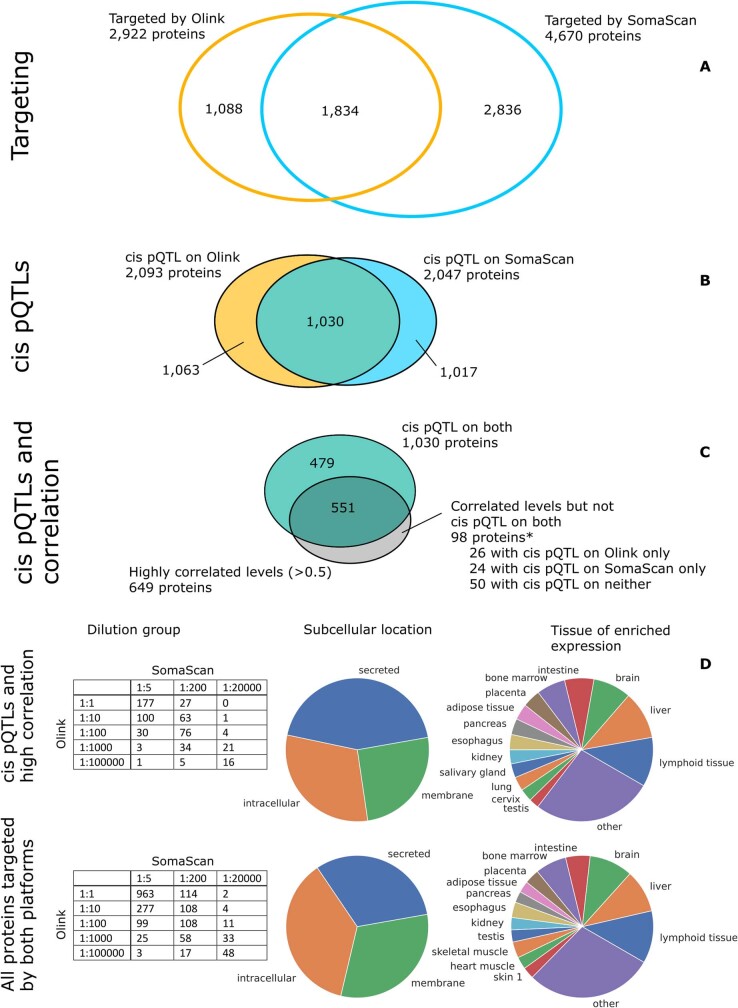
High-throughput proteomics platforms measuring thousands of proteins in plasma combined with genomic and phenotypic information have the power to bridge the gap between the genome and diseases. Here we performed association studies of Olink Explore 3072 data generated by the UK Biobank Pharma Proteomics Project1 on plasma samples from more than 50,000 UK Biobank participants with phenotypic and genotypic data, stratifying on British or Irish, African and South Asian ancestries. We compared the results with those of a SomaScan v4 study on plasma from 36,000 Icelandic people2, for 1,514 of whom Olink data were also available. We found modest correlation between the two platforms. Although cis protein quantitative trait loci were detected for a similar absolute number of assays on the two platforms (2,101 on Olink versus 2,120 on SomaScan), the proportion of assays with such supporting evidence for assay performance was higher on the Olink platform (72% versus 43%). A considerable number of proteins had genomic associations that differed between the platforms. We provide examples where differences between platforms may influence conclusions drawn from the integration of protein levels with the study of diseases. We demonstrate how leveraging the diverse ancestries of participants in the UK Biobank helps to detect novel associations and refine genomic location. Our results show the value of the information provided by the two most commonly used high-throughput proteomics platforms and demonstrate the differences between them that at times provides useful complementarity.


Conflict of interest statement

All authors are employees of deCODE Genetics, a wholly-owned subsidiary of Amgen.

Figures

Fig. 1
Fig. 1. Protein levels measured by individual assays.
Left, repeatability of measurements by platform. The CV for repeated measurements with each assay was used to evaluate the precision of the assay. The median CV for the Olink Explore 3072 assays (blue) was higher than the median CV for the SomaScan v4 assays (orange) (16.5% and 9.9%, respectively, Mann-Whitney P < 10–300). The Olink Explore assays were evaluated on 1,474 duplicate measurements from the UKB 47K dataset, whereas the SomaScan v4 assays were evaluated on 227 duplicate measurements from the Iceland 36K dataset. Right, correlation between measurements for protein levels measured using assays on the Olink Explore 3072 and SomaScan v4 platforms in the Iceland 1K dataset (Spearman correlation), evaluated by measuring plasma samples from 1,514 individuals using both platforms.
Fig. 2
Fig. 2. Using different ancestry groups for locus refinement.
a, Using the more granular LD structure of the UKB-AF pQTLs to refine the location of pQTLs detected in the UKB-BI dataset. b, Locus plot of the sentinel cis pQTL for SERPINI2 in UKB-BI (top) and UKB-AF (bottom) ancestry groups. Although the sentinel cis pQTL for SERPINI2 is the same in the UKB-AF and UKB-BI groups, the LD class to which the variant belongs is much smaller in the UKB-AF group. This enables a more precise determination of which variant truly affects the protein levels. c, Locus plot of the association at the CD58 locus of the association with multiple sclerosis (MS) (top), and the sentinel cis pQTLs for CD58 in UKB-BI (middle) and UKB-AF (bottom). The locus refinement enabled by the smaller LD class in the UKB-AF group suggests that the disease association could be similarly refined. b,c, P values based on two-sided likelihood ratio test and not adjusted for multiple comparisons.
Fig. 3
Fig. 3. Effect of alternative alleles.
Effect on each platform of alternative alleles broken down by the presence or absence of PAVs or cis eQTLs in high LD. PAV-M, moderate-impact PAV; PAV-H, high-impact PAV; nO, number of cis pQTLs detected with Olink; nS, number of cis pQTLs detected with SomaScan. Box plots show the median and lower and upper quartiles; whiskers extend to 1.5 times the interquartile range; points beyond whiskers are plotted individually.
Fig. 4
Fig. 4. pQTLs that are detected on one platform only and their relationship with disease-associated variants.
Left, association at the IL10 locus between sequence variants and IBD (top) and levels of IL-10 as measured using Olink (middle) and SomaScan (bottom). The IL-10 protein is targeted by assays on both platforms, but no cis pQTLs were observed using the SomaScan platform. Right, association at the IL2RB locus between sequence variants and asthma (top) and levels of IL2RB as measured by Olink (middle) and SomaScan (bottom). The colour code indicates the r2 values for each variant with the labelled one. The IL2RB protein is targeted by assays on both platforms, but no cis pQTLs were observed using the Olink platform. P values based on a two-sided likelihood ratio test and not adjusted for multiple comparisons. NA, not applicable.
Extended Data Fig. 1
Extended Data Fig. 1. Properties of the data sets used in the proteomics analysis.
Proteomics measurements on the UKB data set were performed on the Olink Explore 3072 platform, while measurements on the Iceland 36K data set were performed on the SomaScan v4 platform. The Iceland 1K data set is a subset of the Iceland 36K data set, on which the same samples were measured using the Olink Explore 3072 platform in addition to the SomaScan v4 platform. Measurements of duplicated samples were used to evaluate precision of the assays. *Not all samples could be assigned to an ancestry group.
Extended Data Fig. 2
Extended Data Fig. 2. Variance of assays targeting the same protein.
The variance of matching SomaScan and Olink assays stratified by the presence of cis pQTLs and colored by the correlation of levels.
Extended Data Fig. 3
Extended Data Fig. 3. Correlation of sex, participant age and BMI effects.
Left: The correlation of sex, participant age and BMI effects on protein levels between different cohorts in the UKB data set. Right: The correlation of sex, participant age and BMI effects on protein levels between the Olink and SomaScan platforms.
Extended Data Fig. 4
Extended Data Fig. 4. Genomic map of pQTLs.
Genomic locations of all sentinel pQTLs (cis, red; trans, blue) on the Olink platform (UKB-BI, top) and the SomaScan platform (Iceland 36K, bottom). The x-axis indicates the position of the pQTLs, and the y-axis indicates the gene encoding the protein with the associated levels.
Extended Data Fig. 5
Extended Data Fig. 5. Significance of pQTLs and effect of alternative allele.
Top: significance of detected pQTLs in the UKB-BI and Iceland 36K data sets. For all platforms and populations, at the population size, a relatively much higher number of trans pQTLs than cis pQTLs have significance close to the threshold. p-values were based on two-sided significance tests and not corrected for multiple comparsions. Bottom: Effect of alternative allele broken down by presence or absence of PAV or cis eQTL in high LD. PAV-M: moderate impact PAV, PAV-H: high impact PAV, n_O: number of cis pQTLs detected with Olink, n_S: number of cis pQTLs detected with SomaScan. Box plots show the median and lower and upper quartiles; whiskers extend to 1.5 times the interquartile range; points beyond whiskers are plotted individually.
Extended Data Fig. 6
Extended Data Fig. 6. Proportion of protein assays that have a cis pQTL for subgroups of proteins defined by protein dilution, protein cellular location and overlap between platforms.
The plot show point estimates with 95% confidence interval. Centre points show proportion of cis pQTLs in each group. Top left panel based on 1964, 526, 257, 127 and 72 proteins with dilutions 1:1, 1:10, 1:100, 1:1000, and 1:1000 dilution, respectively. Top right panel based on 3981, 778 and 148 proteins with dilutions 1:5, 1:200 and 1:20000, respectively. Bottom left panel based on 1409 intracellular, 839 membrane and 698 secreted Olink proteins (red points); and 2419 intracellular, 1434 membrane and 1054 secreted SomaScan proteins (blue points). Bottom right panel based on 1100 Olink proteins non-overlapping and 1846 Olink proteins overlapping with SomaScan (red points); and 2951 SomaScan proteins non-overlapping and 1956 SomaScan proteins overlapping with Olink (blue points).
Extended Data Fig. 7
Extended Data Fig. 7. Replication of pQTLs between platforms.
a, b: Replication of sentinel cis (a) and trans (b) pQTLs detected using Olink Explore (UK biobank) in normalized SomaScan v4 (Iceland) data. For each pQTL, the plot shows the effect (in units of SD) in SomaScan v4 (y-axis) vs the effect in Olink Explore (x-axis). The assays were matched on the UniProt ID of their targeted protein. Each point is colored based on the Spearman correlation between measured protein levels using normalized SomaScan v4 and Olink Explore. The green lines show values where the effect is equal based on SomaScan v4 and Olink Explore, while the blue lines show a linear regression estimate with shaded 95% pointwise confidence intervals. c: Replication of sentinel cis pQTLs detected using Olink Explore (UK Biobank) in normalized SomaScan v4 (Iceland) data, stratified on whether the cis pQTL is in high LD with PAV (red) or not (blue). For each pQTL, the plot shows the effect (in units of SD) in SomaScan v4 (y-axis)) vs the effect in Olink Explore (x-axis). Each point is colored based on whether or not the associated variant has a protein-altering variant in high LD (r2 > 0.80). The green line shows values where the effect is equal based on SomaScan v4 and Olink Explore, while the blue and red lines show linear regression estimates with shaded 95% pointwise confidence intervals for each group (PAV in high LD; No PAV in high LD). d, e: Replication of sentinel cis (d) and trans (e) pQTL associations detected using normalized SomaScan v4 (Iceland) in Olink Explore (UK biobank) data. For each pQTL association, the plot shows the effect (in units of SD) in SomaScan v4 (x-axis) vs the effect in Olink Explore (y-axis). Each point is colored based on the Spearman correlation between measured protein levels using SomaScan v4 and Olink Explore. The green lines show values where the effect is equal based on SomaScan v4 and Olink Explore, while the blue lines show a linear regression estimate with shaded 95% pointwise confidence intervals. f: Replication of sentinel cis pQTL associations detected using normalized SomaScan v4 (Iceland) in Olink Explore (UK biobank) data, stratified on whether the cis pQTL is in high LD with PAV (blue) or not (red). For each pQTL association, the plot shows the effect (in units of SD) in SomaScan v4 (x-axis) vs the effect in Olink Explore (y-axis). Each point is colored based on whether or not the associated variant has a protein-altering variant in high LD (r2 > 0.80). The green line shows values where the effect is equal based on SomaScan v4 and Olink Explore, while the blue and red lines show linear regression estimates with shaded 95% pointwise confidence intervals for each group (PAV in high LD; No PAV in high LD).
Extended Data Fig. 8
Extended Data Fig. 8. Association with protein levels and disease risk.
Left: Association at IL10RA locus between variants and protein levels of IL10RA and IL10 measured using Olink Explore and IBD risk. All r2 are shown to the same variant. Right: Association at CD58 locus between variants and CD58 levels measured using Olink Explore, CD58 levels measured using SomaScan v4 and multiple sclerosis risk. All r2 are shown to the same variant. p-values were based on a two-sided likelihood ratio test and not adjusted for multiple comparisons.
Extended Data Fig. 9
Extended Data Fig. 9. Comparison of IL10 measurements.
Protein levels of IL10 as measured by ELISA compared with measurements from Olink Explore 3072, SomaScan v4 non-normalized (SOMA_PC0) and normalized (SOMA_SMP). ‘***’ represents p < 0.001, based on a two-sided t-test, not corrected for multiple comparisons. The exact p-values were 1.5 × 10-75 for the correlation between OLINK and ELISA data and 1.1×10-85 for the correlation between SOMA_PC0 and SOMA_SMP data.
Extended Data Fig. 10
Extended Data Fig. 10. Using complementarity to assess the performance of assays.
The complementarity of the two platforms, along with the correlation of genomic information, can be used to assess the evidence for the targeting of the assays. A) The platforms target around 6,000 proteins in total, with about 2,000 proteins targeted by both platforms. B) Cis pQTLs provide evidence that about 2,000 proteins on each platform, with about 1,000 unique to each platform. C) For about 500 proteins that have a cis pQTL on both platforms, the correlation between levels measured using the two platforms is low. Supplementary Table 29 contains columns indicating presence or absence of cis pQTLs as well as the correlation between matching assays on the two platforms, making useful information to evaluate the performance of the assays easily accessible. Numbers in the figure refer to unique proteins, while the rows of the table correspond to pairs of assays. *As multiple assays targeting the same protein can differ in performance, the same protein may belong to more than one subset. D) Expected abundance (as reflected by dilution groups), subcellular locations, and tissue of enriched expression for the Tier 1 proteins (top) and all proteins targeted by both platforms (bottom).

References

    1. Sun, B. B. et al. Plasma proteomic associations with genetics and health in the UK Biobank. Nature10.1038/s41586-023-06592-6 (2023). - PMC - PubMed
    1. Ferkingstad E, et al. Large-scale integration of the plasma proteome with genetics and disease. Nat. Genet. 2021;53:1712–1721. doi: 10.1038/s41588-021-00978-w. - DOI - PubMed
    1. Folkersen L, et al. Genomic and drug target evaluation of 90 cardiovascular proteins in 30,931 individuals. Nat. Metab. 2020;2:1135–1148. doi: 10.1038/s42255-020-00287-2. - DOI - PMC - PubMed
    1. Folkersen L, et al. Mapping of 79 loci for 83 plasma protein biomarkers in cardiovascular disease. PLoS Genet. 2017;13:e1006706. doi: 10.1371/journal.pgen.1006706. - DOI - PMC - PubMed
    1. Pietzner M, et al. Mapping the proteo-genomic convergence of human diseases. Science. 2021;374:eabj1541. doi: 10.1126/science.abj1541. - DOI - PMC - PubMed

Publication types