. 2023 Dec;624(7990):201-206.
doi: 10.1038/s41586-023-06599-z. Epub 2023 Oct 4.

Sialoglycan binding triggers spike opening in a human coronavirus

Affiliations

Sialoglycan binding triggers spike opening in a human coronavirus

Matti F Pronker et al. Nature. 2023 Dec.

Abstract

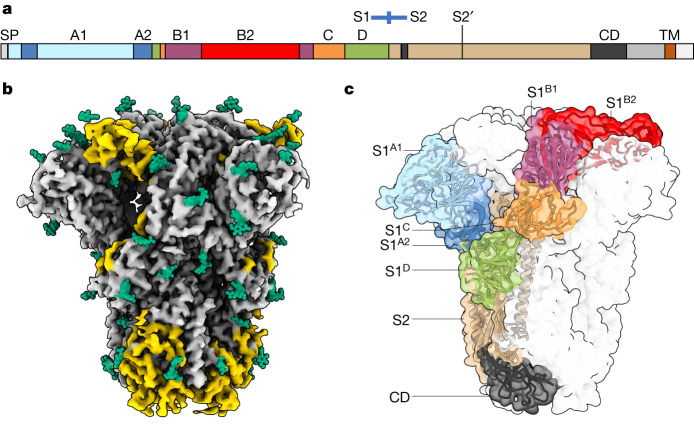
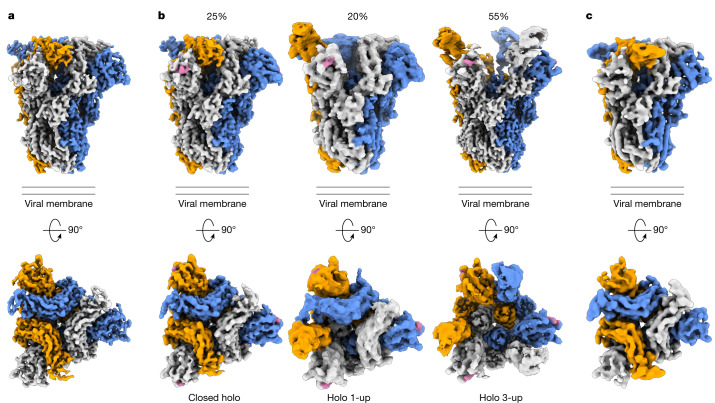
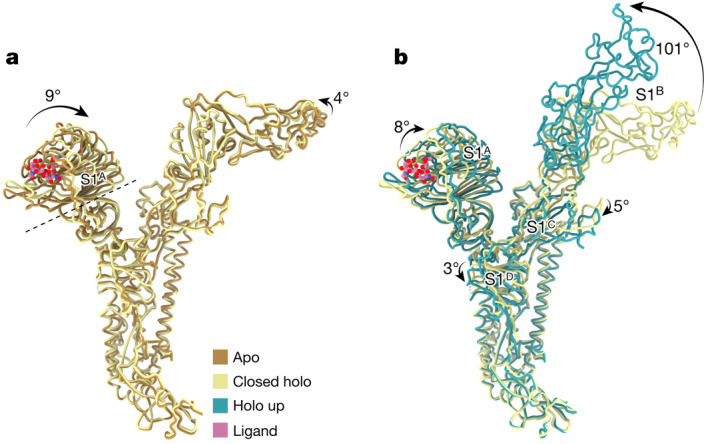
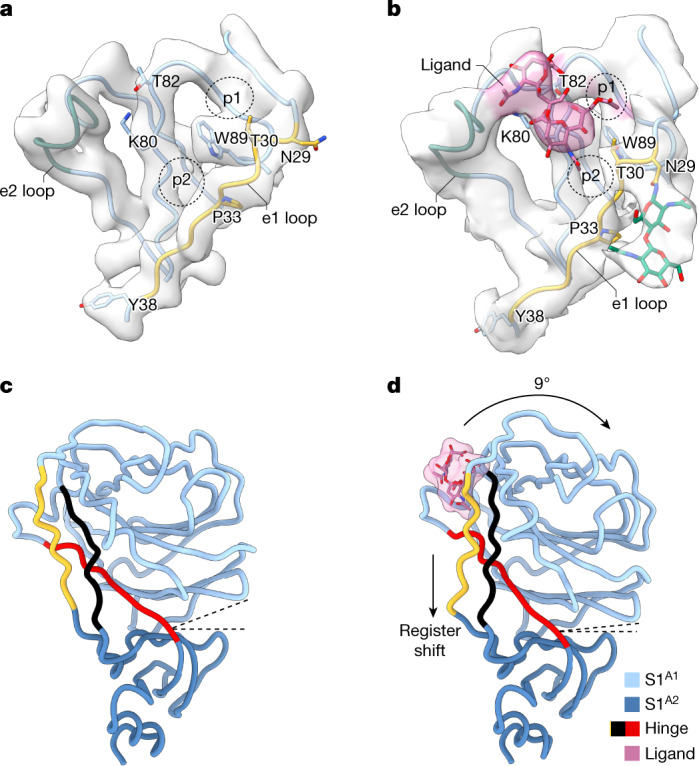
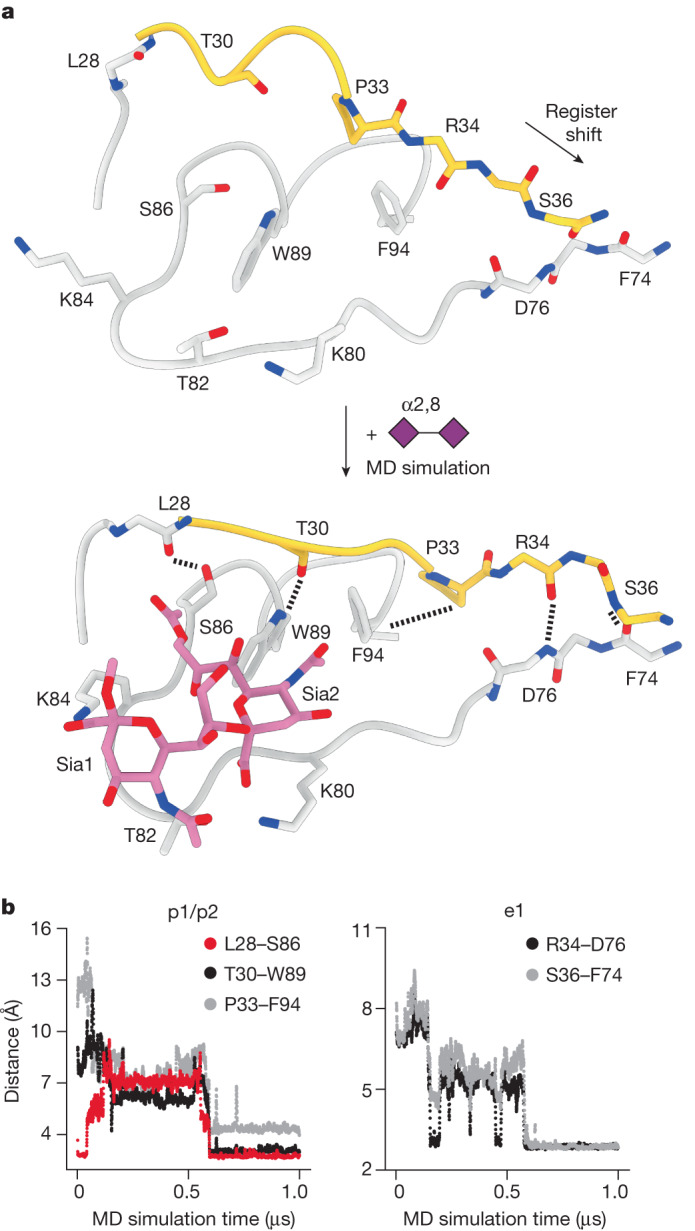
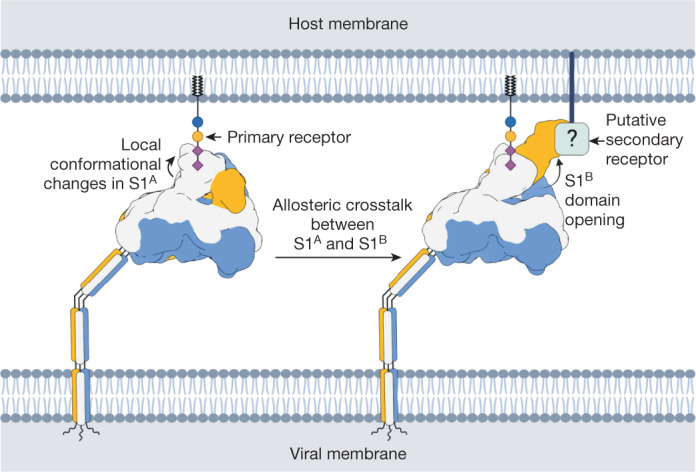
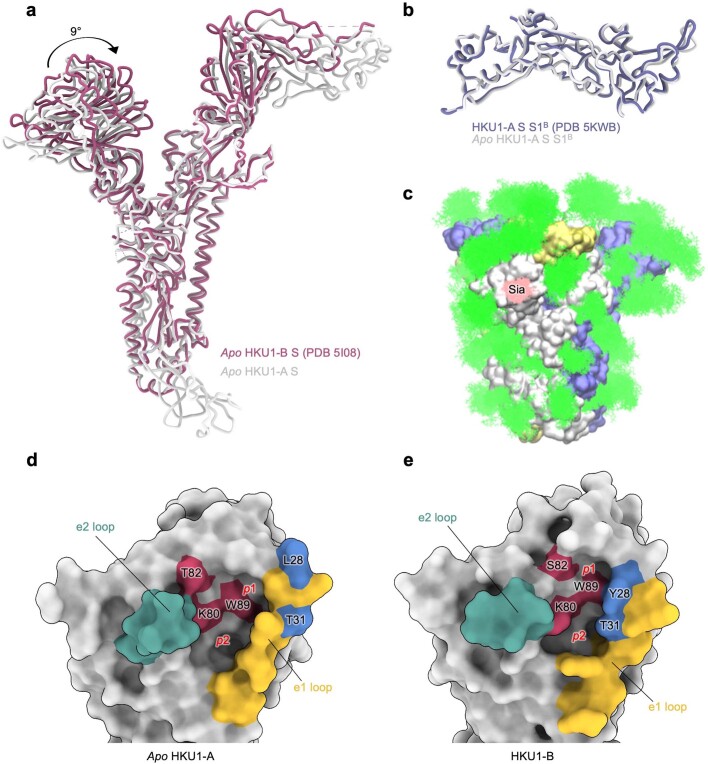
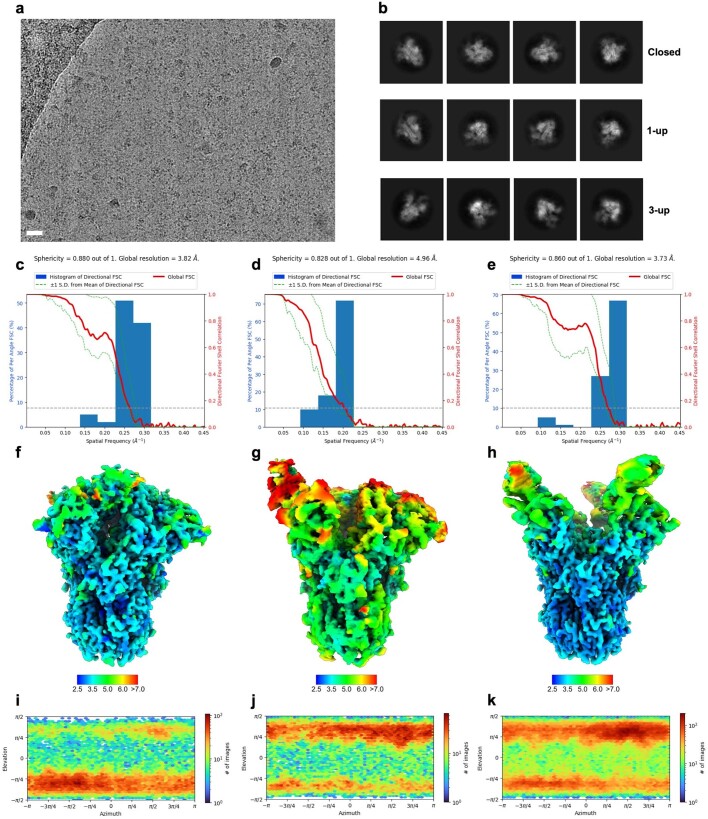
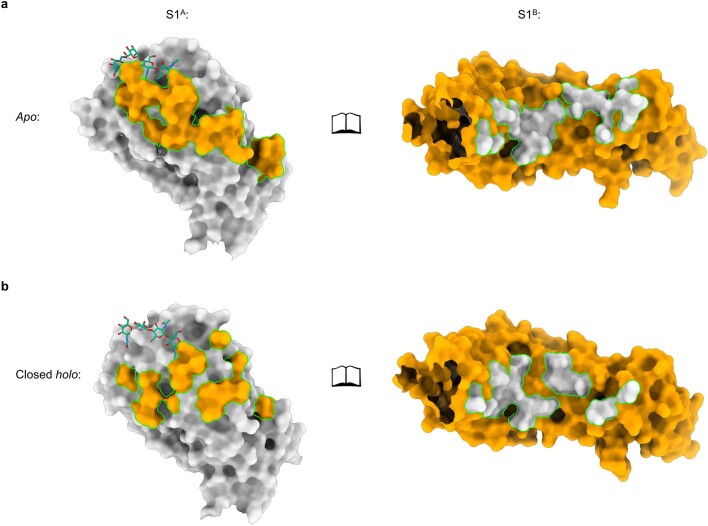
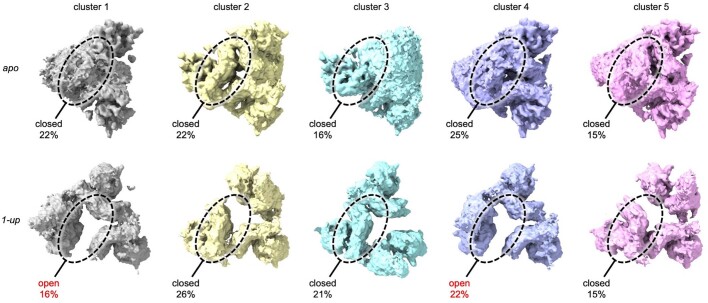
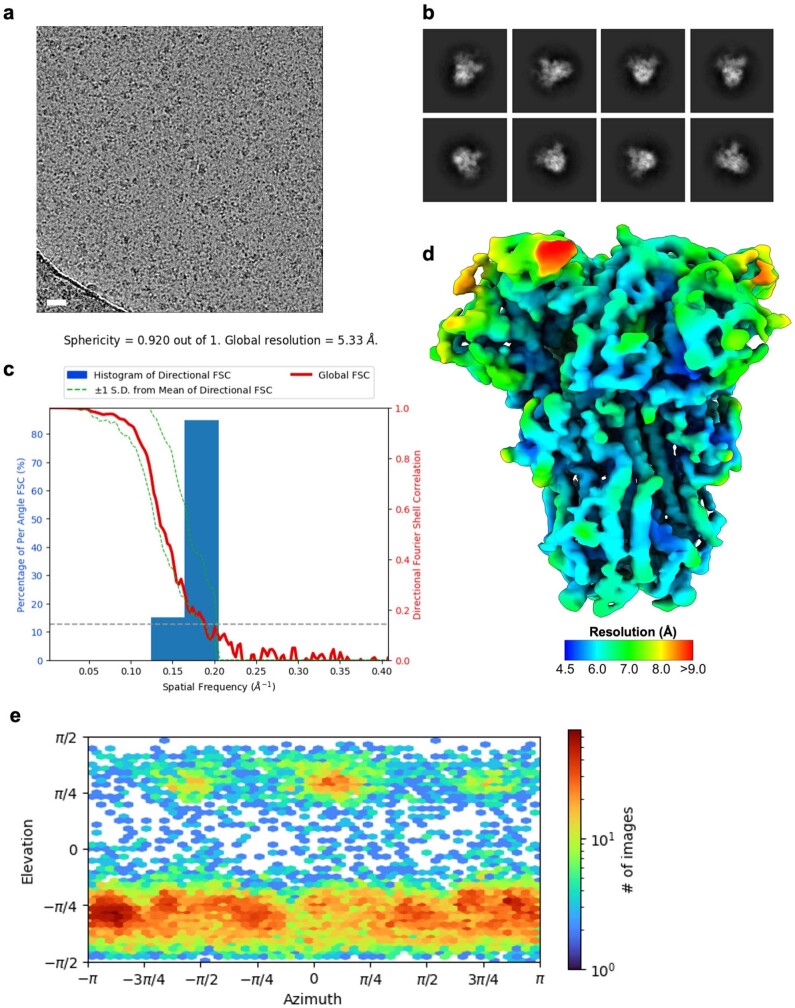
Coronavirus spike proteins mediate receptor binding and membrane fusion, making them prime targets for neutralizing antibodies. In the cases of severe acute respiratory syndrome coronavirus, severe acute respiratory syndrome coronavirus 2 and Middle East respiratory syndrome coronavirus, spike proteins transition freely between open and closed conformations to balance host cell attachment and immune evasion1-5. Spike opening exposes domain S1B, allowing it to bind to proteinaceous receptors6,7, and is also thought to enable protein refolding during membrane fusion4,5. However, with a single exception, the pre-fusion spike proteins of all other coronaviruses studied so far have been observed exclusively in the closed state. This raises the possibility of regulation, with spike proteins more commonly transitioning to open states in response to specific cues, rather than spontaneously. Here, using cryogenic electron microscopy and molecular dynamics simulations, we show that the spike protein of the common cold human coronavirus HKU1 undergoes local and long-range conformational changes after binding a sialoglycan-based primary receptor to domain S1A. This binding triggers the transition of S1B domains to the open state through allosteric interdomain crosstalk. Our findings provide detailed insight into coronavirus attachment, with possibilities of dual receptor usage and priming of entry as a means of immune escape.


Conflict of interest statement

I.D. is an employee of Thermo Fisher Scientific and M.F. is an employee of Biognos AB. The remaining authors declare no competing interests.

Figures

Fig. 1
Fig. 1. Cryo-EM structure of apo HKU1-A spike protein.
a, A linear representation of the HKU1-A spike protein primary sequence, coloured by domain and with the S1–S2 domains, S2′ protease cleavage site, signal peptide (SP), connecting domain (CD) and transmembrane helix (TM) indicated. b, A cryo-EM density map for apo HKU1-A spike protein, with previously unmodelled glycans indicated in green and newly modelled amino acids in yellow. c, The apo HKU1-A spike trimer with one Y-shaped protomer coloured by (sub)domain as in a.
Fig. 2
Fig. 2. Cryo-EM density maps of wild-type apo HKU1-A spike protein, its complex with a 9-O-acetylated disialoside and an equivalently ligand-bound W89A mutant.
a, Orthogonal views of the apo HKU1-A spike trimer density map with protomers coloured in grey, orange and blue. b, Density maps of HKU1-A spike protein in complex with the disialoside (in pink). Three distinct classes were observed, with either no, one or three S1B domains in the open conformation. Relative occurrence (%) is indicated. c, Cryo-EM density map of the W89A mutant HKU1-A spike protein obtained in presence of the disialoside.
Fig. 3
Fig. 3. Allosteric interdomain and intradomain rotations are observed following ligand binding.
a, Superposition of single HKU1-A spike protomers in the apo and ligand-bound closed holo state. The intrasubdomain axis of rotation in S1A is indicated as a dashed line; the disialoside is shown as spheres with carbon atoms in pink. b, Domain rotations associated with transition from the closed holo state to the holo up conformation (3-up state shown).
Fig. 4
Fig. 4. Comparison of the sialic acid-binding site in the apo and closed holo S1A domains.
a,b, The S1A sialic acid-binding pocket in the apo (a) and holo (b) states. The e1 loop (yellow), e2 loop (green) and pockets p1 and p2 are indicated. The disialoside (‘ligand’) is shown in pink; GlcNAc residues of the N29 N-linked glycan are shown in green. Note the conformational differences in the e1 loop in the holo as compared to the apo state. c,d, Side-by-side comparison of the S1A domain in the apo (c) and closed holo state (d). The hinge segments connecting subdomains S1A1 and S1A2 are highlighted with the e1 loop in yellow. Dashed lines indicate the angle between the subdomains.
Fig. 5
Fig. 5. MD analysis predicts S1A conformational transition.
a, An exemplar molecular dynamics simulation trajectory. Docking of the disialoside (purple diamonds) into the apo cryo-EM model (top) converts S1A into the stable holo state (bottom). b, New key hydrogen bonds and hydrophobic contacts form within 500 ns, altering the topologies of the e1 loop (shown in yellow in a) and the p1 and p2 pockets. Changes in inter-residue distances (y axis) plotted against time (x axis). See also Supplementary Video 7.
Fig. 6
Fig. 6. Proposed model for HKU1-A spike host cell engagement.
The HKU1-A spike engages a primary carbohydrate receptor, containing a 9-O-acetylated α2,8-linked disialoside, through the S1A domain. This causes the allosteric opening of the neighbouring S1B domain, which then binds to a putative secondary receptor. Created with BioRender.com.
Extended Data Fig. 1
Extended Data Fig. 1. Cryo-EM data processing of the apo HKU1-A spike ectodomain.
a, Representative motion-corrected micrograph out of ~4,200 similar micrographs. Scale bar = 50 nm. b, Representative reference-free 2D class averages generated in cryoSPARC. c, 3DFSC plot for the 3.4 Å resolution globally refined reconstruction. d, DeepEMhancer filtered EM density map for the apo HKU1-A spike ectodomains coloured according to local resolution which was calculated in cryoSPARC. e, Angular distribution plot calculated in cryoSPARC for particle projections in the globally refined map.
Extended Data Fig. 2
Extended Data Fig. 2. Comparison of our apo HKU1-A spike structure with previously published structures and visualisation of its glycan shield.
a, Comparison of our apo HKU1-A spike (S) structure (in grey) with the previously published structure of full-length HKU1-B spike (dark pink). b, Comparison of our HKU1-A S1B domain structure with the previously published HKU1-A S1B domain crystal structure (purple). c, Molecular dynamics (MD)-derived glycan coverage map of the HKU1 spike ectodomain (250 ns, 310 K). Full N-glycans (as shown for chain A, see Supplementary Fig. 16a) were attached based on previously published data where available. The spike protomers are coloured grey, blue and yellow and the N-linked glycans and bound disialoside (Sia) are coloured green and pink, respectively. To highlight the dynamics of the N-glycans, 250 snapshots extracted at time intervals of 1 ns are shown overlayed. d, Surface representation of the apo HKU1-A sialic acid binding site. Residues critical for sialic acid binding are coloured ruby and selected e1 loop residues are coloured blue. The location of the p1 and p2 pockets are indicated. e, Surface representation of the HKU1-B sialic acid binding site (PDB ID: 5I08), same colouring as panel d.
Extended Data Fig. 3
Extended Data Fig. 3. Cryo-EM data processing of the holo HKU1-A spike ectodomain.
a, Representative motion-corrected micrograph out of ~4,000 similar micrographs. Scale bar = 50 nm. b, Representative reference-free 2D class averages of the closed, 1-up and 3-up reconstructions generated in cryoSPARC. c, 3DFSC plot for the closed, d, 1-up and e, 3-up globally refined reconstructions. f, DeepEMhancer filtered EM density map for the closed, g, 1-up and h, 3-up holo HKU1-A spike ectodomains coloured according to local resolution which was calculated in cryoSPARC. i, Angular distribution plot calculated in cryoSPARC for particle projections in the closed, j, 1-up and k, 3-up globally refined maps.
Extended Data Fig. 4
Extended Data Fig. 4. Comparison of S1A-S1B interface between apo and closed holo shows a smaller interaction footprint for the latter.
a, Open book representation of the apo S1A-S1B interface. Interacting surfaces are visualised in the colour of the subunit it interacts with. N-linked glycans on S1A near the interface are indicated as green sticks. b, Idem for the closed holo S1A-S1B interface.
Extended Data Fig. 5
Extended Data Fig. 5. 3D variability analysis of the apo and 1-up HKU1-A data sets.
3D variability analysis of the symmetry expanded apo HKU1-A particles indicated that there are no detectable open S1B domains present in the data. In contrast, this method could discriminate between open and closed S1B domains in the holo 1-up data set, used as control to show the validity of this approach. The region which was masked during the analysis is circled.
Extended Data Fig. 6
Extended Data Fig. 6. Cryo-EM data processing of the W89A HKU1-A spike ectodomain incubated with disialoside.
a, Representative motion-corrected micrograph out of ~900 similar micrographs. Scale bar = 50 nm. b, Representative reference-free 2D class averages generated in cryoSPARC. c, 3DFSC plot for the 5.3 Å resolution globally refined reconstruction. d, DeepEMhancer filtered EM density map for the apo HKU1-A spike ectodomains coloured according to local resolution which was calculated in cryoSPARC. e, Angular distribution plot calculated in cryoSPARC for particle projections in the globally refined map.
Extended Data Fig. 7
Extended Data Fig. 7. Molecular dynamics simulations of the free disialoside.
10 µs MD-based conformational analysis of Neu5,9Ac2-α2,8-Neu5Ac-αOMe in explicit solvent. a, Example 3D structure with annotations of residue labels used (GLYCAM residue type labels are shown in brackets), atom numbering scheme and torsions (φ = C1-C2-O8-C8, ψ = C2-O8-C8-C7, γ = O8-C8-C7-C6, δ = C8-C7-C6-O6). b, Free energy φ/ψ map. (c, d) Trajectory plots and histograms of torsions φ, ψ, γ and δ. Conformational transitions between the population maxima (local energy minima) are fast for φ and γ. Only few transitions occurred for ψ and δ on a 10 µs timescale. Torsion δ has practically only one orientation (about −60°). Data were analysed using Conformational Analysis Tools.
Extended Data Fig. 8
Extended Data Fig. 8. MD-derived interactions of the HKU1 spike - α2,8 disialoside complex.
a, MD-derived pseudo-electron density of the disialoside ligand (PSA2, purple) in the binding pocket of the S1A domain (grey, see supplementary video 6 for a 3D view). Data were derived from 3 μs MD simulations of S1A (residues 14-299) based on the holo cryo-EM model (N-glycans, green, see Supplementary Fig. 16b). b, left panel: trajectory plots of the most populated, individual hydrogen bonds between the ligand (molecule 2) and S1A (molecule 1). Individual simulations are separated by vertical lines. Labels are formatted as follows: donor (D), acceptor (A), molD:resD:atomD_molA:resA:atomA, (see Extended Data Fig. 7a). Donor H atoms were omitted from the labels. A geometric H-bond criterion, defined as distance (D-A) ≤ 3.2 Å and angle (D-H-A) ≥ 120°, was used. Right panel: complex H-bond interactions of the carboxyl groups of SIA1 and SIA2 involve two equivalent acceptor atoms (O1A and O1B) and potentially multiple, equivalent donor H-atoms (e.g. three in Lys:NZ). Trajectory plots show complex H-bond interactions where equivalent H-bonds at a given time were combined and their number is indicated as shades of green. c, Histogram of the distance K84(NZ)-SIA1(O1) showing a high probability for a salt bridge between the amino group of K84 and the carboxylate group of SIA1. d, Histograms of favourable, stabilising contacts (as defined in Supplementary Table 5) between the individual moieties of the disialoside ligand and the S1A domains of HKU1 strains Caen1 or N1. A notable decrease in stabilising contacts with the reducing end SIA1 can be seen in HKU1 N1, potentially due to the absence of K84 (see also the hydrogen bond analyses in Supplementary Tables 3–4).
Extended Data Fig. 9
Extended Data Fig. 9. Dynamics of the α2-8 linkage of the disialoside in the complex.
Dynamics in the α2-8 linkage are reduced but remain possible when the disialoside is bound to HKU1-A Caen1. a, Trajectory plots of linkage torsions φ, ψ, γ and δ. In comparison to the dynamics of the disaccharide in the free state (Extended Data Fig. 7), there is a clear reduction in the conformational transition frequency for torsions φ and γ. b, Histograms of linkage torsions φ, ψ, γ and δ. In comparison to the profiles of the disaccharide in the free state (red curves) there is a clear reduction in accessible conformational space for torsions γ. Whereas in the free state there are three population maxima, there is now a clear preference for a value around 210°. Data were derived from the same MD simulations shown in Extended Data Fig. 8.
Extended Data Fig. 10
Extended Data Fig. 10. Dynamics of HKU1 spike S1A.
All MD simulations performed with the Caen1 (a) and N1 sequence (b) were combined for an RMSD analysis based on the holo cryo-EM model as a reference structure. Conformational changes from the apo into the holo state are apparent as transitions from high (red) to low (blue) RMSD states. Simulations performed with the N1 strain sequence were based on the apo cryo-EM model of Caen1, replacing respective residues different in N1. Individual simulations (a: 33, b: 69) are separated by vertical lines. The spontaneous conformational shifts of the e1 loop, observed in the simulations starting with the disialoside (PSA2) bound to the apo cryo-EM conformation of the Caen1 and N1 spike proteins are indicated with red arrows. Simulations based on the holo EM model with PSA2 or other Neu5,9Ac-containing ligands show ligand-induced stabilisation of the e1 conformational shift.

Similar articles

Cited by

References

    1. Walls AC, et al. Glycan shield and epitope masking of a coronavirus spike protein observed by cryo-electron microscopy. Nat. Struct. Mol. Biol. 2016;23:899–905. doi: 10.1038/nsmb.3293. - DOI - PMC - PubMed
    1. Yuan Y, et al. Cryo-EM structures of MERS-CoV and SARS-CoV spike glycoproteins reveal the dynamic receptor binding domains. Nat. Commun. 2017;8:e42166. doi: 10.1038/ncomms15092. - DOI - PMC - PubMed
    1. Walls AC, et al. Structure, function, and antigenicity of the SARS-CoV-2 spike glycoprotein. Cell. 2020;181:281–292. doi: 10.1016/j.cell.2020.02.058. - DOI - PMC - PubMed
    1. Walls AC, et al. Unexpected receptor functional mimicry elucidates activation of coronavirus fusion. Cell. 2019;176:1026–1039. doi: 10.1016/j.cell.2018.12.028. - DOI - PMC - PubMed
    1. Gui M, et al. Cryo-electron microscopy structures of the SARS-CoV spike glycoprotein reveal a prerequisite conformational state for receptor binding. Cell Res. 2017;27:119–129. doi: 10.1038/cr.2016.152. - DOI - PMC - PubMed

MeSH terms