

Negative log-binomial model with optimal robust variance to estimate the prevalence ratio, in cross-sectional population studies
- PMID: 37794385
- PMCID: PMC10548589
- DOI: 10.1186/s12874-023-01999-1
Negative log-binomial model with optimal robust variance to estimate the prevalence ratio, in cross-sectional population studies
Abstract
Background: Cross-sectional studies are useful for the estimation of prevalence of a particular event with concerns in specific populations, as in the case of diseases or other public health interests. Most of these studies have been carried out with binary binomial logistic regression model which estimates OR values that could be overestimated due to the adjustment of the model. Thus, the selection of the best multivariate model for cross-sectional studies is a priority to control the overestimation of the associations.
Methods: We compared the precision of the estimates of the prevalence ratio (PR) of the negative Log-binomial model (NLB) with Mantel-Haenszel (MH) and the regression models Cox, Log-Poisson, Log-binomial, and the OR of the binary logistic regression in population-based cross-sectional studies. The prevalence from a previous cross-sectional study carried out in Colombia about the association of mental health disorders with the consumption of psychoactive substances (e.g., cocaine, marijuana, cigarette, alcohol and risk of consumption of psychoactive substances) were used. The precision of the point estimates of the PR was evaluated for the NLB model with robust variance estimates, controlled with confounding variables, and confidence interval of 95%.
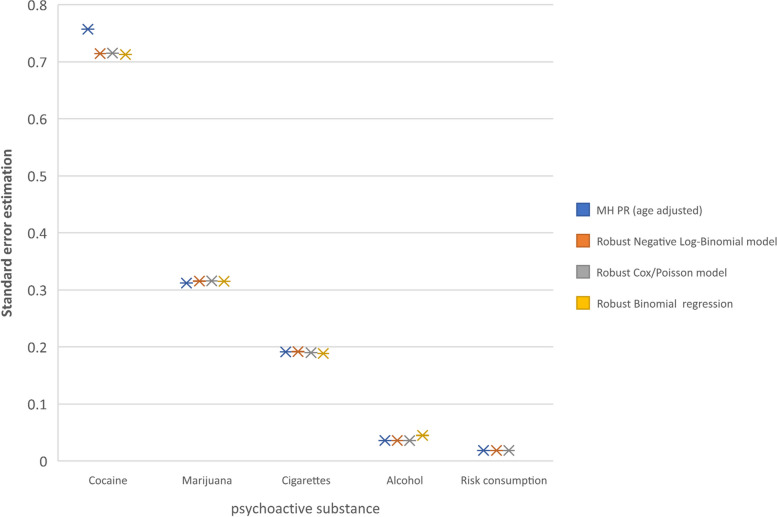
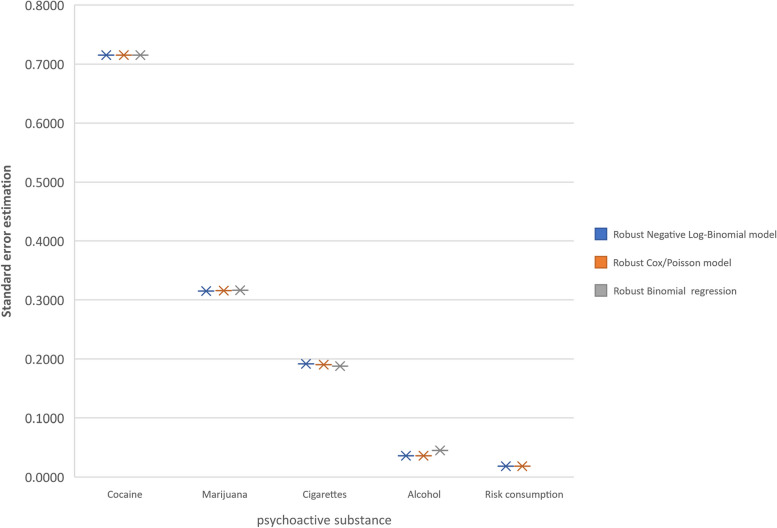
Results: The NLB model adjusted with robust variance showed accuracy in the measurements of crude PRs, standard errors of estimate and its corresponding confidence intervals (95%CI) as well as a high precision of the PR estimate and standard errors of estimate after the adjustment of the model by grouped age compared with the MH PR estimate. Obtained PRs and 95%CI entre NLB y MH were: cocaine consumption (2.931,IC95%: 0.723-11.889 vs. 2.913, IC95%: 0.786-12.845), marijuana consumption (3.444, IC95%: 1.856-6.391 vs. 3.407, IC95%: 1.848, 6.281), cigarette smoking (2.175,IC95%: 1.493, 3.167 vs. 2.209, IC95%: 1.518-3.214), alcohol consumption (1.243,IC95%: 1.158-1.334 vs. 1.241, IC95%: 1.157-1.332), and risk of consumption of psychoactive substances (1.086, IC95%: 1.047-1.127 vs. 1.086, IC95%: 1.047, 1.126). The NLB model adjusted with robust variance showed mayor precision when increasing the prevalence, then the other models with robust variance with respect to MH.
Conclusions: The NLB model with robust variance was shown as a powerful strategy for the estimation of PRs for cross-sectional population-based studies, as high precision levels were identified for point estimators, standard errors of estimate and its corresponding confidence intervals, after the adjustment of confounding variables. In addition, it does not represent convergence issues for high prevalence cases (as it occur with the Log-binomial model) and could be considered in cases of overdispersion and with greater precision and goodness of fit than the other models with robust variance, as it was shown with the data set of the cross-sectional study used in here.
Keywords: Cross-Sectional Studies; Logistic Models; Maximum Likelihood Estimation and Binomial Distribution; Odds Ratio; Prevalence Ratio.
© 2023. BioMed Central Ltd., part of Springer Nature.
Conflict of interest statement
The authors declare that they have no competing interests.
Figures
Similar articles
-
Logistic Regression: Limitations in the Estimation of Measures of Association with Binary Health Outcomes.Acta Med Port. 2024 Oct 1;37(10):697-705. doi: 10.20344/amp.21435. Epub 2024 Oct 1. Acta Med Port. 2024. PMID: 39366365
-
Alternatives for logistic regression in cross-sectional studies: an empirical comparison of models that directly estimate the prevalence ratio.BMC Med Res Methodol. 2003 Oct 20;3:21. doi: 10.1186/1471-2288-3-21. BMC Med Res Methodol. 2003. PMID: 14567763 Free PMC article.
-
Methods for estimating prevalence ratios in cross-sectional studies.Rev Saude Publica. 2008 Dec;42(6):992-8. Rev Saude Publica. 2008. PMID: 19009156 English, Portuguese.
-
A practical guide for multivariate analysis of dichotomous outcomes.Ann Acad Med Singap. 2009 Aug;38(8):714-9. Ann Acad Med Singap. 2009. PMID: 19736577 Review.
-
Statistical Issues in Estimation of Adjusted Risk Ratio in Prospective Studies.Arch Iran Med. 2015 Oct;18(10):713-9. Arch Iran Med. 2015. PMID: 26443254 Review.
Cited by
-
Burnout syndrome and psychological workplace violence among Peruvian physicians: a cross-sectional study.BMC Health Serv Res. 2025 Apr 30;25(1):625. doi: 10.1186/s12913-025-12387-4. BMC Health Serv Res. 2025. PMID: 40307790 Free PMC article.
-
Prevalence of Type 2 Diabetes, Overweight, Obesity, and Metabolic Syndrome in Adults in Bogotá, Colombia, 2022-2023: A Cross‑Sectional Population Survey.Ann Glob Health. 2024 Nov 11;90(1):67. doi: 10.5334/aogh.4539. eCollection 2024. Ann Glob Health. 2024. PMID: 39554696 Free PMC article.
References
-
- Velasco-Mondragón HE, Hernández B. Encuestas transversales Rev Cubana Hig Epidemiol. 2007;45:447–455.
-
- Ibáñez PM. Mentefactos conceptuales como estrategia didácticopedagógica de los conceptos básicos de la teoría de muestreo aplicados en investigación en salud. Rev Ciencias la Salud. 2006;4:62–72.
MeSH terms
Substances
LinkOut - more resources
Full Text Sources
Research Materials
