

The neuroanatomical substrates of autism and ADHD and their link to putative genomic underpinnings
- PMID: 37794485
- PMCID: PMC10552404
- DOI: 10.1186/s13229-023-00568-z
The neuroanatomical substrates of autism and ADHD and their link to putative genomic underpinnings
Abstract
Background: Autism spectrum disorders (ASD) are neurodevelopmental conditions accompanied by differences in brain development. Neuroanatomical differences in autism are variable across individuals and likely underpin distinct clinical phenotypes. To parse heterogeneity, it is essential to establish how the neurobiology of ASD is modulated by differences associated with co-occurring conditions, such as attention-deficit/hyperactivity disorder (ADHD). This study aimed to (1) investigate between-group differences in autistic individuals with and without co-occurring ADHD, and to (2) link these variances to putative genomic underpinnings.
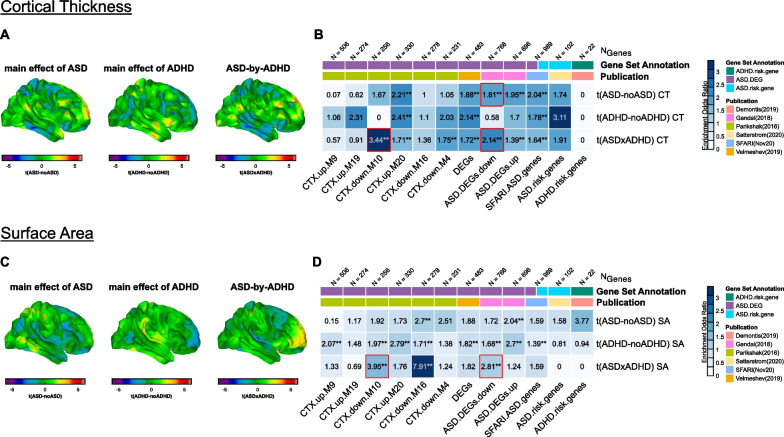
Methods: We examined differences in cortical thickness (CT) and surface area (SA) and their genomic associations in a sample of 533 individuals from the Longitudinal European Autism Project. Using a general linear model including main effects of autism and ADHD, and an ASD-by-ADHD interaction, we examined to which degree ADHD modulates the autism-related neuroanatomy. Further, leveraging the spatial gene expression data of the Allen Human Brain Atlas, we identified genes whose spatial expression patterns resemble our neuroimaging findings.
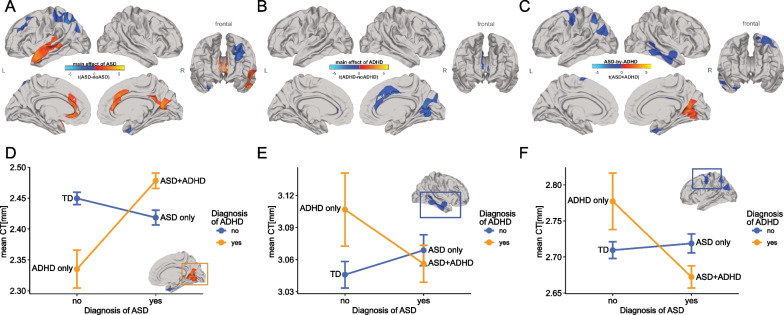
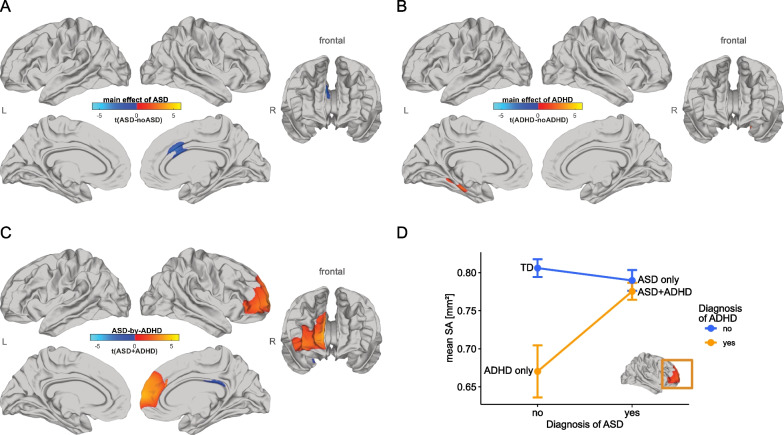
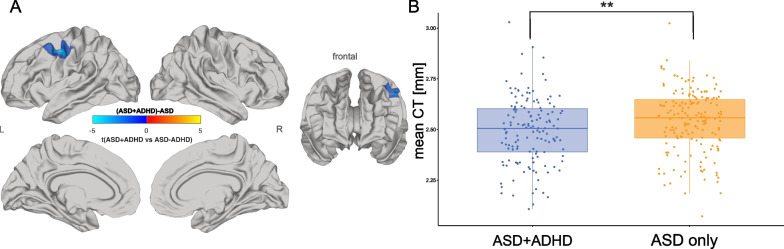
Results: In addition to significant main effects for ASD and ADHD in fronto-temporal, limbic, and occipital regions, we observed a significant ASD-by-ADHD interaction in the left precentral gyrus and the right frontal gyrus for measures of CT and SA, respectively. Moreover, individuals with ASD + ADHD differed in CT to those without. Both main effects and the interaction were enriched for ASD-but not for ADHD-related genes.
Limitations: Although we employed a multicenter design to overcome single-site recruitment limitations, our sample size of N = 25 individuals in the ADHD only group is relatively small compared to the other subgroups, which limits the generalizability of the results. Also, we assigned subjects into ADHD positive groupings according to the DSM-5 rating scale. While this is sufficient for obtaining a research diagnosis of ADHD, our approach did not take into account for how long the symptoms have been present, which is typically considered when assessing ADHD in the clinical setting.
Conclusion: Thus, our findings suggest that the neuroanatomy of ASD is significantly modulated by ADHD, and that autistic individuals with co-occurring ADHD may have specific neuroanatomical underpinnings potentially mediated by atypical gene expression.
Keywords: ADHD; ASD; Comorbidity; Imaging-genetics; Neurodevelopmental disorders; Structural MRI.
© 2023. BioMed Central Ltd., part of Springer Nature.
Conflict of interest statement
The IMI-JU2 had no role in the design of the study; in the collection, analyses, or interpretation of data; in the writing of the manuscript, or in the decision to publish the results. Any views expressed are those of the author(s) and not necessarily those of the IMI-JU2. Jan K. Buitelaar has been in the past 3 years a consultant to/member of advisory board of/and/or speaker for Janssen Cilag BV, Takeda/Shire, Roche, Novartis, Medice, Angelini, and Servier. He is not an employee of any of these companies and not a stock shareholder of any of these companies. He has no other financial or material support, including expert testimony, patents, and royalties. Tobias Banaschewski has served in an advisory or consultancy role for Actelion, Hexal Pharma, Lilly, Medice, Novartis, Oxford outcomes, Otsuka, PCM scientific, Shire and Viforpharma. He received conference support or speaker’s fee by Medice, Novartis and Shire. He is/has been involved in clinical trials conducted by Shire and Viforpharma. He received royalties from Hogrefe, Kohlhammer, CIP Medien, and Oxford University Press. The present work is unrelated to the above grants and relationships. Julian Tillmann is a consultant for F. Hoffmann-La Roche Ltd. Chris H. Chatham is an employee of F. Hoffmann–La Roche. Tony Charman has received research grant support from the Medical Research Council (UK), the National Institute for Health Research, Horizon 2020 and the Innovative Medicines Initiative (European Commission), MQ, Autistica, FP7 (European Commission), the Charles Hawkins Fund, and the Waterloo Foundation. He has served as a consultant to F. Hoffmann-La Roche Ltd and Servier. He has received royalties from Sage Publications and Guilford Publications. Declan G. Murphy has received consultancy fees from Roche and Servier, and grant support from the Medical Research Council (UK), the National Institute for Health Research, Horizon 2020 and the Innovative Medicines Initiative (European Commission). Lisa M. Berg, Tim Schaefer, Caroline Gurr, Johanna Leyhausen, Hanna Seelemeyer, Charlotte M. Pretzsch, Bethany Oakley, Eva Loth, Dorothea L. Floris, Christian F. Beckmann, Emily J.H. Jones, Thomas Bourgeron, and Christine Ecker reported no biomedical financial interests or potential conflicts of interest.
Figures
References
-
- American Psychiatric Association (APA). Diagnostic and statistical manual of mental disorders (DSM-5®). 2013. - PubMed
-
- Ecker C, Bookheimer SY, Murphy DGM. Neuroimaging in autism spectrum disorder: brain structure and function across the lifespan. Lancet Neurol. 2015;14(11):1121–1134. - PubMed
-
- van Rooij D, Anagnostou E, Arango C, Auzias G, Behrmann M, Busatto GF, et al. Cortical and subcortical brain morphometry differences between patients with autism spectrum disorder and healthy individuals across the lifespan: results from the ENIGMA ASD working group. Am J Psychiatry. 2018;175(4):359–369. - PMC - PubMed
-
- Ecker C. The neuroanatomy of autism spectrum disorder: an overview of structural neuroimaging findings and their translatability to the clinical setting. Autism. 2017;21:18–28. - PubMed
-
- Leyfer OT, Folstein SE, Bacalman S, Davis NO, Dinh E, Morgan J, et al. Comorbid psychiatric disorders in children with autism: interview development and rates of disorders. J Autism Dev Disord. 2006;36(7):849–861. - PubMed
Publication types
MeSH terms
Grants and funding
LinkOut - more resources
Full Text Sources
Medical
